
Distribution,risk evaluation,and source analysis of the heavy metals in the sediment deposition of the lower Shichuanhe River,Shaanxi,China
2023-10-13 01:16ChenhuiHouCaixiaFengShenLiu
Acta Geochimica 2023年5期
Chenhui Hou • Caixia Feng • Shen Liu
Abstract In this study,30 sediment samples were collected from the lower reaches of the Shichuanhe River in Xi’an,Shaanxi Province,China,to test the distribution of heavy metal elements in this area and for an analysis of the pollution levels of this area,hope to provide guidance on agricultural production activities in this region.The results show that the heavy metal elements in this area are mainly concentrated at the Qinghe River and Shichuanhe River confluences.Furthermore,the element contents are higher than that of the background levels of the continental crust(UCC) and close to the background levels of the soil from Shaanxi Province;the two most enriched elements are Cd and As,with contents of 0.79 and 22.7 mg∙kg-1,respectively,and their contents are 3.8 and 1.72 times higher than that of the background values.Herein,the heavy metal pollution assessment methods applied indicated that Cd and As are the two most abundant pollutant elements in the area’s soils.As has a peak geo-accumulation index value of 3,and the pollution level is high,while Cd exhibits high potential ecological risks due to its high toxicity (potential risk index of 143)and an active fraction of more than 64%.In addition,a principal component analysis and hierarchical cluster analysis study showed that there are two sources of the heavy metals in this area.The Zn,As,Ni,Cu,Pb,and Cr are mainly from natural sources,and the Cd likely comes from a discharge of untreated agricultural wastewater in the region.The Cd which poses a high potential risk and mainly results from human activities,needs to be further monitored.
Keywords Distribution ∙Risk evaluation ∙Source analysis ∙Heavy metals ∙Sediment ∙Ecological risk
1 Introduction
The sediment deposited from a body of water can potentially provide key information on local water quality and environmental pollution (Jin 2011).Growth in industrial development around a river or its catchment area increases the likelihood of wastewater evacuation,gas emission and solid transfer,and accumulation,which contribute to its sediment load.This input is principally generated by the means of dust fall and surface runoff(Gao and Chen 2012),resulting in the presence of a large number of anthropogenic pollutants in the sediment.On the basis of existing research,in the Ganges River area,the pollution level is higher in locations with higher domestic and industrial waste discharge (Nazir et al.2022).The heavy metal elements discharged into the water body will affect the concentrations of the elements in the bottom sediments (Lupi et al.2019);the elements will accumulate and be amplified via biological actions,thus causing potential long-term impacts on human health and ecosystem stability (Linnik 2001;Ding et al.2018).A large number of studies have shown that the content of heavy metals in the sediments of many water bodies around the world has reached toxic levels (e.g.,Lake Gehu,China) has As concentrations of 53.1–1204 mg∙kg-1and Cd concentrations of 0.87–4.08 mg∙kg-1,with an average potential risk index of 1117.71,showing an extremely strong ecological risk;Rainbow 2007;Xue et al.2007;Shi 2010;Xiong et al.2016).So far,the heavy metal pollution of sediments caused by human activities contributed to nearly 80% of the world’s population,resulting in problems with water quality safety (Yu et al.2011).Therefore,studying the distribution and pollution characteristics of the heavy metals in the sediments in order to understand the water quality of an environment is of great significance.
As the most important industrial and agricultural base and the largest populated area of the Shaanxi Province(Han et al.2012),the pollution of heavy metals in the Weihe River basin is extremely acute.Research has shown that,around the year 2005,the pollution of the Weihe River region was mainly concentrated in the urban area of Xi’an and some heavy industrial centers;the number of V-level water (all the water quality parameters exceeded the standard and could not be used for any purpose) samples from the Weihe River in Shaanxi Province increased from 18 to 95%,the maximum Zn increased from 80.7 to 132.4 mg∙kg-1,and the average Pb increased from 21.4 to 29.57 mg∙kg-1within 3 years (Liu et al.2005a,b;Lei et al.2008;Hua et al.2011).By 2018,50% of the monitoring sections returned to normal levels (heavy metal comprehensive potential ecological risk index below 150)due to the development of an environmental protection project (including the construction of sewage treatment plants,garbage removal,and the rectification of highly polluting enterprises,etc.),yet some areas still face continuous pollution(e.g.,the content of Cd is 0.331 mg∙kg-1,and all sample points exceed the soil background of Shaanxi;Yang et al.2018;Li et al.2020).
The disrepair of the Shichuanhe River channel and the construction of a reservoir resulting in the cutoff of the river’s flow introduced an accumulation of a large amount of garbage in the river channel and the direct discharge of wastewater into the river channel since 2016,resulting the serious pollution of the river channel and surrounding soil(Wei et al.2019).In 2016,the environmental remediation work at the Fuping section of the Shichuanhe River began.The pollution level of the river was decreased via the construction of sewage treatment facilities (the treatment measures include sedimentation tanks,a multistage biological contact oxidation reactor,a wetland filter,and UV disinfection;these measures can reduce pollutants including the chemical oxygen demand (COD),biochemical oxygen demand (BOD5),suspended solids (SS),ammonia nitrogen content index (NH3-N),total nitrogen (TN) and total phosphorus (TP) in sewage discharge;Shi and Sun 2020),the cultivation of protective forests,and other measures (Cao 2018).After improvements,the total salinity of groundwater in the Shichuanhe River basin has been reduced to 1.0 g/L,which has been restored to the standard of drinking water (Yanliang Water Bureau 2019).
As an agricultural area around Xi’an,65.4%of the lower reaches of the Shichuanhe River comprise agricultural land(Shi and Sun 2020),and the soil pollution of the land affects the safety of nearby food production.For a long period of time,the research on heavy metal pollution in sediments in this area has mainly been concentrated near the urban area of Xi’an(Liu et al.2005a,b;Lei et al.2008;Yu et al.2011;Hua et al.2011,2012;Song and Xue 2016;Yang et al.2018;Li et al.2020).The research on the lower reaches of the Shichuanhe River focused on water quality changes and river landscape construction (Cao 2018;Wei et al.2019;Yanliang Water Bureau 2019) without paying attention to the elemental content and change in sediment,which is unfavorable for the currently rapidly advancing Shichuanhe River governance operations.
Based on previous studies,this study attempts to discuss the distribution and pollution risk of heavy metal elements according to the studies on the distribution and character of seven heavy metal elements,including chromium (Cr),nickel (Ni),copper (Cu),zinc (Zn),cadmium (Cd),lead(Pb),and arsenic (As),in the sediments of the lower reaches of the Shichuanhe River.In conducting such studies,this research can provide a theoretical reference that should be significant for local pollution control operations.
2 Study area
The research area is located in the Lintong District,Xi’an,Shaanxi Province,China.It belongs to a warm temperate semiarid continental climate zone,and rainfall is concentrated in summer and autumn,rainfall is 558–750 mm/year and less than evaporation (1000–2000 mm/year),local terrain tends to level off from north to south (Yanliang Water Bureau 2019).
There are no rocks exposed in the study area.The main rivers in the study area are the Lower Shichuanhe River and its tributary,the Qinghe River.The Shichuanhe River originates from Tongchuan City,with a total length of 137 km,and it belongs to the tributary of the Weihe River.It flows into the Weihe River at Jiaokou Town in Lintong District(Ye and Niu 2019).The upper reaches of the study area are close to Mizi Industrial Park;the middle and lower reaches are densely populated areas.Farmland is widely distributed along the entire section of these rivers (Guo 2021).The Shichuanhe River flows for the most part across the Cenozoic to Quaternary loess;farmland in the area is continuous,and it is mainly planted with staple crops.The population of the middle reaches of the Shichuanhe River is 920 thousand in 2020,and sewage discharges far exceeded the treatment capacity.The sewage treatment plant and garbage landfill currently under construction are expected to be able to handle 40% of the solid and liquid discharge(Shi and Sun 2020),and there is still a large gap.Domestic and agricultural wastewater is still disorderly discharged into the Shichuanhe River,with the discharge amount reaching 1.7 million m3/a (Cao 2018;Yanliang Water Bureau 2019).
3 Materials and methods
3.1 Sampling points and sampling
The sediment samples used in this study were obtained from an area located in the lower reaches of the Shichuanhe River,between the confluences of the Qinghe and Shichuanhe rivers (Fig.1).The sampling points of this study were along the river banks,which exhibit high-sediment water content.In consideration that the flood season of the Weihe River basin is concentrated in June–September,sample collection was conducted in November 2021.A total of 5 sampling sections were made (Xiangqiao: CX;Hualiu: CH;Tianjia: CT;Gaotie: CG;Jiaokou: CJ),and 4–6 sampling points were chosen for each section.A total of 30 sediment samples were collected by a manual soil sampler.The sediment samples are mainly composed of argillaceous sediments;these were collected in polyethylene bags and taken back to the laboratory for study.
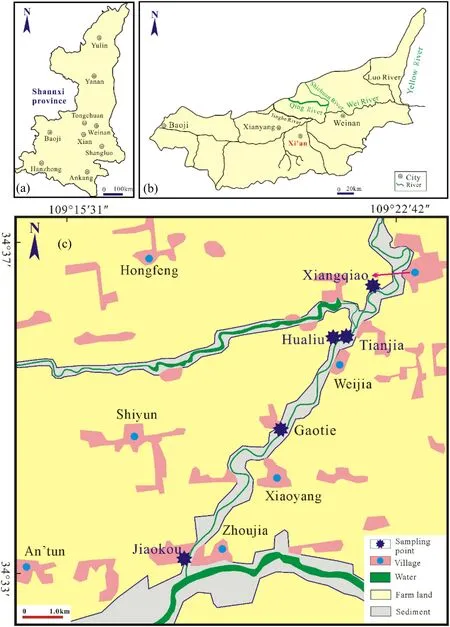
Fig.1 a Weihe River section in Shaanxi,China;b research area along the Weihe River;c more detailed map of the research area highlighting sample locations
3.2 Sample test and evaluation method
The sediment samples were sent to the laboratory and dried under natural conditions;gravelsized particles and plant roots were removed,and the sediment was then ground to 200 meshes (<74 μm).Samples were weighed at 0.2 g,and these are accurate to 0.0001 g;they were then placed into a 250 mL polytetrafluoroethylene beaker,with 24 mL of HCl and 8 mL of HNO3added.Then,the samples were dissolved at low temperatures for 1 h;after slight cooling,5 mL of HF (the HF was used to remove the silicon in samples) and 1 mL of HClO4were added,and heating continued until the white smoke was exhausted;15 mL of HCl(HCl:H2O=1:1)was added,heating occurred until it was completely dissolved,and then the sample was filtered.Standard substances were added,and the volume was fixed in a 100 mL volumetric flask.Then,the samples were analyzed by inductively coupled plasma mass spectrometry(Thermo Fisher ICP-MS) in a certified commercial laboratory(Guizhou Tongwei Testing Technology Co.,Ltd;Qi et al.2000);analytical accuracy and precision were within ± 5%.The speciation of heavy metal elements was determined on the Xi’an E-test platform using the PEOPTIMA 7000 full-spectrum direct reading inductively coupled plasma emission spectrometer from the United States (Wu 2013),and analytical accuracy was within ±5%.The test elements are Cr,Ni,Cu,Zn,As,Cd,and Pb.
Considering that the content of heavy metals in modern sediments varies greatly,the data on the regional background value and average crust were used as the evaluation criteria of the study area.Three methods were selected to evaluate the hazard of heavy metals: these are the geoaccumulation index ①(Abrahim and Parker 2008);the potential ecological risk index ②(Wang 2008;Huo 2009),and the ratios of secondary and primary phases(RSP;Wang et al.2012;Zhao et al.2013;Xiang et al.2020).Principal component analysis (PCA) and hierarchical cluster analysis (HCA) were also applied to help identify the potential source of any heavy metals present.The mathematical formulas of these indices are as follows:
where Ciis the measured content of the heavy metal i in sediment,mg∙kg-1;K is generally 1.5;C0iis the background of the heavy metal i in this area,mg∙kg-1;Tiris the toxicity response coefficient of the element,dimensionless;Eiris a potential ecological risk of element i,dimensionless;RI is the comprehensive potential ecological risk index of a sample point,dimensionless;F1 is the mild acidsoluble fraction,F2 is the reducible fraction;F3 is the oxidisable fraction;F4 is the residual fraction,mg∙kg-1.
PCA and HCA were completed using SPSS 19,and other statistical analyses were completed using Excel.
4 Experimental results
4.1 Test results and spatial distribution of heavy metals
Via a descriptive statistical analysis of the heavy metal test results at several sampling points,the contents of seven heavy metal elements are presented in Table 1.From an examination of these data,it can be observed that Zn has the highest average concentration of all elements at 67.90 mg∙kg-1,while Cd has the lowest concentration out of the samples at 0.41 mg∙kg-1.The accumulation trend of heavy metals is Zn (67.9 mg∙kg-1)>Cr (66.6 mg∙kg-1)->Ni (22.9 mg∙kg-1)>Cu (23.0 mg∙kg-1)>Pb (21.2 mg∙kg-1)>As (17.9 mg∙kg-1)>Cd (0.41 mg∙kg-1).Compared with the values for the upper continental crust(UCC;Taylor and Mclennan 1985),83%of Cu,63%of Zn,and 26% of Pb in the sediments among the samples were lower than for the UCC content,and they were the least enriched elements in the area;100%of the sample points of Cr,Ni,As,and Cd were all higher than UCC,and the enrichment degree was higher than Cu,Zn,and Pb.Compared with the background value of Shaanxi soil(Hou 2020),the content of various elements is close to or slightly less than that for Shaanxi soil,in which the Pb concentration is completely lower than the background value of the soil,while the Cr,Ni,and Zn concentrations are 0.80–1.07,0.76–1.13,and 0.74–1.17 times higher compared with the background values,respectively.The arsenic(As)level is 1.19–1.72 times more than the background value;the Cd level is 1.30–3.80 times more than the background value.The coefficient of variation of the seven elements is between 6.2 and 19.7;Cr,Ni,As,and Pb exhibit low variations(<10);Cu,Zn,and Cd exhibit medium variation (10 <variation <50).Meanwhile,the analysis of variance(ANOVA)result shows that the contents of Ni (F=4.47,P=0.007),Cu (F=3.763,P=0.016),Zn (F=5.73,P=0.002),As (F=2.96,P=0.039),and Pb(F=3.21,P=0.029)show significant differences among the five sample points,but the difference for Cr and Cd is not significant (P>0.05).This indicates that the spatial differentiation of elements in this area is not strong,and there is no obvious impact on human activities.
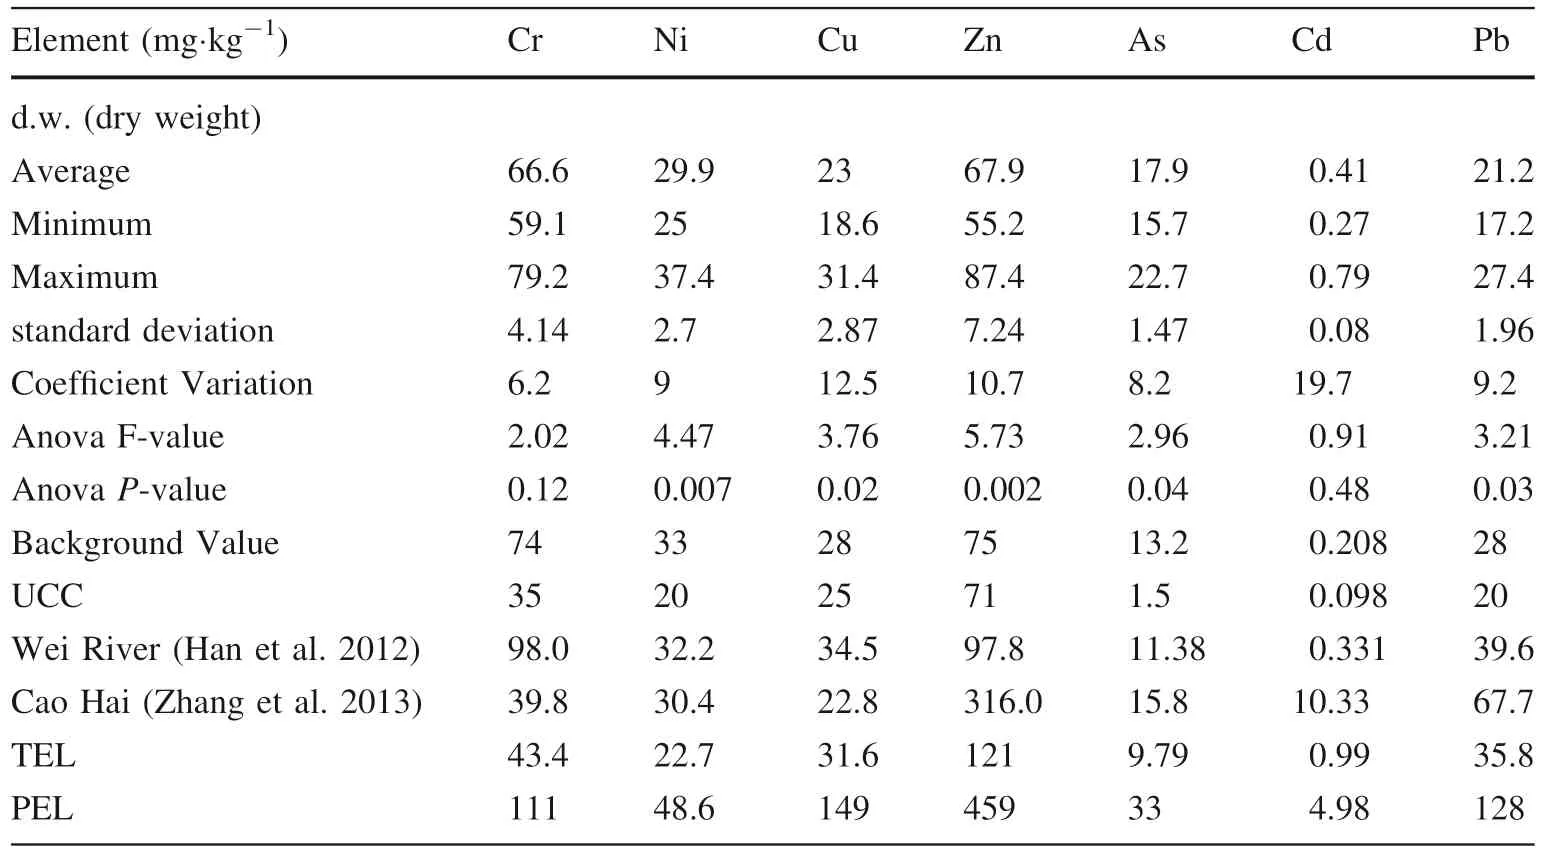
Table 1 Statistical results of heavy metals concentration(mg∙kg-1) in sediments and their background value in this region
The quality baseline threshold of sediment (SQG;Macdonald et al.2000;Tang et al.2017) includes the threshold effect level (TEL) and possible effect level(PEL).If the concentration of pollutants is lower than the TEL value,there is no confirmed negative impact on benthos;if it is higher than the PEL value,it will have a significant negative effect on the benthos (Yuan et al.2020).By comparing the element concentration in this area with SQG (Fig.2),the average concentration of Cu(23.0 mg∙kg-1),Zn (67.9 mg∙kg-1),Cd (0.41 mg∙kg-1),and Pb (21.23 mg∙kg-1) is lower than TEL,and negative effects were not observed in the benthos;in contrast,the contents of Cr (66.62 mg∙kg-1),Ni (22.93 mg∙kg-1),and As(17.93 mg∙kg-1)are between the two lines,and this has a negative effect on parts of the benthos.

Fig.2 Heavy metal distribution changes
It can be observed from Fig.2 that the highest concentrations of Ni (22.93 mg∙kg-1),Cu (23.0 mg∙kg-1),Zn(67.9 mg∙kg-1),As (17.93 mg∙kg-1),and Pb(21.23 mg∙kg-1) elements appear at sampling point CT1,which is 1.87,1.26,1.23,15.13,and 1.37 times the values for UCC,respectively.The maximum values of Cr and Cd appear in CJ5,which are 2.26 and 8.07 times the UCC,and CT1 has the second highest Cr concentration.It is highlighted that these two locations are the areas with the highest concentration of heavy metals among all sampling points.CT1 and CJ5 are landforms that occur at the river confluences: CT1 is where the Qinghe River enters the Shichuanhe River,and CJ5 is where the Shichuanhe River enters the Weihe River;clearly,these sample sites are affected by the two rivers.
The variation trend for heavy metal concentrations at the sampling points from the confluence of the Qinghe River to the confluence of the Weihe River is generally stable,but the concentrations at sampling point CH3,where can be seen in Fig.2 that except for Cd,are significantly lower than those at other nearby sampling points;CH3 is the low point in the center of the sampling area.Overall,the spatial distribution of heavy metals is relatively low in the Xiangqiao area and varies greatly in the Jiaokou area,while the other three sampling points in the middle are relatively uniform.
In summary,all lowest average concentration values of Cr,Ni,Cu,Zn,As,and Pb are at the Xiangqiao area,and the concentration value of heavy metals at the confluence of the Qinghe is the highest,as it is the center of the enrichment of heavy metals in this area.
4.2 Results of various pollution assessment methods
4.2.1 Geo-accumulation index and potential ecological risk assessment
As is evident in Fig.3,taking UCC as the evaluation standard,the geo-accumulation index (Igeo) values of Zn(-0.95 to-0.28),Cu(-1.01 to-0.26),and Pb(-0.80 to -0.13) are negative between all the sampling points,and these are the lowest elements in the study area,being within the safe ranges (≤0);47% of the sampling points have Ni (-0.26 to 0.32) Igeo higher than zero,putting them within the slightly harmful range(0 <Igeo≤1.0);all the Cr (0.17–0.59) is higher than 0 but below 1,putting them within the slightly harmful range.The indices of As(2.80– 3.33) and Cd (0.89– 2.43) elements range from medium (1 <Igeo≤3) to strong (3.0 <Igeo≤5.0) levels of pollution,and these are the two elements inflicting the greatest amount of harm among all the investigated elements.Among them,the accumulation index of As in half of the sample sites is above 3,which is indicative of extremely strong pollution;its peak appears at the confluence of the Qinghe River.However,the maximum (2.43)and minimum (0.89) values of Cd all appear near the confluence of the Shichuanhe River around Jiaokou Town.Taking Shaanxi’s background value as a standard,the geoaccumulation indices of Cr,Ni,Cu,Zn,and Pb are all less than 0,which is within the safe range;in contrast,the areas with As (-0.335 to 0.197) and Cd (-0.187 to 1.342)exhibited values higher than 0 and,consequently,are slightly harmful;3.3% of the samples have a Cd higher than 1,and they are classed as moderately hazardous samples.
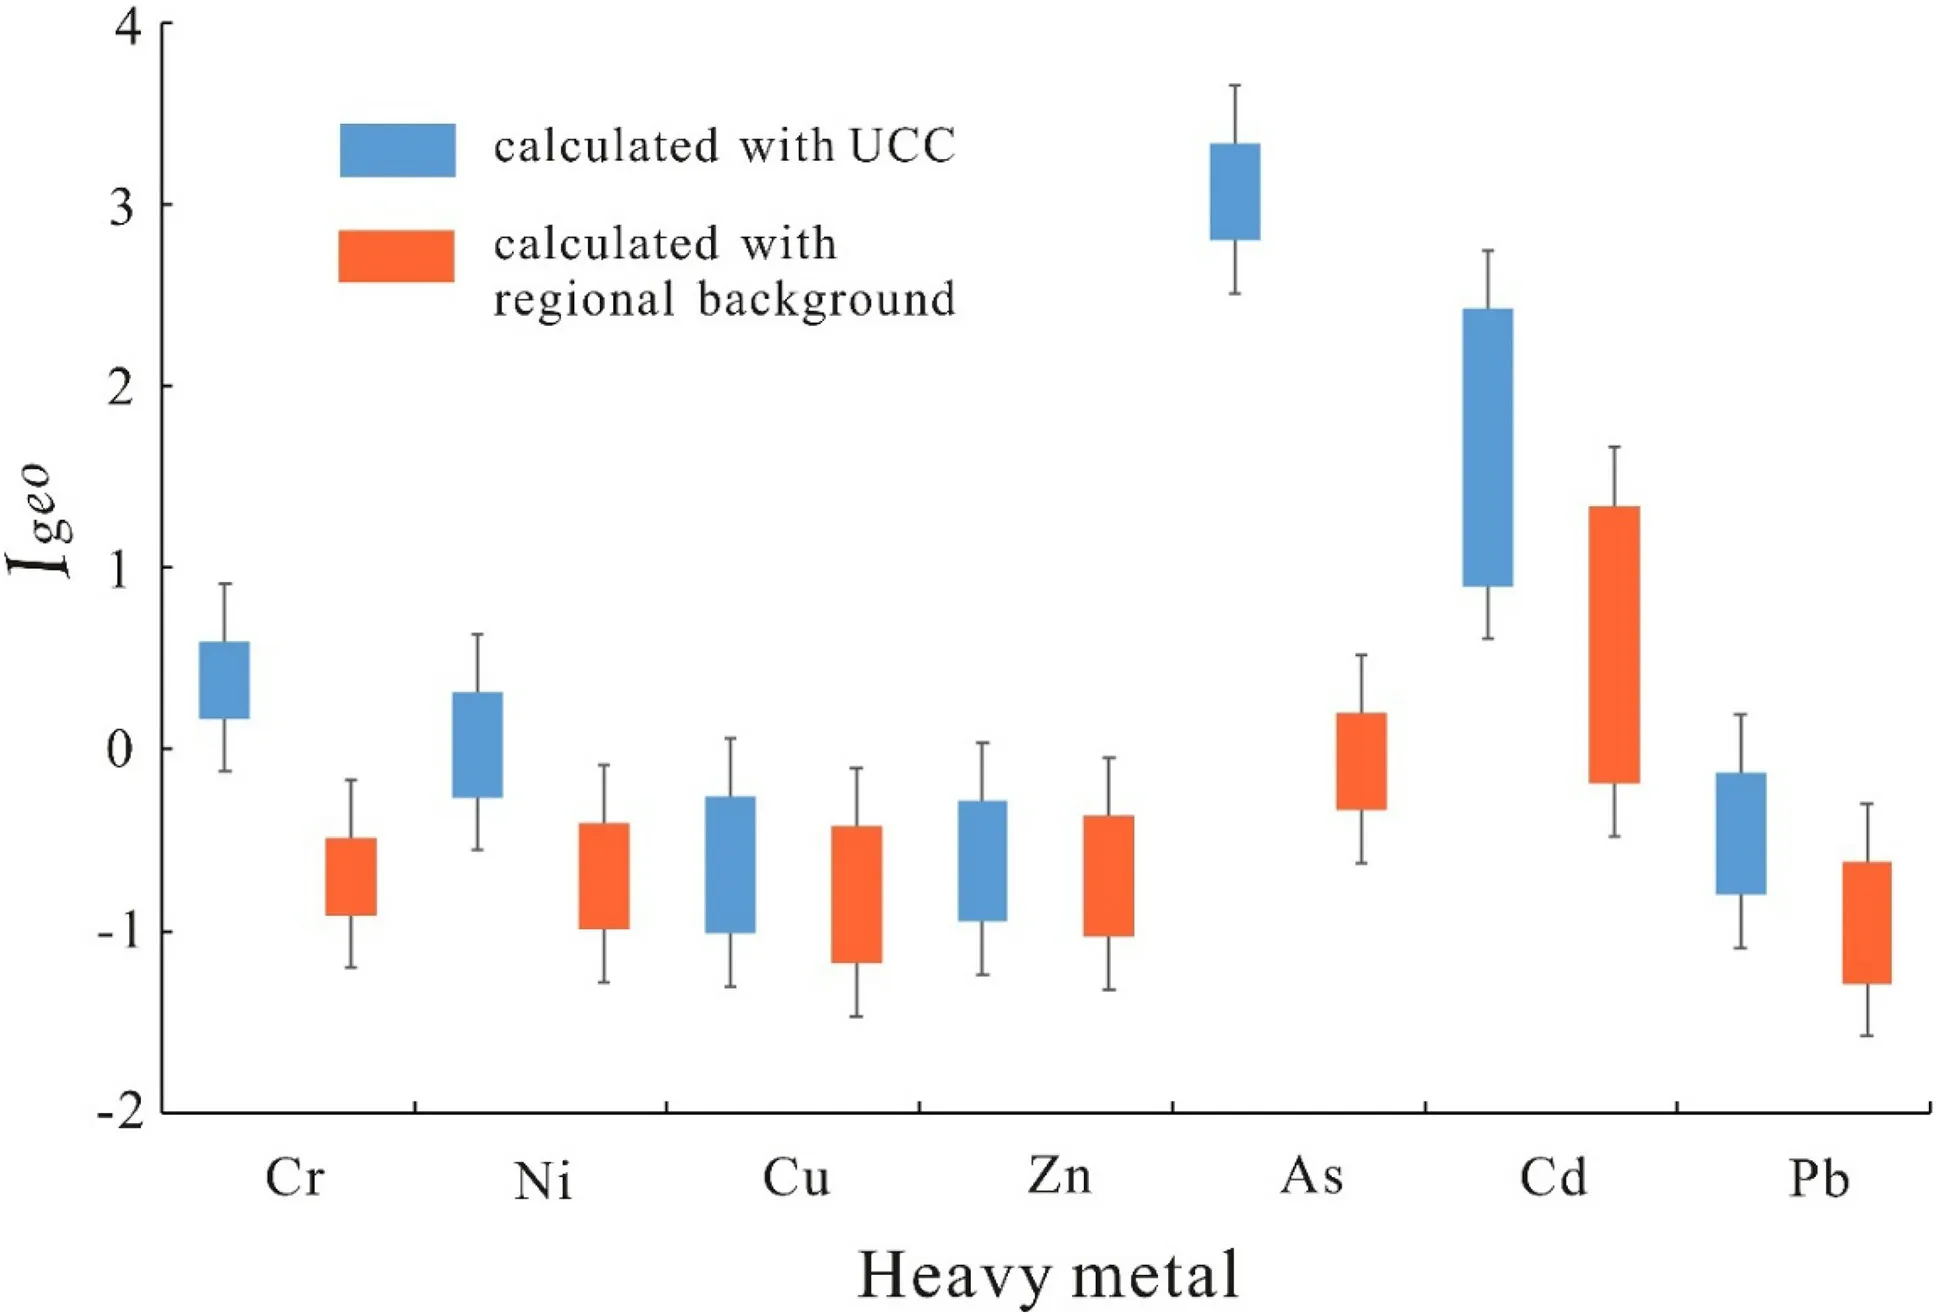
Fig.3 Geo-accumulation indices of the heavy metals in the study area
The potential risk of heavy metals is related to their toxicity,and the potential ecological risk index of each element is calculated according to the toxicity response coefficient compiled by Hakanson,which are Zn=1,Cr=2,Cu=Pb=Ni=5,As=10,and Cd=30 (Decided by its damage to human health,such as most As compounds such as As2O3are lethal,Pb can harm children’s intelligence and Cd can seriously damage the kidneys and cause osteomalacia,Hakanson 1980).According to the calculation results in Fig.4,taking UCC as the standard,the potential risk index of elements other than As and Cd is extremely low,and it is within a safe range(risk index <40);in contrast,As and Cd have strong risks(80 ≤risk index <160),and the risk index is between 110 and 143.In addition,except for Cd,the other elements in sediments stay within a safe range,and Cd is at medium risk(40 ≤risk index <80)when the background value of Shaanxi soil is taken.The comprehensive potential ecological risk index (RI) shows that all five sampling points are within the low-risk level (RI <150) when compared with the regional soil background value,and they are within the medium risk level (150 ≤RI <300) when compared with the UCC value.
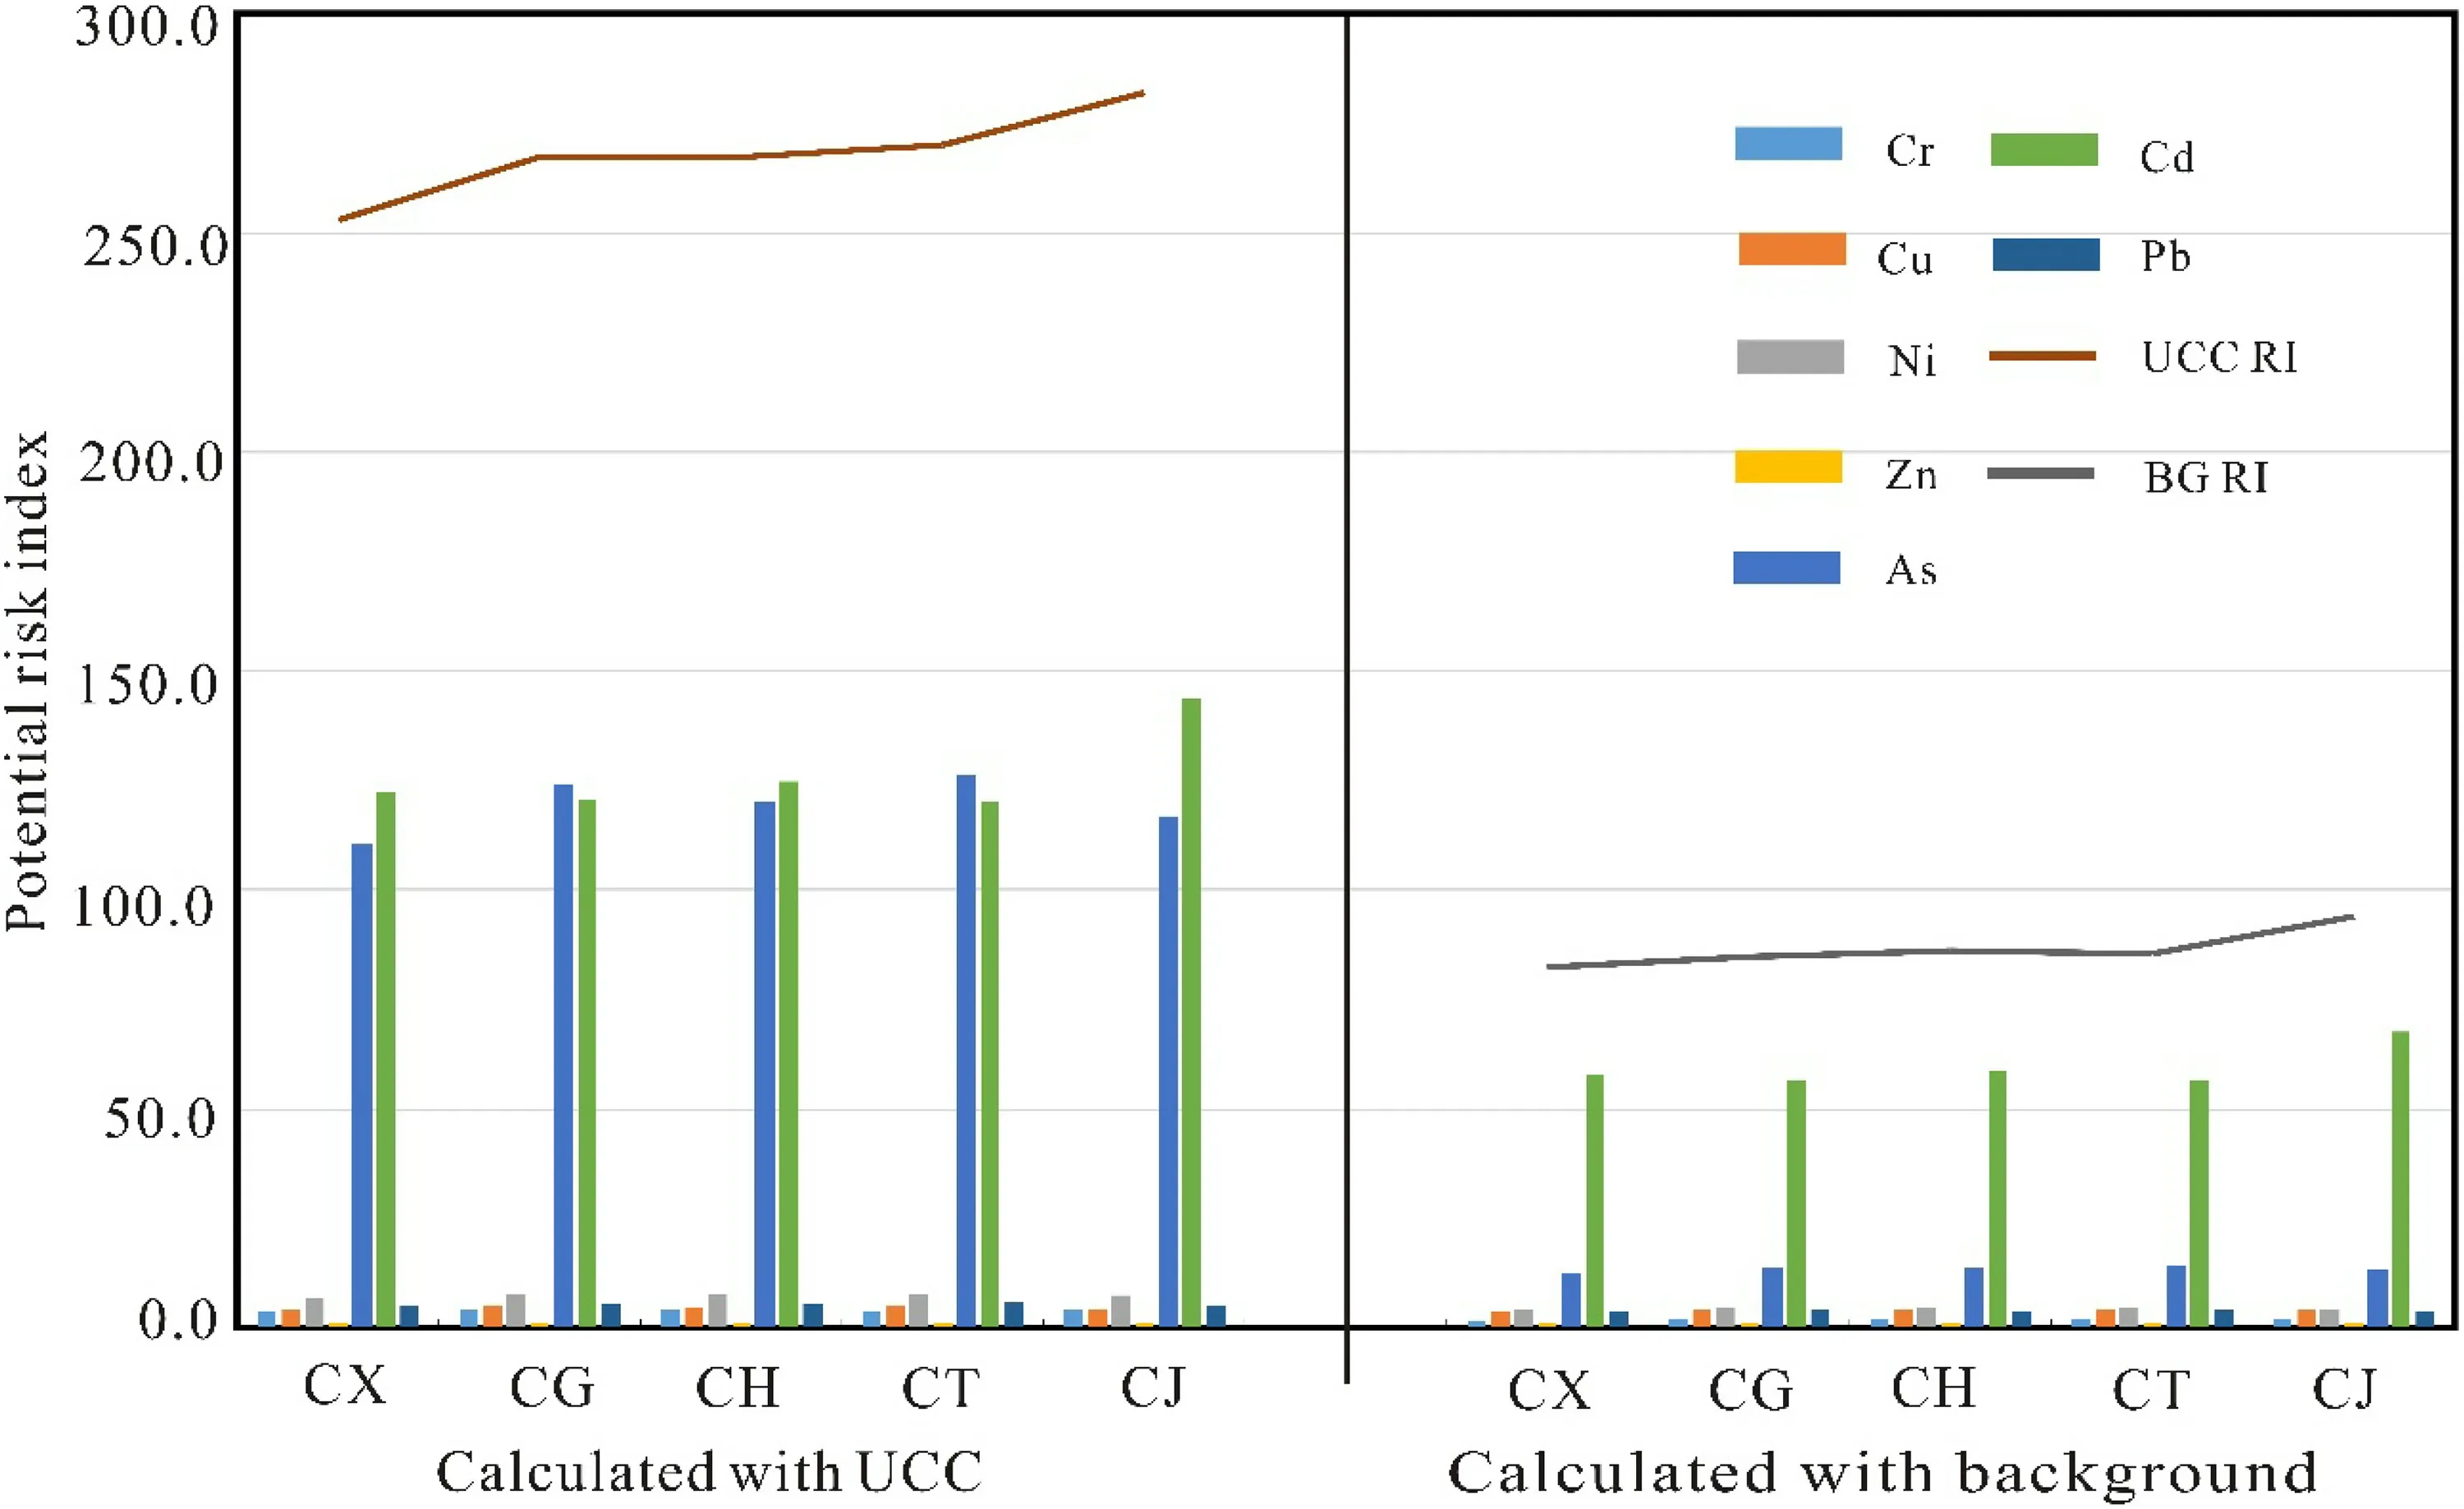
Fig.4 Potential ecological risk indices of the heavy metals as determined in samples from the study area [the histogram is for a single element risk index;the line chart is a regional comprehensive index (RI)]
In general,the pollution levels of Cd and As are medium in this area.All elements show higher risks when compared with the UCC value;however,due to the high background value of soil in the study region,it does not show harmful effects higher than the warning line (RI >300).
4.2.2 Heavy metal fraction difference
Different fractions of heavy metal elements can be absorbed and utilized by plants at differing degrees(Wang et al.2013);the mild acido-soluble fraction has high mobility,the reducible fraction and oxidisable fraction are vulnerable to environmental changes (Zhou et al.2008),and the residual fraction largely uninvolved in chemical processes due to its tight binding to the rock and generally does not cause harm.
The test results of heavy metal fractions are shown in Fig.5.Four elements (Cu,Ni,Zn,and Cr) are mainly in the residual fraction,with contents of more than 80%.However,the residual fraction of Cd is only 14%,exhibiting 86%of the active Cd(B1+B2+B3),which is the highest among all six elements;here,the mild acidosoluble fraction is 72.7%.Therefore,compared to other elements,Cd is more easily absorbed by plants.
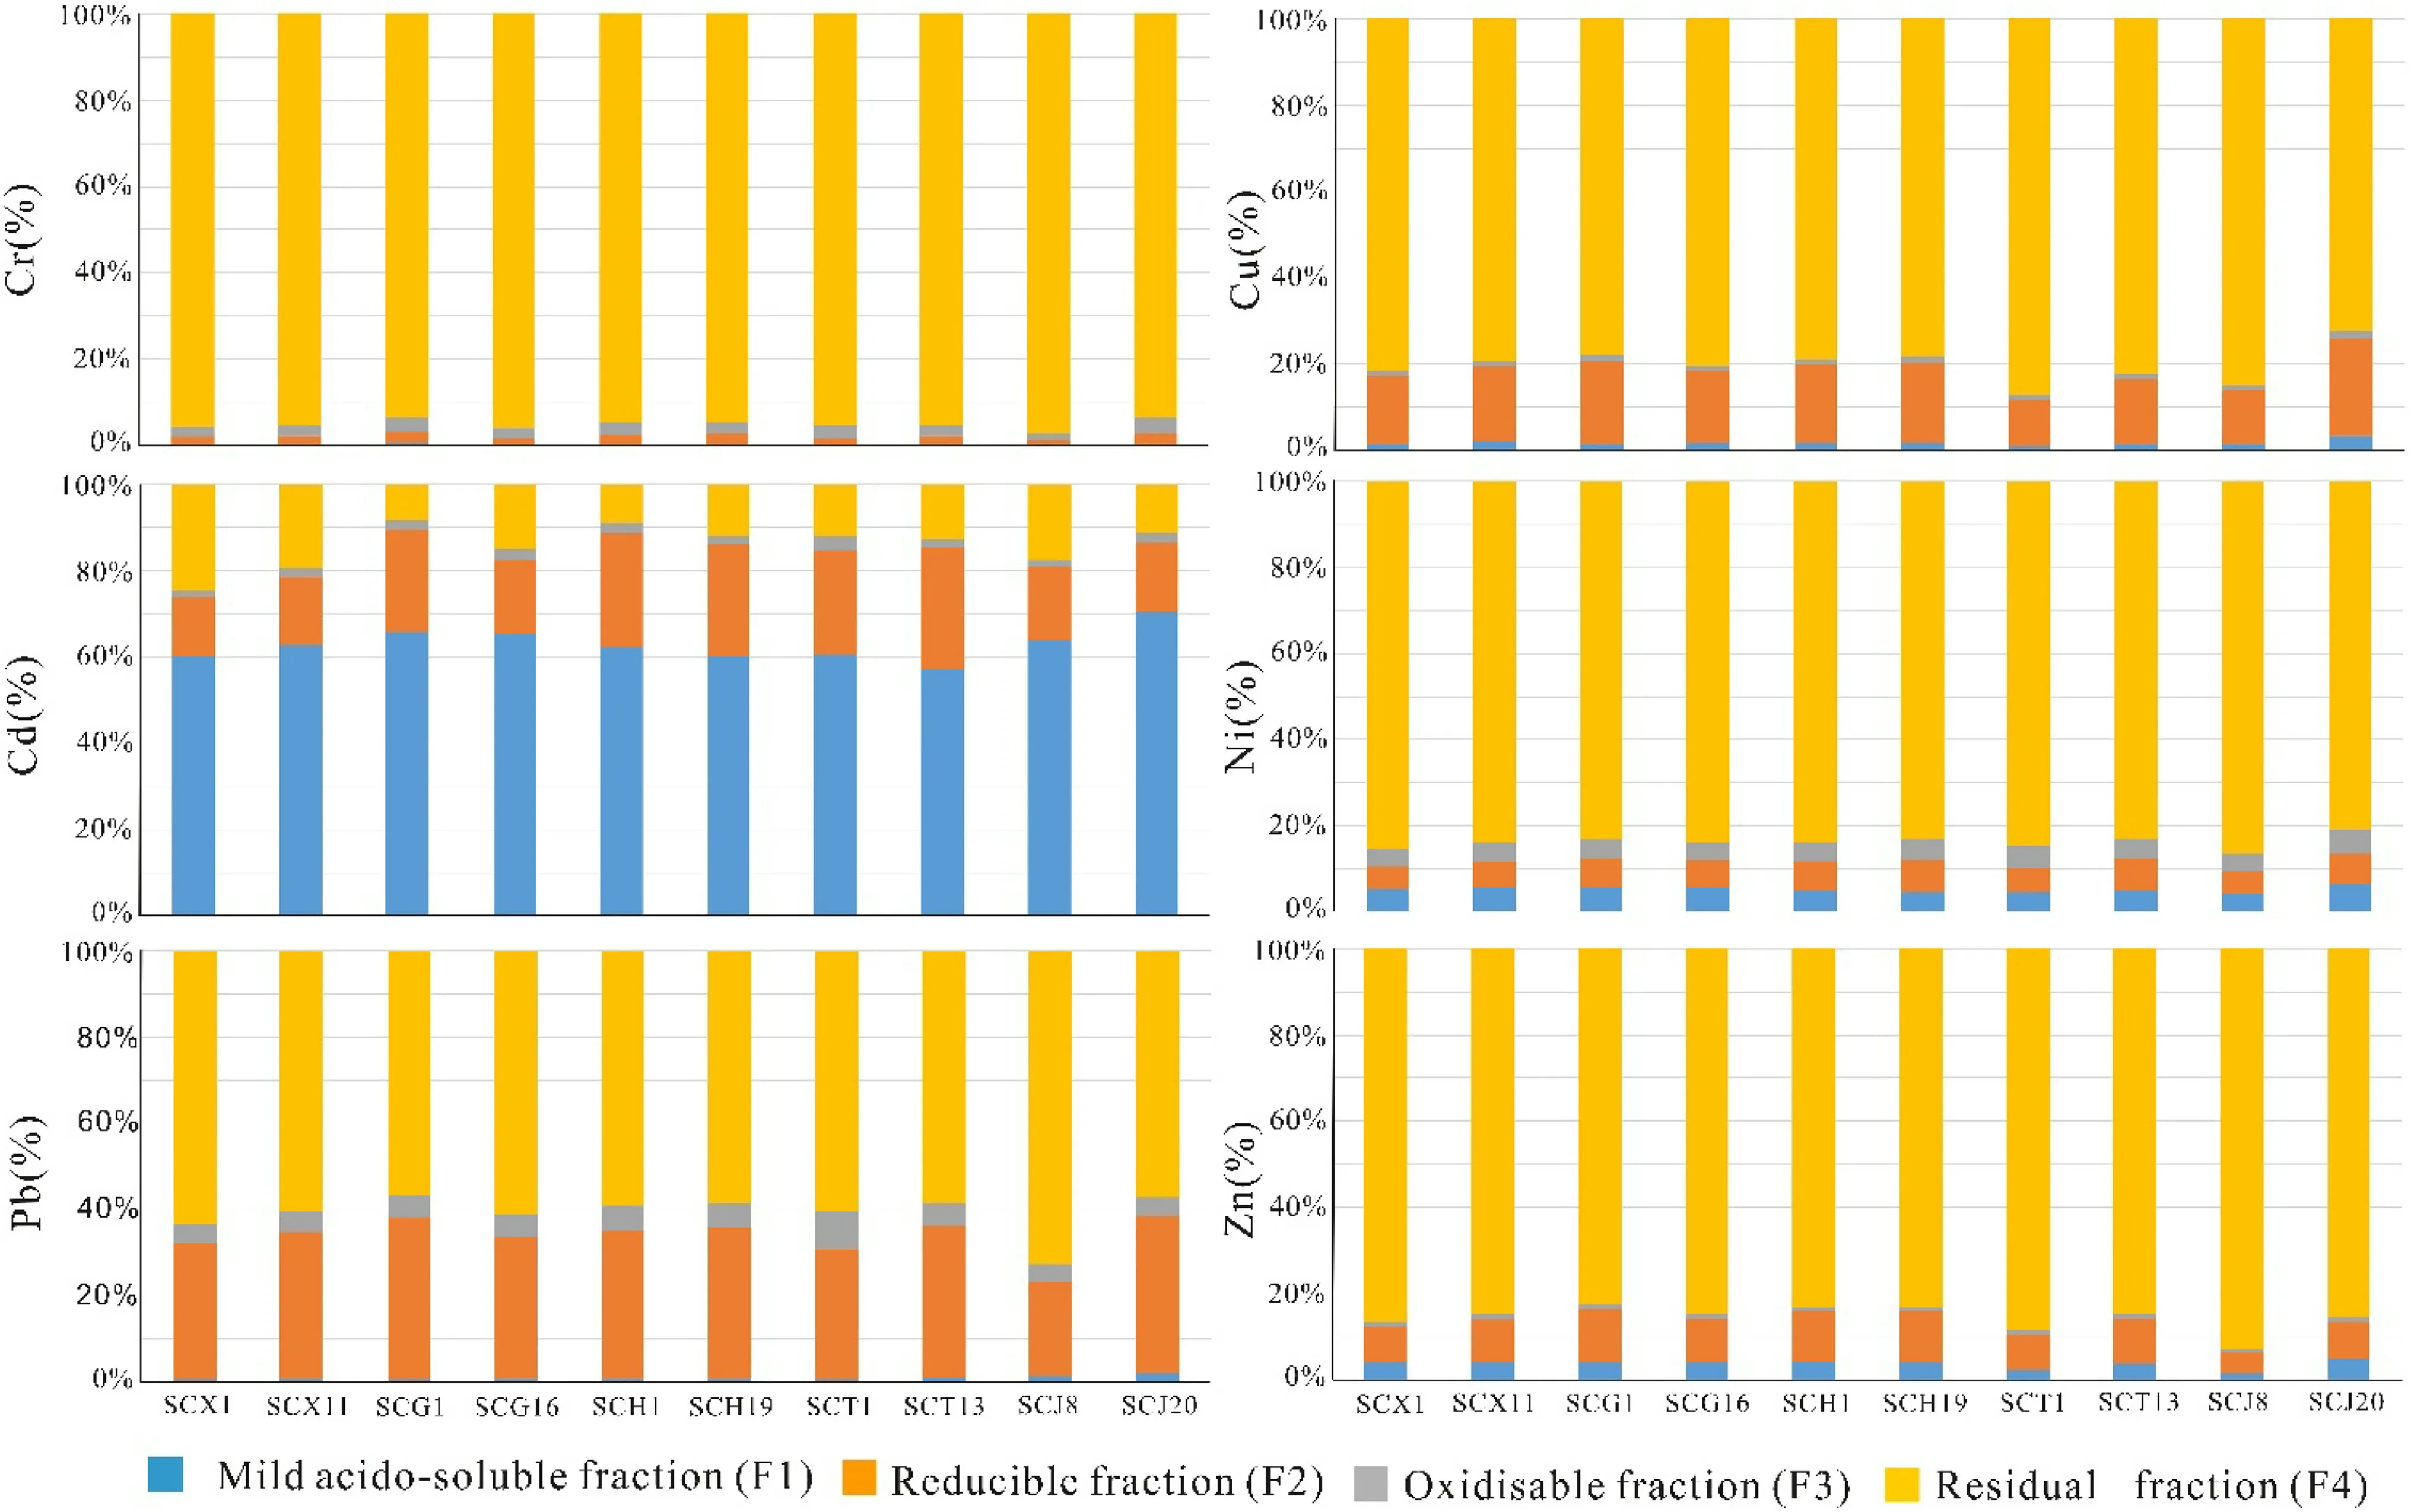
Fig.5 Percentage of four chemical fractions of the determined heavy metals in sediments based on the BCR method
The residual fraction of Cr is more than 95%,which inflicts minimal impact on the environment.The average residual fractions of Zn,Ni,and Cu are 86%,84%,and 80%,respectively,having little impact on the environment.The reducible fraction of Cu(17%)is much higher than the reducible fractions of the others,and its impact on the environment tends to expand when the environment changes.The reducible fraction of Pb is 33% of the total,making it the greatest fraction except for the residual fraction.This form is greatly affected by environmental factors such as water content or temperature;thus,Pb has certain potential risks.
The ratios of the secondary phase and primary phase method (RSP;Xiang et al.2020) is an assessment method that can be used to judge an element’s risk based on the fractions of heavy metals.The results are presented in Table 2,which shows that Cd has an average RSP value of 6.85,much higher than that of the values of other elements,making it the most dangerous element in the study area.Cd exhibited RSP values higher than 10 in some sampling points,indicating the heavy pollution (RSP>10).Cd is the most important element with high bioavailability and migration ability;therefore,Cd presents the highest potential ecological risk in the surface sediment of this area.The potential risks for other elements are extremely low,and the RSP values are lower than 1.0,basically indicating little to no ecological risk.
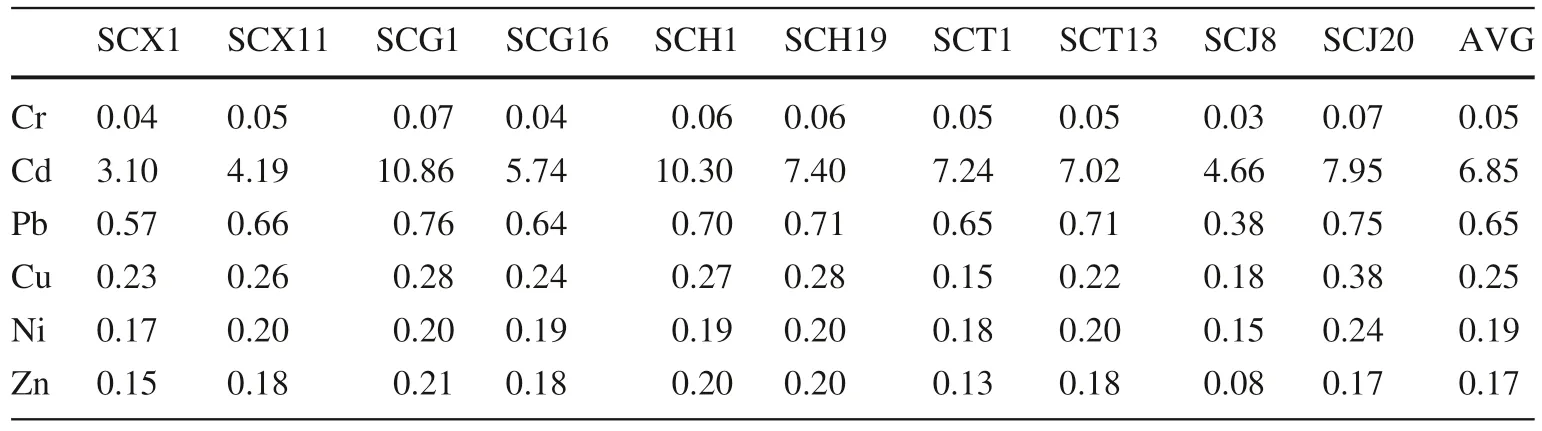
Table 2 Ratios of secondary phase and primary phase method (RSP) results for heavy metals in the investigated sediments
4.3 Traceability study of heavy metals
Principal component analysis (PCA) is often used to analyze the source of heavy metal elements in sediments (Li et al.2021;Huang et al.2022).The source of heavy metals in the sediments of the study area was analyzed using this method,and analysis results are presented in Table 3.The results show that the elements are mainly controlled by two principal components,comprising 96.4% of the pollution information;these two principal components can reflect most of the information.According to the PCA analysis,the main sources of heavy metals can be divided into two categories.Factor 1’s feature is that all elements have a certain load,but a load of Cd is relatively low,which is significantly different from the other elements;factor 2 comprises an all-negative load,except Cr and Cd,and Cd is the main component.

Table 3 Principal component analysis (PCA) results for heavy metals in these sediments
The two principal components extracted from the PCA can be found in the factor load diagram (Fig.6).Factor 1 has the largest contribution to the total variance (76.2%),and it is the most important factor controlling the distribution and source of heavy metals in the sediment.From the intercept of heavy metals and the coordinate axis in Fig.6,factor 1 is mainly composed of Zn,As,Ni,Cu,and Pb.It can be inferred that the pollution sources of these five heavy metals may be the same.Factor 2 can explain 20.2%of the total variance,and it is the secondary heavy metal distribution control factor.This is mainly composed of Cr and Cd,indicating that these two heavy metals may be homologous,but the intercept of the two elements differs greatly,indicating that Cr may relate to two-factor mixing.

Fig.6 Loading diagram of the principal component of heavy metals in the sediment
Hierarchical cluster analysis (HCA) is used to further analyze the sources of these elements,and it can decompose the data hierarchically and group elements with similar sources or aggregations into groups.The test results(Fig.7) show that the elements in the region are divided into three categories.The difference with PCA is that there is a certain relationship between Cr and Zn.The relationship shows that the enrichment of Cr in this area is similar to Zn and is affected by similar factors.

Fig.7 Loading diagram of the hierarchical cluster of heavy metals in the sediment
5 Discussion
5.1 Spatial distribution
According to the distribution of the heavy metal elements in the area (Table 1 and Fig.2),the concentrations of heavy metal elements near Xiangqiao Town are relatively low,and the heavy metals are mainly concentrated at the confluence of the rivers.As,Pb,Cu,and Zn are enriched at the Qinghe confluence,and Cr,Ni,and Cd are enriched at the Shichuanhe confluence.The concentrations of heavy metal elements are relatively uniform between the two confluences.
The content of heavy metals in sediments is mainly affected by natural factors,such as parent materials at a low level,and it is mainly affected by human activities when the content is high (Jackson 1988).Compared with the background content in rocks,the contents of As,Cd,and Cr in this area are several times more than the UCC,showing characteristics of human impacts.The high background value in Shaanxi(Hou 2020)indicates that the sediment in the Shaanxi area has been polluted by human beings to a certain extent.
There was a large amount of domestic garbage accumulation at the confluence of the Qinghe River due to the impoundment of the Erlongkou Reservoir here.The reservoir also caused the amount of water at the junction with the Shichuanhe River to be small,and the flow was slow,which meant that the heavy metal elements gathered in the area could not be dissolved and removed,resulting in relatively high concentrations of heavy metal elements in the area.Jiaokou Town,with a population of 20,000,is located at the Shichuanhe River confluence.The domestic sewage in this town is directly discharged to the Shichuanhe River confluence.In the dry season of the Shichuanhe River,sewage flows through the beach sediments,leaving a large amount of heavy metal elements in the sediments.There are scattered villages between the two confluences,and there are relatively few pollution sources;the concentration of heavy metals in this area is closer to the background value of Shaanxi.
Compared with the heavy metal test results of the main trunk of the Weihe River (Yang et al.2018),it was found that the concentrations of As (17.93 mg∙kg-1) and Cd(0.41 mg∙kg-1)in this area are higher than the mainstream of the Weihe River (As=11.38 mg∙kg-1and Cd=0.331 mg∙kg-1),while the other elements are lower,indicating that there are certain differences between As and Cd elements in this area and the mainstream.Compared with Caohai as a natural reserve (Zhang et al.2013),Zn,Cd,and Pb concentrations in this area are very low,while Cr,Ni,Cu,and As concentrations are slightly higher,indicating that the heavy metal elements in the lower reaches of the Shichuanhe River have not been significantly enriched.
5.2 Pollution level
The pollution of heavy metal in this area is generally low,and the element content in most areas does not exceed background values.However,because the background value in this area is many times more than the UCC,there are some seriously polluted areas at the lower Shichuanhe River,Shaanxi.By comparing several evaluation methods,it was observed that these methods all show that Cd has a certain degree of risk,while the geo-accumulation index and potential ecological risk index also point out that As exhibits high risks.The content of Cd does not exceed the TEL line of SQG,relating to differences in their evaluation criteria.Among them,the SQG standard is based on the benthic toxicity test(Long et al.2006),which does not take into account the nature of the sediments nor the changes in the environmental background.In contrast,the geo-accumulation index focuses on the enrichment ability of heavy metals in the sediment(Müller 1969).Both do not take into account the toxicity of heavy metal accessory substances,such as methylmercury.Moreover,the potential ecological risk index distinguishes the toxicity of each element (Guo et al.2011).From the results,it can be observed that As and Pb pose high potential risks due to their high toxicity response coefficients (As=10;Pb=5;most As compounds such as As2O3are lethal,and Pb can harm children’s intelligence) compared to Zn (1) and Cr (2).Moreover,higher concentration values(As=17.93 mg∙kg-1and Pb=21.23 mg∙kg-1) were observed compared to Cd (0.41 mg∙kg-1).The RSP principle focuses on the impact of the fractions of elements on their activities (Xiang et al.2020).Different fractions have different risks.Therefore,Cr with a high total content is identified as having limited risk due to its extremely high residual fraction content,while Cd is regarded as the element exhibiting the most amount of risk in the region due to its extremely high activity.
According to these evaluation methods,Cd needs the most attention in this region due to its high toxicity (toxicity response coefficient=30;it can seriously damage the kidneys and cause osteomalacia),and it is highly active(mild acido-soluble fraction above 63%);as such,Cd is most likely to cause ecological hazards.As is considered to be the next most hazardous element in the region due to its high biological toxicity.
5.3 Source analysis
According to the spatial distribution of heavy metal elements,the heavy metal elements in this area mainly exist in two confluences;Xiangqiao town and the area between the two confluences are not rich in heavy metals.Due to the scattered population living between the two confluences,the pollution in these areas is mainly a non-point source,and it has not caused a significant impact on the river’s sediment.Xiangqiao Town and its upstream area,as the first area to implement environmental treatments,increased its sewage treatment capacity from 4000 to 15000 m3/d at 2020,and 49.3 km of river banks have been rehabilitated by means of sludge excavation and planting protective forests(Cao 2018);the content of the heavy metal elements in these areas is below the background value of Shaanxi.Because environmental control projects at the two confluences are still under construction,pollution still exists right there.
The PCA results divide the elements into two sources,while the HCA divides the elements into three sources.Among them,Cd is considered to have a separate source,while Zn,As,Ni,Cu,and Pb are relatively consistent.The source of Cr is complex,which is consistent with Zn,but the relationship with As,Ni,Cu,and Pb is relatively shallow;this relationship shown in a diagram(Fig.6)with the Cr is observed between two factors.
The contents of Zn,As,Ni,Cu,and Pb elements are close to the background value of Shaanxi,and only As exhibited a higher average value than the background value.The heavy metal fraction analysis results also show that the residual fraction is more than 60%,indicating that they are not affected by human activities but are only affected by the accumulation quality of sediments.Studies show that under the condition of unchanged water environments,the higher the sediment content,the stronger the ability to absorb heavy metal elements.When sediment content increases from 0.5 to 1.5 mg∙kg-1,the Pb adsorption equilibrium time decreases from 90 to 60 min,and Cd decreases from 50 to 40 min (Yan 2014),which means the sediment deposition in confluences will affect the distribution of elements (Bertin and Bourgm 1995).At present,only 3.3%of the sampling points have Cr contents that are higher than the background value.There are no other visible factors affecting Cr content except for the environment,so it can be considered that it is still restricted by the environmental background.
The content of Cd in this area is relatively high,and its source is different from other elements;moreover,its spatial distribution shows that the content of Cd in this area is consistent on the whole,indicating that the source of Cd is non-point source.In view of the fact that this area is mainly an agricultural area,industrial pollution is very small,and atmospheric sedimentation and other factors exhibit no difference in this location and around the Weihe River.However,compared with the Weihe River basin,which has more developed industries(Cd=0.331 mg∙kg-1) (Yang et al.2018),the content of Cd in this area is higher(0.41 mg∙kg-1),and 63%of Cd is soluble without much integration with sediments,indicating that its main source is agricultural and domestic sewage discharge.
Phosphate fertilizers used in agricultural production have a higher content of Cd that cannot be removed due to the accompanying Cd of raw phosphate ore materials(Gao and Zhang 2003;Cui and Zhang 2004;Guo et al.2018).The use of phosphate fertilizers in agricultural production will greatly increase the content of heavy metals in farmland (Taylor 1997;Liu et al.2005a,b).Research shows that the long-term application of calcium phosphate will increase the content of soil Cd by 38 times within 26 years(Liu et al.2005a,b).The studies in New Zealand show that the extractable Cd of long-term fertilized soil increased from 0.39 to 0.85 mg∙kg-1in 50 years,seriously affecting the safety of crops(Taylor 1997).This shows that the main source of Cd in agricultural production is phosphate fertilizers.Domestic sewage is also one of the important sources of Cd.The study shows that untreated domestic sewage and domestic garbage are the main factors that lead to excessive Cd in farmland (logistic regression index:OR water=1.41;OR garbage=2.55;Lu and Lin 2019).The content of Cd in the study area ranges between 1.3 and 3.8 times more than the soil background value,with an average content of 0.41 mg∙kg-1,and the main gathering area is near Jiaokou Town,which has a large population (maximum value is 0.79 mg∙kg-1).This shows that domestic sewage plays a main role in the change in Cd distributions in this area.
In general,the distribution of heavy metal elements in the region is mainly affected by the distribution of rivers and human activities.There are two main sources of heavy metal elements:Zn,As,Ni,Cu,and Pb may come from the environmental background.Cr has some other factors not yet been shown.Cd is mainly related to the local sewage discharge.
6 Conclusion
1.The value of heavy metals in this region hovers around the soil background of Shaanxi Province.The main element enrichment area is located at the confluence of the Qinghe and Shichuanhe rivers.There is no significant concentration of heavy metal elements in this area,and this may be because human activities have not completely changed the overall natural distribution pattern of heavy metal elements.
2.The geo-accumulation index,potential ecological risk,and RSP methods all show that the risk of the heavy metal elements is concentrated concerning Cd and As;the other elements have not caused ecological harm in the area.
3.The main sources of heavy metal elements in the investigated sediments are natural sources.Cd and Cr have certain human impacts;however,Cd is substantially affected by human factors,such as those mainly related to the widespread use of fertilizers and the discharge of untreated agricultural wastewater in the region.
4.Given the vigorous promotion of domestic wastewater treatments and environmental remediation,the element distribution of river sediments in this area will change substantially in five years;moreover,Cd exhibiting high potential risks and resulting mainly from human activities needs to be further monitored.
AcknowledgementsWe thank the favorable suggestions of Pro.Ian M.Coulson from the University of Regina,Canada.The research work has been financially supported by the Key Project of Shaanxi Provincial Natural Science Basic Research Program (2023-JC-ZD-16).We are also thankful to the editor and anonymous reviewers for their constructive comments on this article.
Author ContributionsHC: Formal analysis,visualization,and writing—original draft.FC: Conceptualization,supervision,and writing—review and editing.SL: Investigation and resources.All authors have read and agreed to the published version of the manuscript.
Declarations
Conflict of interestAll authors have no conflicts to declare.On behalf of all authors,the corresponding author states that there is no conflict of interest.
- Acta Geochimica的其它文章
- The cooling models of Earth’s early mantle
- Petrology of lherzolite xenoliths of Hosséré Sédé volcano(Adamawa plateau,Ngaoundéré area,Cameroon)
- Decoding the nature of interaction between felsic clasts and mafic magma in a subvolcanic magma chamber from amphibole–titanite transformation and chemistry
- Isotopic analysis based on terahertz spectrum
- In situ infiltration-precipitation processes in some rock systems
- Magma source and tectonic setting of the Dunde granite in the Western Tianshan: constraints from geochronology,geochemistry,and Sr–Nd–Hf isotopes