
Isotopic analysis based on terahertz spectrum
2023-10-13 01:16QijunChenYunLiu
Acta Geochimica 2023年5期
Qijun Chen • Yun Liu,2
Abstract As a new promising detection technology in the terahertz research field,the terahertz time-domain spectroscopy (THz-TDS) has very broad application potential in many fields because its advantage on the characteristic spectrum,wide spectrum and non-destructive analysis of interested substances.In this paper,the terahertz absorption spectra of gases mixed with 12CO and 13CO in the spectrum range of 0.5–2.5 THz are measured by terahertz timedomain spectroscopy for the first time.Several isotopologues can be clearly distinguished based on the difference in their rotational energies and the consequent terahertz spectrum.The experimental results show that 12CO and 13CO have obvious characteristic absorption peaks in the spectrum range of 0.5–2.5 THz due to the difference in rotational energy,and the rotational constant B can be calculated according to the experimental values to distinguish the two gaseous isotopologues.The frequency positions of the characteristic absorption peak measured by this experiment and the rotation constant B calculated according to the experimental values are compared with those previous theoretical calculations and experimental results,and they are in good agreement.This result lays a foundation for developing more sophisticated terahertz instruments to the detection of different isotopologues.
Keywords Isotope analysis ∙CO isotopologue ∙Terahertz time-domain spectroscopy (THz-TDS) ∙Rotational spectrum
1 Introduction
Terahertz radiation has a very special position in the electromagnetic spectrum.This region is electromagnetic radiation with a frequency between the microwave and infrared bands.Therefore,terahertz radiation is invisible to human eyes and previously unknown to researchers,which is called the‘‘terahertz gap’’(Liu and Zhong 2009).Studies about the terahertz band began in the 1960s with the discovery of far-infrared waves excited by water (Crocker et al.1964;Gebbie et al.1964).In the late 1980s,with the rapid development of ultrafast technology,the acquisition of wirelessly stable pulsed terahertz sources became relatively easy to achieve,and the related research on the generation of terahertz also made great progress compared to the past,thus terahertz technology also underwent rapid development (Auston et al.1984).Generally,the THz wave studied refers to the electromagnetic wave segment with a frequency of 0.1–10 THz,that is,the wavelength is 30–3000 μm,and the wavenumber is 3.3–330 cm-1(Siegel 2003;Zhang and Mu 2010).An electromagnetic wave with a frequency of 1 THz has a period of 1 ps,a wavelength of 300 μm and a photon energy of 4.1 meV.Because of its particularity in the electromagnetic wave segment,the terahertz wave is not only the transition region of macroscopic classical theory and microscopic quantum theory but also the transition region of electronics and photonics.Therefore,terahertz waves have their own unique advantages compared with other electromagnetic waves,listed as follows:(1)Transient properties.The pulse width of the terahertz wave is at the ps level,which can facilitate the study of the temporal resolution of various materials.At present,the signal-to-noise ratio of radiation intensity measurement can be greater than 104,which is much higher than that of Fourier transform infrared spectroscopy (Kampfrath et al.2013;Jnawali et al.2013).(2)Low energy.Terahertz waves have very low photon energy,approximately 4.14 millielectron volts per photon of 1 THz,which can be used for nondestructive testing and security checks (Dean et al.2013).(3) Coherence.The coherence of terahertz waves stems from the mechanism by which they are produced.Terahertz waves are produced by dipole oscillations driven by coherent currents,or by coherent laser pulses through nonlinear optical differencefrequency effects(Zhang and Jin 1993).The amplitude and phase of the electric field can be directly measured by the coherence of the terahertz wave,which is convenient for qualitative analysis and quantitative identification of substances (Davies et al.2008;Burnett et al.2009).(4)Wideband properties.Because terahertz pulses have such a wide range,the terahertz band contains much information about matter,such as the translational,rotational,and vibrational movements of a large number of organic molecules (Harde et al.1991),lattice vibration of solids(Schall et al.2001),and the in-band transitions of semiconductors,which are located in the terahertz band (Cole et al.2001).
In astrophysics,NASA studies of cosmic background radiation show that submillimeter radiation accounts for a significant proportion of observable galaxies,mostly from cold cosmic dust,which is abundant in older galaxies(Siegel 2003).Stars are thought to be made of gas and dust in a disk of gas and dust that surrounds them,and dust is what makes visible and near-infrared light opaque in gas clouds.Caltech observed radiation patterns typically emitted by the condensation of nebulae in galaxies to form planets (Phillips and Keene 1992).These spectral lines include dust,molecular rotational transitions,and emission lines due to the fine structure of atoms.The terahertz band contains a great deal of information about interstellar molecules that can help us study the formation and evolution of planetary atmospheres,stars,and galaxies.A considerable number of submillimeter terahertz telescopes have been installed on the ground and in space(Gulkis and Alexander 2008;Schwan et al.2011;Bergner et al.2021;Csengeri et al.2022),but they provide only a very incomplete picture of the spectrum,and to understand it,auxiliary experiments are needed in the laboratory.Large molecules such as CH compounds may be abundant in interstellar space,and many of the observed spectral features are thought to be produced by them,but spectral information about these molecules or molecular clusters is not available (Zhao 2006).Most of the stars in the known universe are gaseous,and these terahertz properties could be used to enhance the perception of unknown stars by deep-space detectors.
Not all substances produce characteristic absorption peaks at the terahertz band.The conditions for the absorption peak of terahertz radiation are as follows:First,the energy of the photon absorbed by the molecule is equal to the energy required for the rotational transition of the molecule.Second,the dipole moment of the molecule needs to change.As with nuclear diatomic molecules,such as H2and N2,which do not produce characteristic absorption peaks in the terahertz band,the dipole moment is 0.Polyatomic molecules that remain nonpolar during rotation also have a dipole moment of 0 and do not produce absorption peaks in the terahertz band,such as CH4and CO2.The dipole moment of polar molecules changes,and its rotation spectrum is located in the terahertz band,so polar molecules have characteristic absorption peaks in the terahertz band,such as CO,NO and NH3.
Terahertz spectroscopy is currently used in gas studies.Martin et al.(1989)first measured the absorption spectrum of water vapor in the terahertz band using pulsed THz radiation.Harde et al.(1994) and Mittleman et al.(1998)tested the terahertz absorption spectra of CH3Cl,H2O and other gaseous molecules and studied their thermodynamic properties.Jacobsen et al.(1996) made the first chemical identification of a mixture of NH3and H2O.Hu et al.(2006) measured the absorption spectrum of CO in the range of 0.2–2 THz.Drouin et al.(2011) measured the characteristic absorption peaks of ammonia and water vapor using THz technology.Kim et al.(2020)studied the terahertz absorption spectrum of N2O in the range of 0.2–1.2 THz.The above experimental results all show that different gases have different characteristic absorption peaks in the terahertz band,but the application of terahertz techniques in the field of isotopes is rare.
In geology,mass spectrometers are used to separate and detect different isotopes.For example,the Gas Isotope Mass Spectrometer separates ions according to the mass charge ratio (m/z) to obtain the mass spectrum,which is essentially differentiated according to the mass of different isotopes (Nier 1947).Based on the measurement of different isotopes by terahertz spectroscopy,the primary advantage of THz-TDS is the nondestructive detection of terahertz waves without the need for ionized molecules.In essence,isotopic mass spectrometers use molecular mass differences to distinguish isotopic bodies,while terahertz spectrometers use molecular rotational energy differences to distinguish isotopic bodies.
2 Theoretical basis
2.1 Theoretical derivation of the rotational spectra of gas molecules
When terahertz waves interact with gas molecules,only when the photon energy of the beam is equal to the energy range between the two adjacent energy levels of the gas molecule will the molecule absorb the photon energy of the terahertz wave to change its rotation or vibration state and generate the absorption spectrum.The energy required for the pure rotational transition of gas molecules is lower than that required for the vibrational transition,so the vibrational transition of molecules is accompanied by the rotational transition.The rotational spectrum is the spectrum produced by transitions between the same electronic state of a molecule and two different rotational energy levels of the same vibrational energy level.
Since the photon energy of the terahertz band is very low,the spectrum of this band is a pure rotation spectrum.The energy of the rotation spectrum is quantized,so:
wherehis Planck’s constant,Iis the moment of inertia,andJis the rotational quantum number with a nonnegative integer.When the energy absorbed by a molecule transitions from a lower energy level to a higher energy level,the molecule transitions from an energy level with a quantum numberJto an energy level with a quantum numberJ+1,thus producing a pure rotational absorption spectrum.Then,the energy difference between two adjacent energy levels can be expressed in the following equation:
According to the Bohr frequency condition,the rotational transition frequency of the energy absorbed by the molecule is
This formula is often written asv=2B(J+1),whereBis the rotational constant,so the molecular rotational transition frequency interval Δv=2B,Therefore,once you know the moment of inertiaI,you can determine the molecular rotational transition frequencyvand the transition frequency interval Δv.
When a pure rotational transition occurs in the energy absorbed by a molecule,the change in the rotational quantum number causes the energy interval between adjacent energy levels to gradually increase.Since Δv=2B,the spectral lines generated by the energy absorbed by a molecule are arranged at equal intervals,with a spacing of 2B.Therefore,to measure the pure rotational transition spectral line of CO,a series of spectral lines with equal spacing can be obtained.
Different isotopes have different rotational energies and therefore different positions of absorption peaks in the rotational spectrum.The moment of inertia is given by the following equation:
The nuclear spacing of a diatomic molecule isRe,andRe=R1+R2.μ is the reduced molecular mass,
Therefore,when the mass of one atom becomes larger,its reduced mass μ will increase,the moment of inertiaIincreases,and the rotation constantBdecreases,so the different rotation constants can be distinguished from different isotopes,which can be obtained through the spectrum analysis of the frequency and rotation quantum number relationship,solving the rotation constantsB1andB2,and then distinguishing12CO and13CO(Klapper et al.2003;Table 1).

Table 1 Rotational transition frequency interval of 12CO and 13CO gases
2.2 Theoretical calculation of rotational spectra of 12CO and 13CO
According to the above theory,combined with the related data of the CO molecular structure,the pure rotational transition spectrum and rotational transition frequency interval of CO gas under the assumption of rigid rotation can be calculated.The carbon–oxygen bond length of the12CO molecule is 112.8 pm,the atomic mass of the12C atom is mc=1.993 × 10⁻²⁶kg,and the atomic mass of the O atom is mo=2.657 × 10⁻²⁶kg.The molecular rotational transition frequency interval Δv=0.116 (THz) of12CO can be obtained by Eqs.(3),(4) and (5).Similarly,the rotational transition frequency interval of13CO molecules can be solved.The molecular bond length is related to the atomic radius but not to the isotope,so the13CO molecule carbon–oxygen bond length is still 112.8 pm,the13C atom atomic mass is mc=2.159 × 10⁻²⁶kg,and the O atom atomic mass is mo=2.657 × 10⁻²⁶kg.The molecular rotational transition frequency interval Δv=0.110 THz of13CO can be obtained by Eqs.(3),(4) and (5).
The premise of the derivation of the above theory is to assume that the gas molecules are rigid rotors.However,the actual situation of molecular rotation is very complicated,and the above theory is an ideal assumption for the convenience of processing.In fact,it is necessary to conduct specific analyses according to the experimental data.According to the above theoretical calculation,it can be seen that the characteristic absorption peaks of12CO and13CO gas in the terahertz band are different and easy to distinguish.
2.3 THz time-domain spectroscopy
Terahertz time-domain spectroscopy is a new and effective coherent detection technique developed in the late 1980s by the American Telephone &Telegraph Bell laboratory(Auston et al.1984)and IBM T.J.Watson Research Center(Grischkowsky et al.1987).The amplitude and phase information of the terahertz pulse can be obtained simultaneously.According to different detection methods,the current THz-TDS can be divided into two categories:transmission type and reflection type,which are used for transmission detection and reflection detection,respectively.Since the object to be measured in this paper is gas,transmission detection is selected for a brief introduction.
Terahertz gas detection experiments mainly use the THz-TDS system device.The typical transmissible terahertz time-domain spectral system consists of a femtosecond laser,terahertz wave generating device,terahertz wave detecting device and time delay control system.The terahertz waves generated by the system pass through the sample under test so that the terahertz waves passing through the sample carry information about the sample.This information can be used to identify and analyze the type and content of substances.
2.4 Theoretical absorption spectroscopy
In accordance with the existing terahertz time-domain spectroscopy test system,we tested12CO and13CO mixed in different proportions.Considering that the carbon monoxide test in the system will be affected by external moisture,the theoretical absorption spectra of H2O,12CO and13CO were sorted from the HITRAN gas absorption spectrum database.Figure 1a,b show the absorption spectra of H2O,12CO and13CO in the band range of 0.5–4.5 THz in the HITRAN gas absorption spectra database,where the red line is the absorption spectrum of H2O and the blue line is the absorption spectrum curve of CO.For the convenience of comparison,the ordinate of12CO in Fig.1a is multiplied by 300 times,and the ordinate of13CO in Fig.1b is multiplied by 30,000 times.
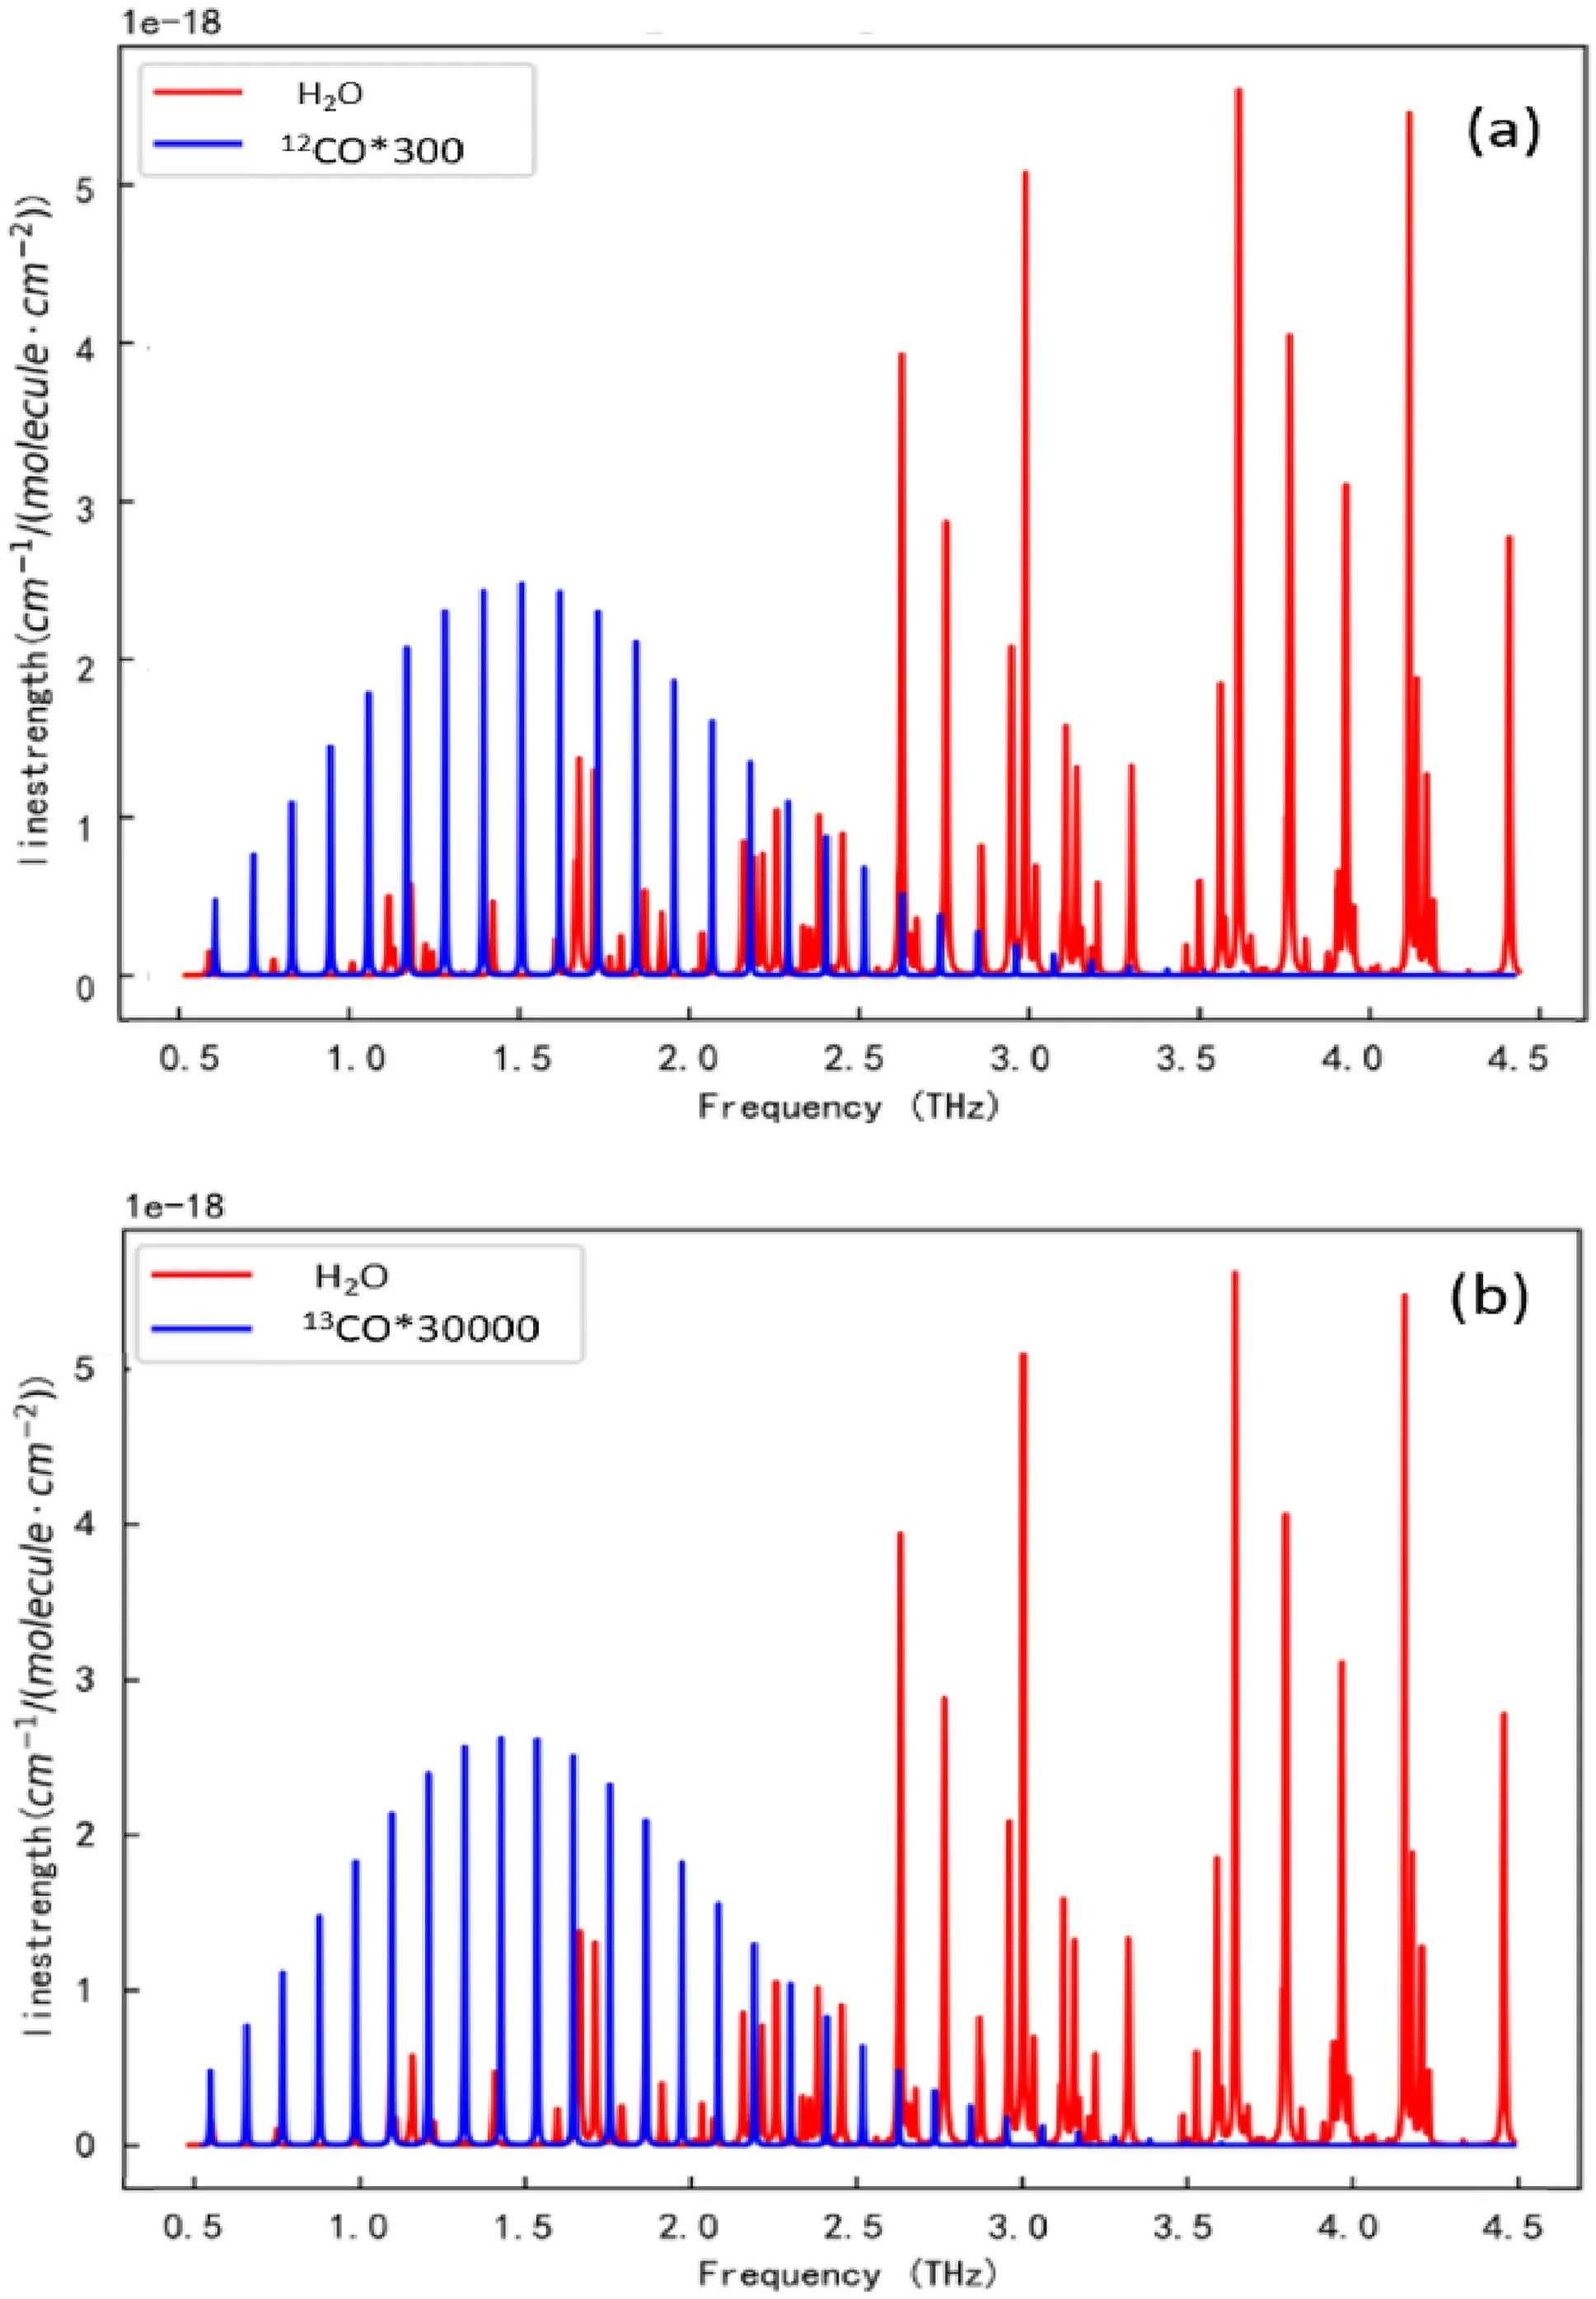
Fig.1 Absorption spectra of 12CO,13CO and water in the terahertz band
As shown in the above two figures,in the spectrum range of 0.5–4.5 THz,the absorption peaks of CO molecules are a series of equally spaced spectra,while those of H2O are arranged irregularly.THz is mainly the absorption peak of CO,and some H2O absorption peaks are located in this band.The absorption peak between 2.5 and 4.5 THz is mainly H2O.Although there is overlap of absorption peaks in the range of the 0.5–2.5 THz frequency band,the absorption coefficient of CO is obviously greater than that of H2O in the longitudinal axis,so the generation of the absorption peak is mainly from CO,and the influence of H2O can be ignored.
3 Research method
3.1 Experimental equipment system
The asynchronous optical sampling (ASPPS) technique was used in this experiment.Two mode-locked lasers were used,one as a pump light source with a repetition frequency offand one as a probe light source with a repetition frequency off+Δf.Assuming that thet0time pump and probe pulses coincide in time,there was a time difference Δtwhen the next pulse arrived due to different repetition rates.The time difference Δtwas added to each pulse successively until they coincided again to form an equivalent time sampling,thus realizing the time sampling measurement of the THz pulse by detecting light.Based on the typical THz-TDS system,this system added a laser source and reduced the time delay device.
In the whole terahertz time domain spectrum detection system,the gas cell is an important component.Because the space between the light source and the detector is limited,only one gas cell can be placed,so the gas cell is limited in length and size.The position of the gas cell in the whole experimental device system is shown in Fig.2.
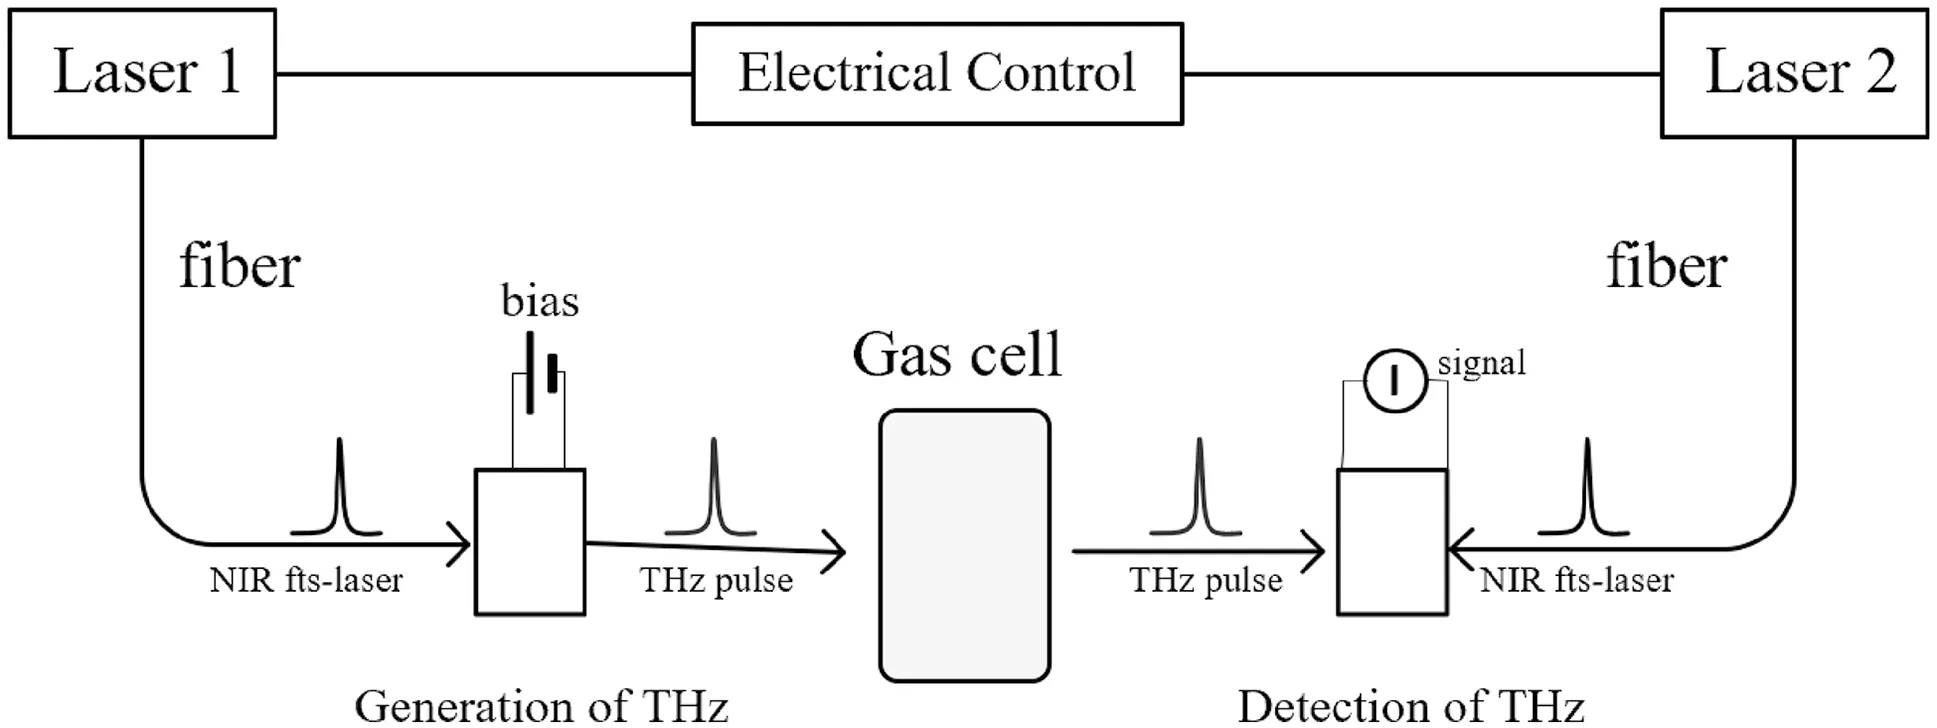
Fig.2 THz-TDS system based on asynchronous sampling

Fig.3 Time domain diagram of the gas cell in the terahertz band

Fig.4 Frequency domain diagram of the gas cell in the terahertz band
The gas cell is made of a stainless steel cylinder and can withstand a certain pressure.The length of the inner gas chamber is 66 mm,the diameter is 28 mm,and the diameter of the outer window is 59 mm.One side of the gas chamber is a corrosion-resistant gas inlet and outlet.TPX windows (4-methylpentene polymer) with high transmittance in the THz band are used at both ends of the chamber.It is only necessary to fill the prepared gas sample into the gas cell and place it on the THz-TDS sample table for measurement.
3.2 Experimental process
The terahertz absorption spectrum of the gas cell was measured by the THz-TDS system.Figure 3 shows the time-domain diagram of the terahertz spectrum of the measured gas cell.The absorption spectrum on the left(black) is that without the gas cell,and the absorption spectrum on the right (red) is that with the gas cell.By comparing the reference absorption spectrum with the absorption spectrum of the gas cell,it can be found that the whole spectrum is delayed and the signal intensity is weakened after the gas cell is put in.This is because the gas cell has a refractive index greater than 1,and THz waves travel slower through the gas cell than through air.The larger the thickness of the gas cell is,the larger the overall spectral delay.The weakened signal is due to the absorption of terahertz waves by the gas cell.
Figure 4 shows the frequency domain diagram of the terahertz spectrum for measuring the gas cell.The absorption spectrum line(red)at the bottom is the terahertz spectrum diagram of the gas cell,and the absorption spectrum line (black) at the top is the reference absorption spectrum without the gas cell.
The transmittance of terahertz waves in the gas cell at 0.5–3.5 THz is shown in Fig.5.The absorption rate of terahertz waves in the gas cell is relatively low in the range of the terahertz band(0.5–3.5 THz),so the transmittance is relatively high.Therefore,this gas cell is used in this experiment to meet the experimental requirements.
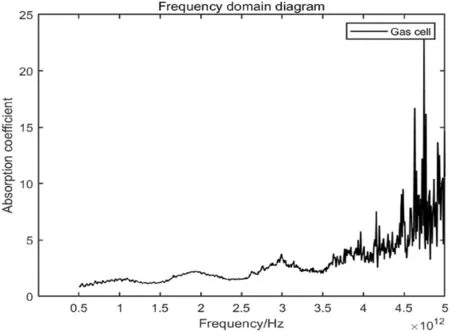
Fig.5 Absorption spectrum of the gas cell in the terahertz band
The test sample was purchased from Wuhan Nureide Trading Co.,Ltd.The purity of carbon monoxide gas was 99%.The CO molecule is a polar molecule whose rotational spectrum is located in the terahertz band,which has been proven in the above theoretical derivation.The device of the terahertz time-domain spectral system adopted in the experiment is shown in Fig.2.During the experiment,to reduce the absorption of THz waves by water in the air and improve the signal-to-noise ratio,the THz optical path was covered in a nitrogen-filled box.The relative humidity in the box was maintained at approximately 4% and 5%,and the temperature was maintained at approximately 24 °C.To eliminate the influence of water absorption on terahertz waves at the CO characteristic absorption peak,the terahertz spectrum after passing through the gas cell was measured,and the terahertz absorption spectrum without samples in the gas cell was referred to as the reference spectrum.The terahertz time-domain signal diagram of the reference spectrum is shown in Fig.6.The terahertz spectrum of water with different relative humidities is shown in Fig.7.Figure 8 shows the absorption spectra of water measured under this experimental condition.Figure 9 shows the absorption spectrum of the water level in the terahertz band obtained from the HITRAN spectral database.It can be seen from the figure that water has a large number of obvious absorption peaks in the range of 0.5–4.5 THz,and the absorption intensity of water becomes significantly stronger after 2.5 THz in combination with the theoretical diagram of the water absorption spectrum obtained from the HITRAN gas absorption spectrum database,it is found that in the absorption spectrum of water in the terahertz band,the position of the absorption peak and the proportional relationship between the peak sizes of different absorption peaks are in good agreement with the theoretical values.
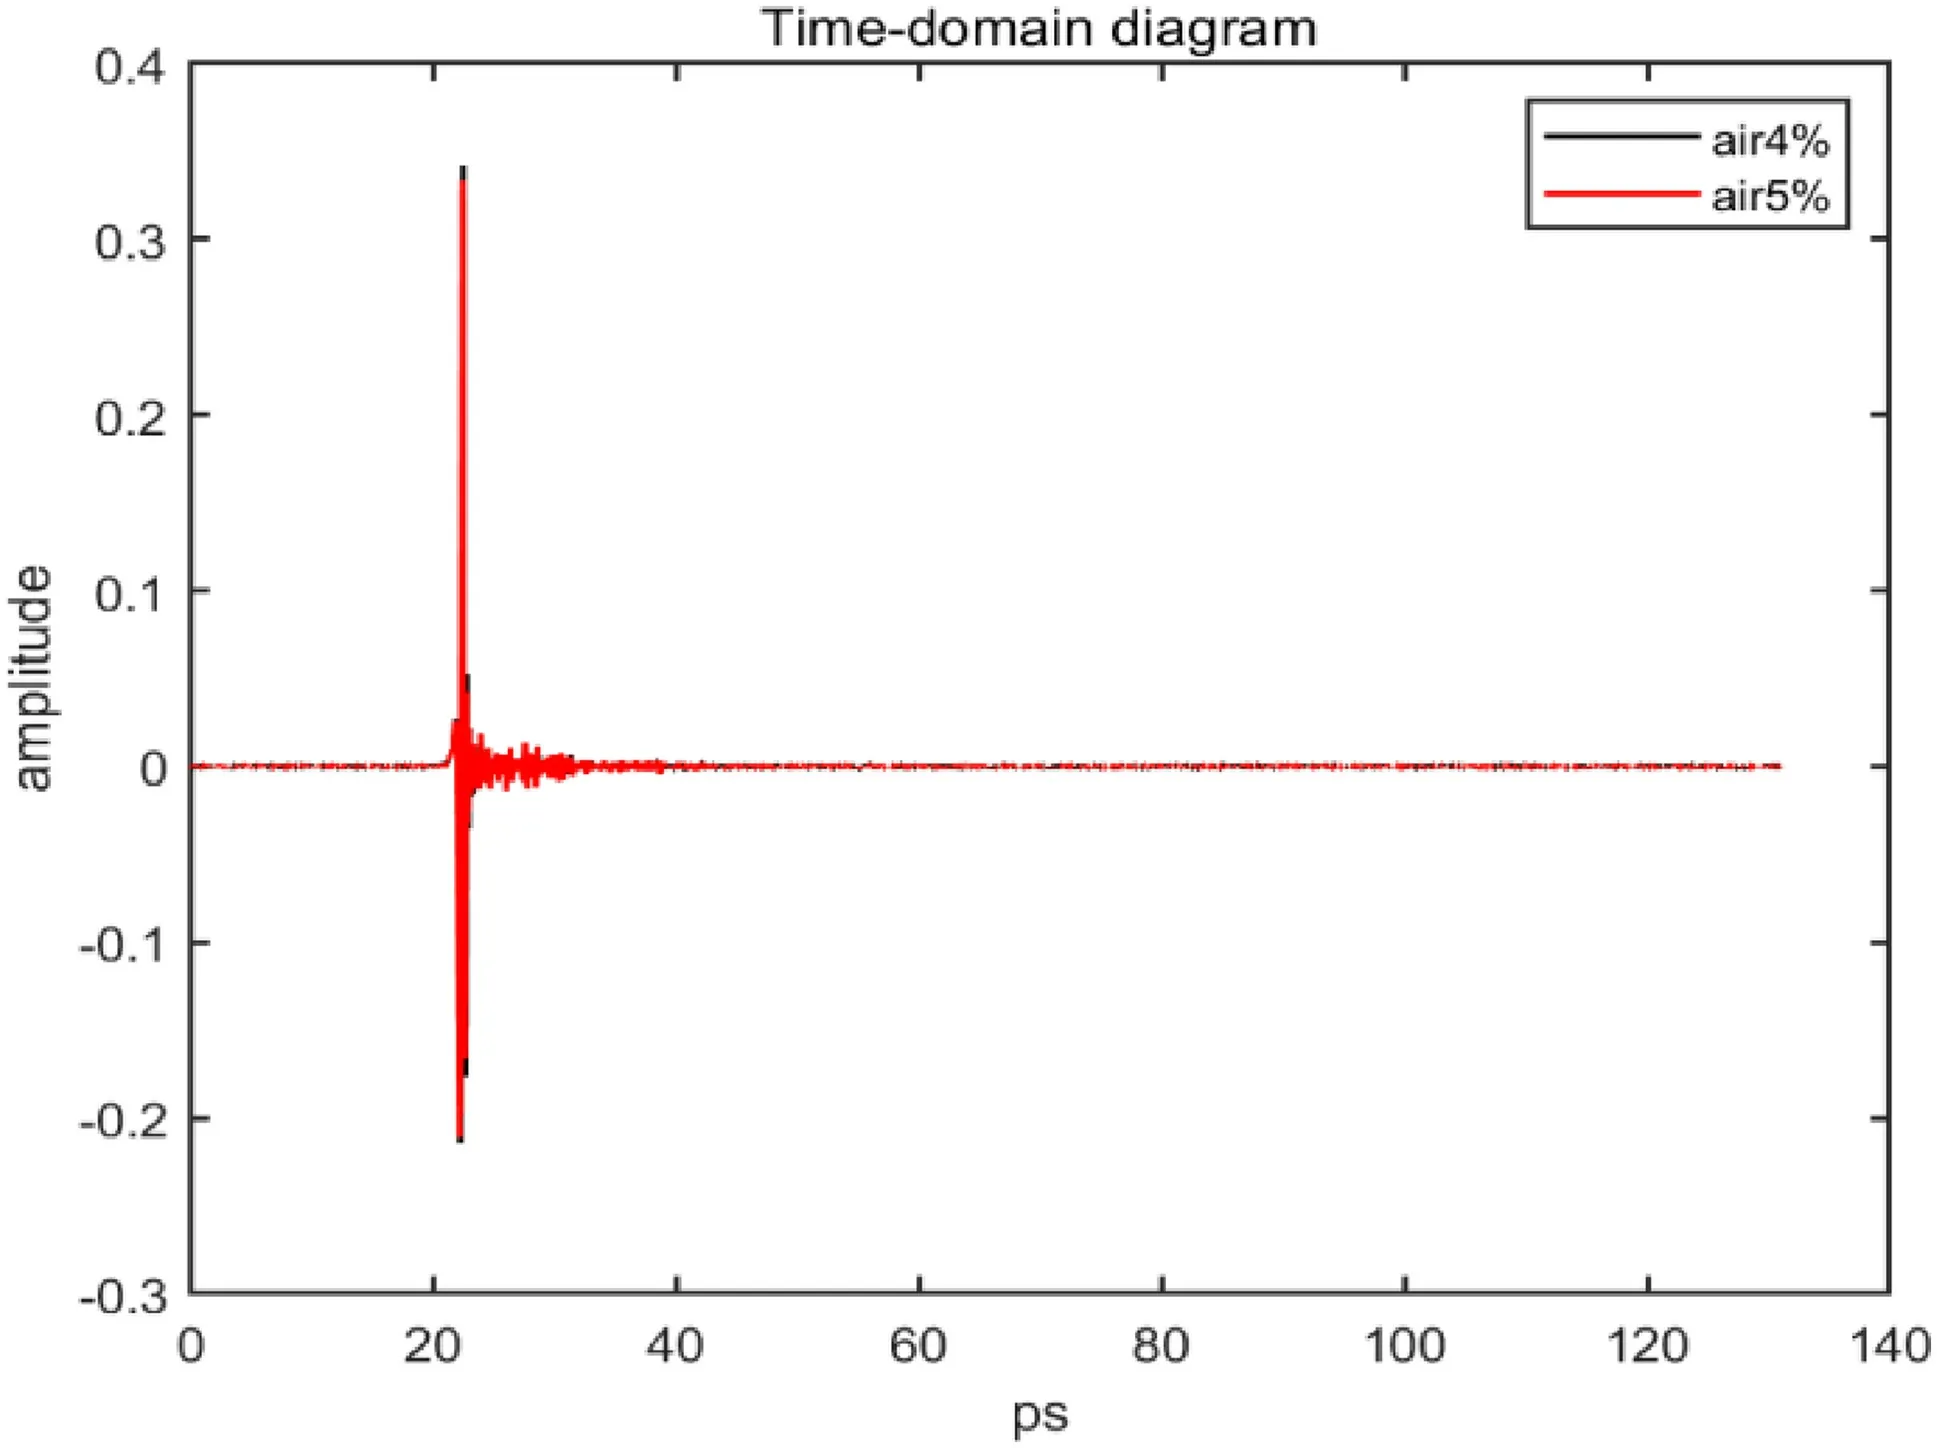
Fig.6 Time-domain diagram of water with different humidities in the terahertz band

Fig.7 Frequency domain diagram of water with different humidities in the terahertz band

Fig.8 Experimental diagram of the absorption spectrum of water

Fig.9 Theoretical diagram of the absorption spectrum of water
3.3 Experimental results and analysis of gas mixtures
3.3.1 Terahertz spectrum of 40% 13CO
During the experiment,a gas cell filled with a mixture of12CO and13CO was placed in the detection optical path to measure the absorption spectrum of terahertz waves after passing through the gas cell.When the humidity in the box is 4%,Fig.10 is the terahertz time-domain signal of the mixed gas,and Fig.11 is the frequency domain spectrum obtained by the time-domain signal through the fast Fourier transform.The effective range of the terahertz signal in the frequency domain is approximately 0.5–4.5 THz,so the subsequent data processing of the experiment is carried out in the spectrum range of 0.5–4.5.In the effective range,the sample signal has an obvious absorption peak compared with the reference signal.
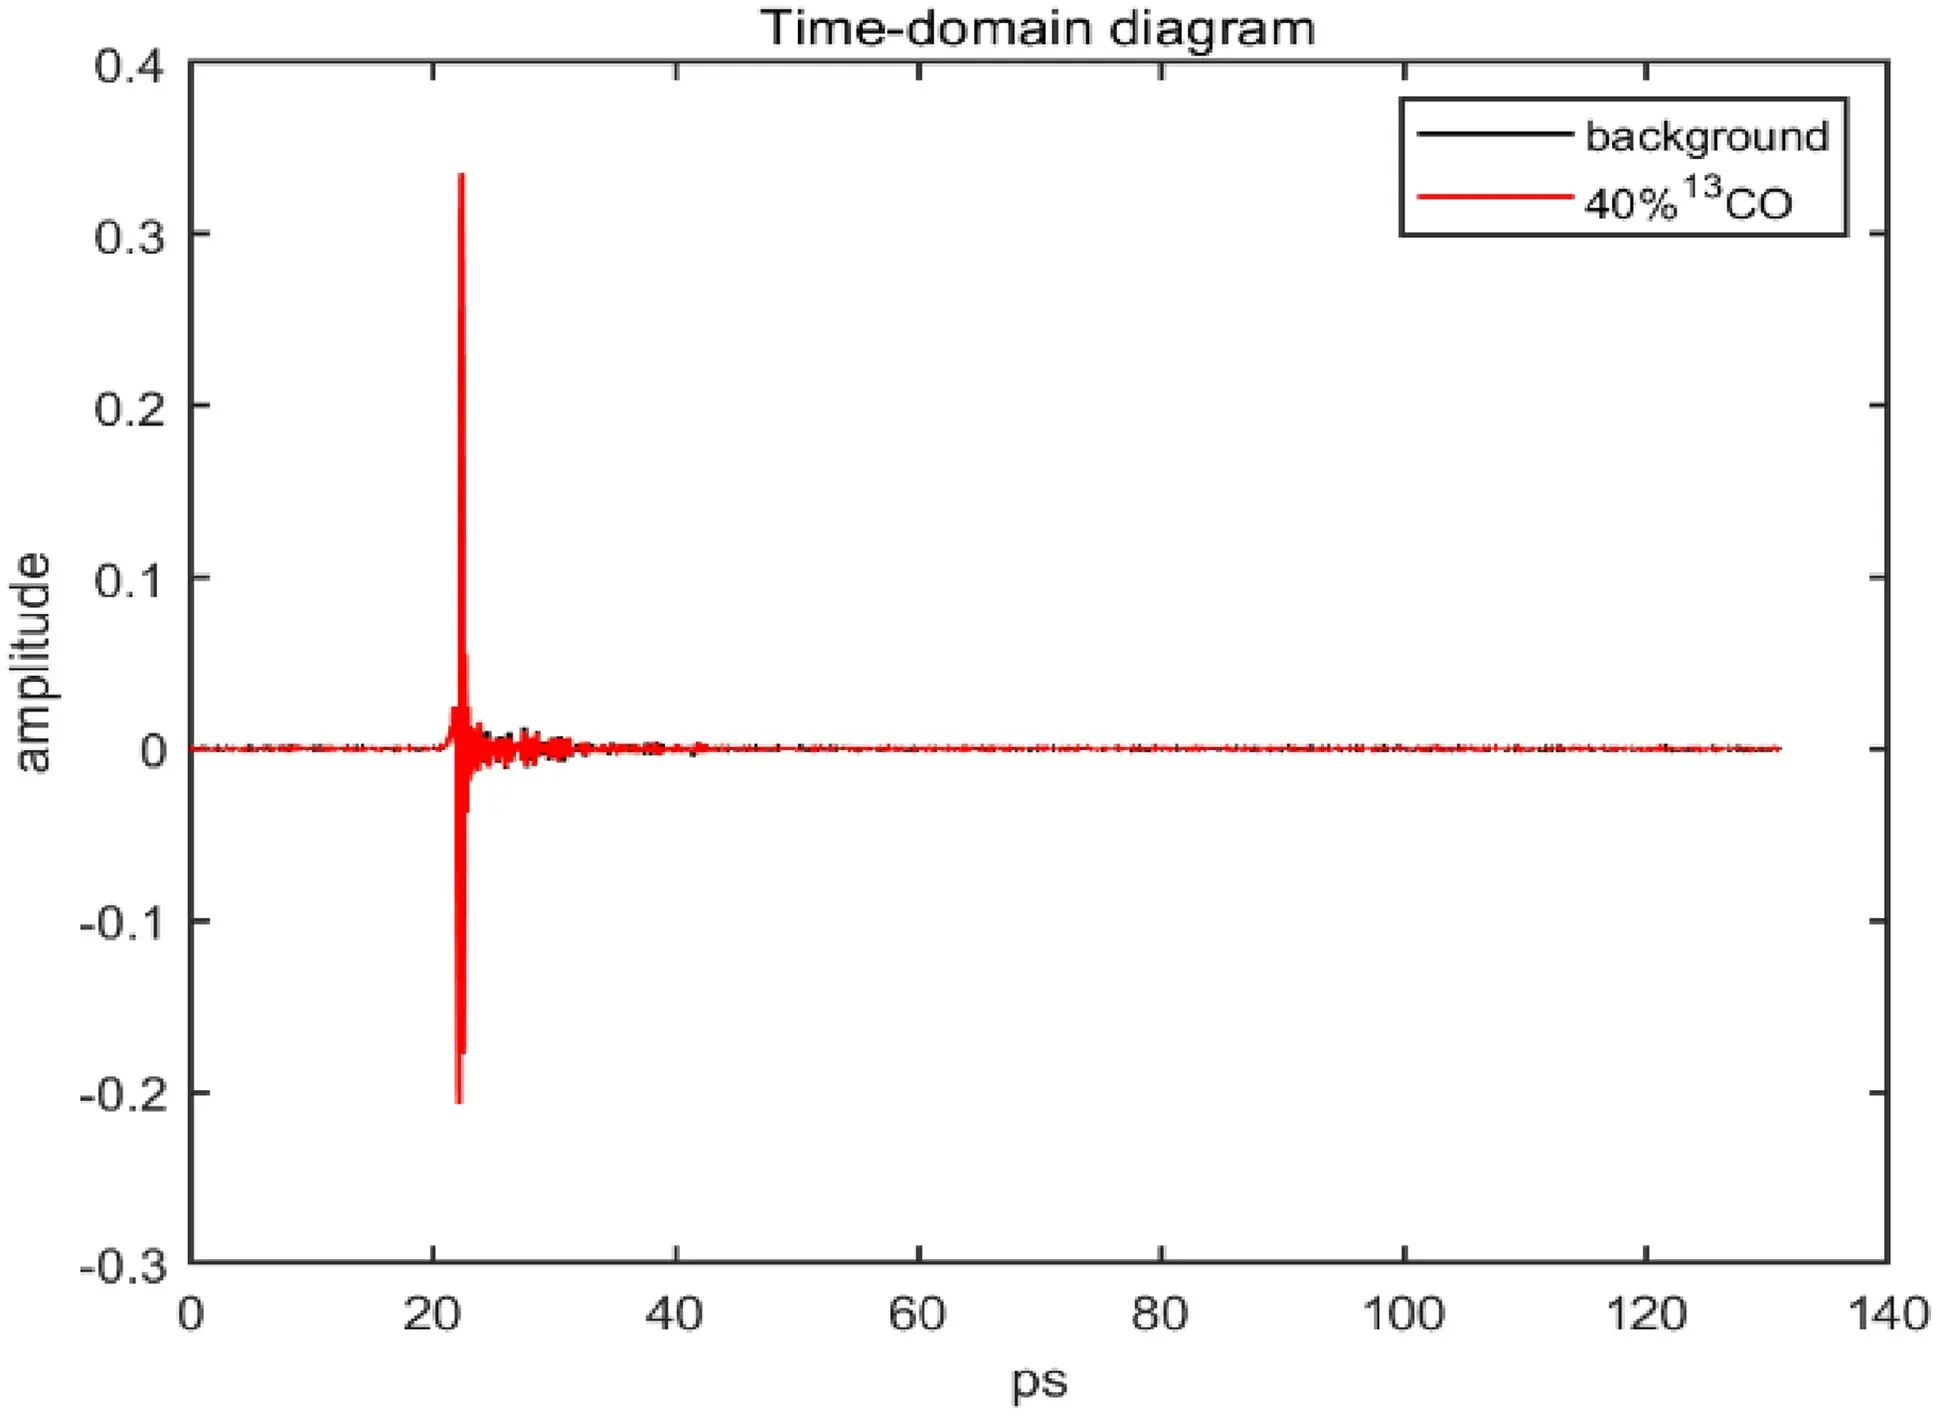
Fig.10 Time domain diagram of 40% 13CO in the terahertz band
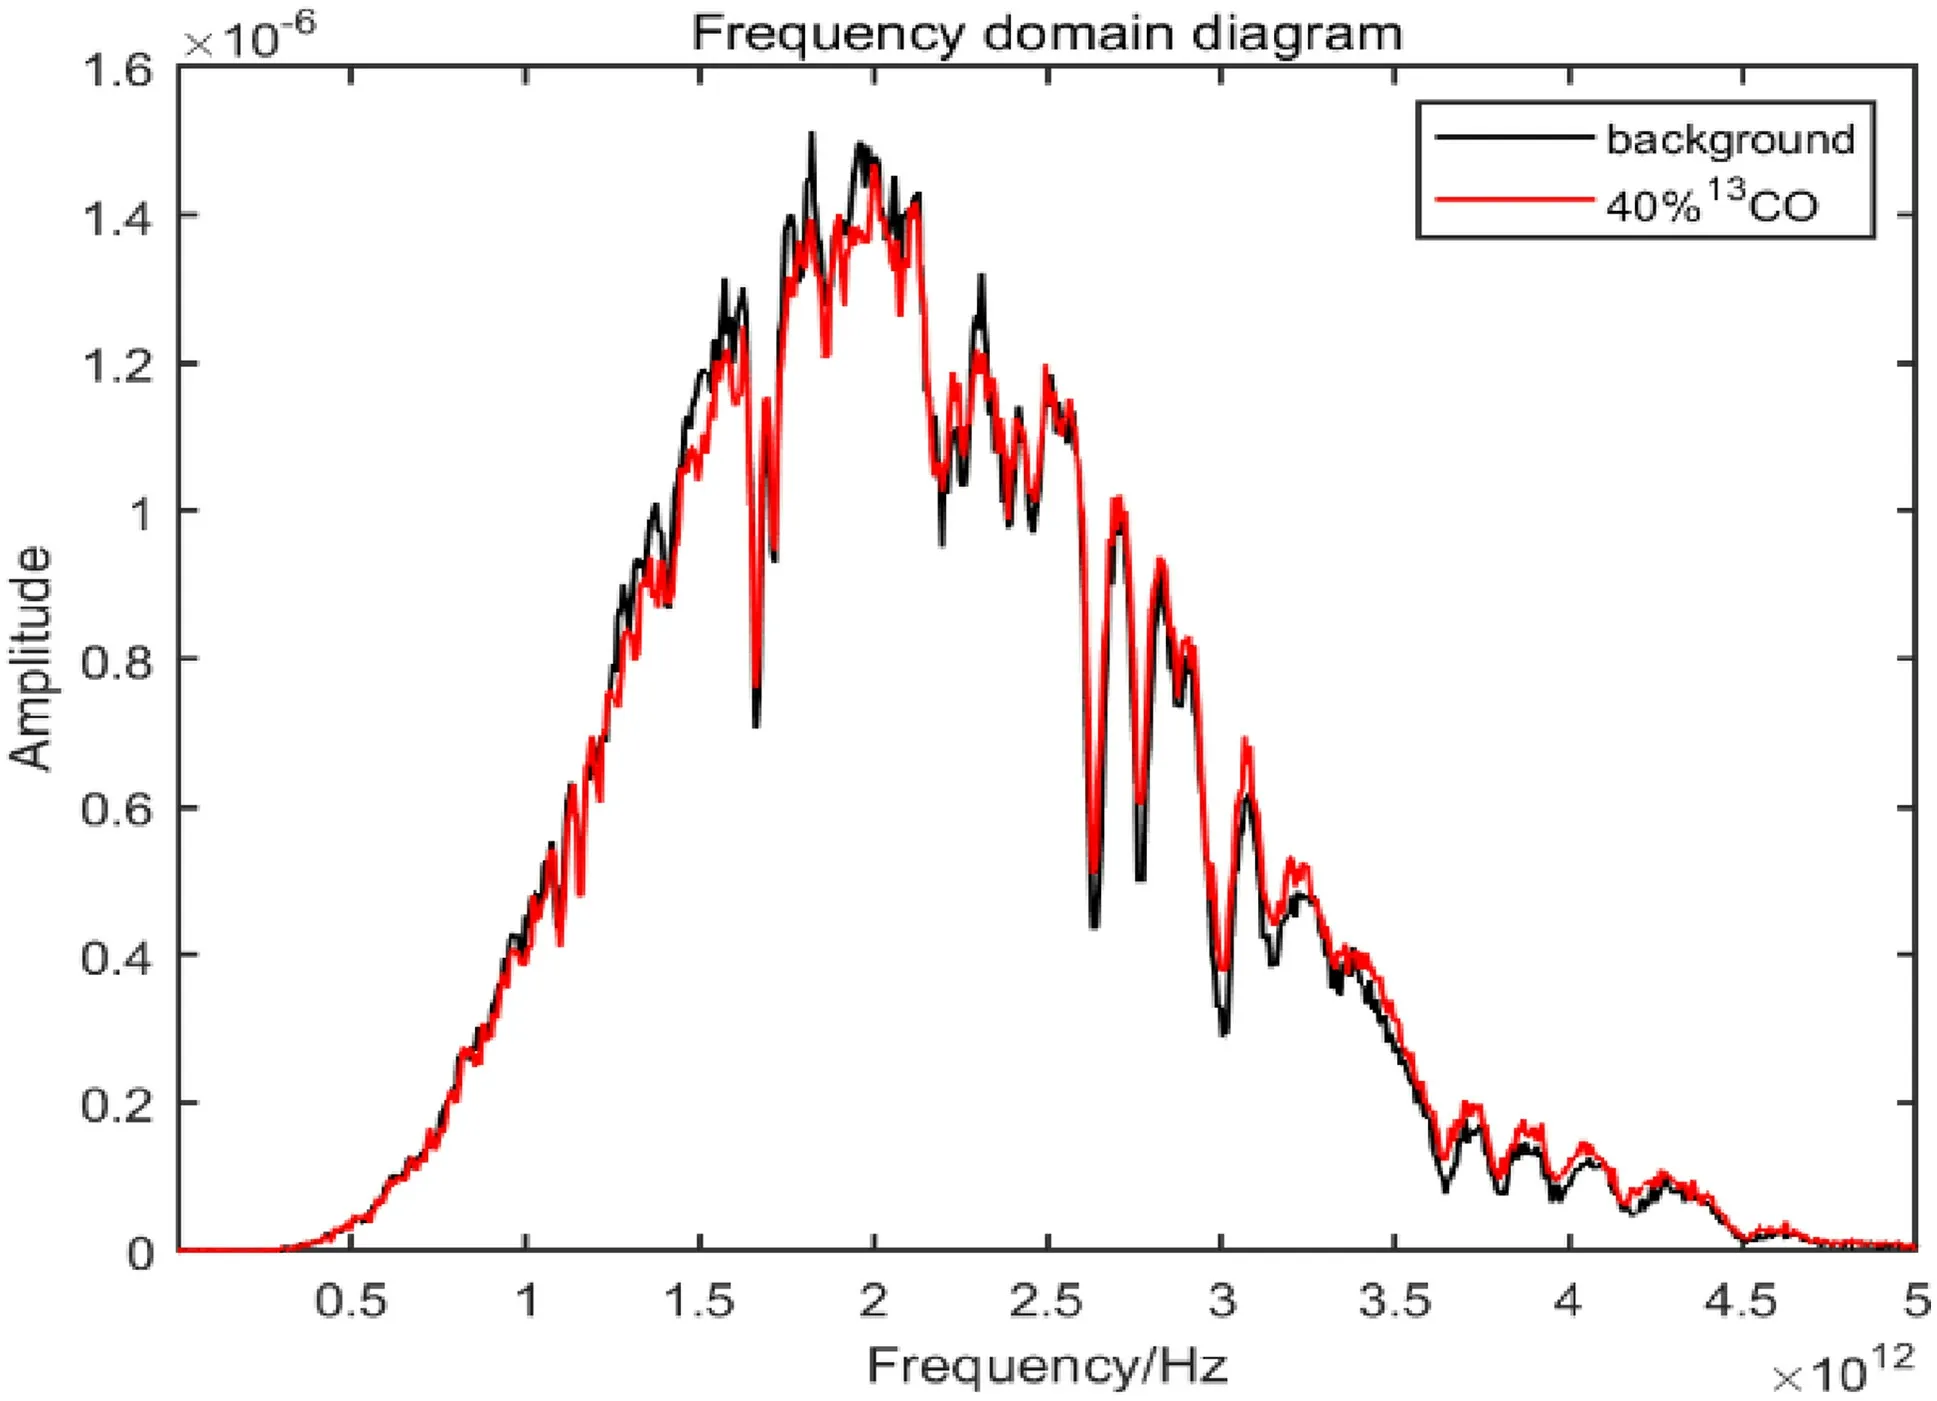
Fig.11 Frequency domain diagram of 40% 13CO in the terahertz band
According to the theoretical absorption spectra of12CO and13CO in the HITRAN gas absorption spectrum database,the theoretical absorption peaks of CO are mostly between 0.5 and 2.5 THz,which is also consistent with the characteristic absorption peaks of12CO and13CO obtained by theoretical calculation (Nolt et al.1987;Zink et al.1990).Therefore,the absorption peaks of12CO and13CO can be better distinguished from Fig.12,as shown in the figure below:
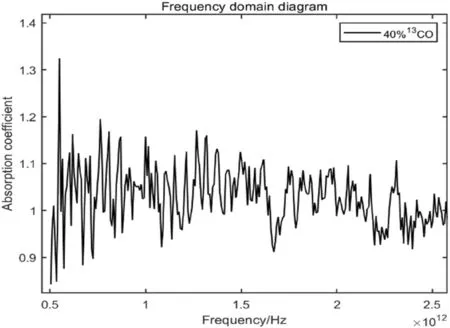
Fig.12 Absorption peak of 40% 13CO in the terahertz band
The absorption peaks of12CO and13CO are a series of spectra with equal spacing,which is in accordance with the characteristics of rotational spectra.Collated by the figure above and combined with the theoretical simulation results,Table 2 is obtained:
As seen from Table 2,the frequencies of the main characteristic absorption peaks detected by THz-TDS in this experiment are arranged as above.It can be seen from the data in the table that the error between the experimental value and the theoretical calculated value is small.Figure 13 is fitted from Table 2,and the measured rotational quantum numbersJof12CO and13CO are approximately linear with the rotational frequencyv,as shown in the figure below.
As shown in Fig.13,according to relevant knowledge,the slope is 2B,and the rotation constantsBof12CO and13CO are calculated to be 0.058 and 0.055,respectively,which is consistent with the calculated results of theoretical values and the experimental values of the previous stage.Therefore,the characteristic absorption peaks of12CO and13CO can be obtained and distinguished simultaneously in the13CO terahertz spectrogram with 40% abundance.
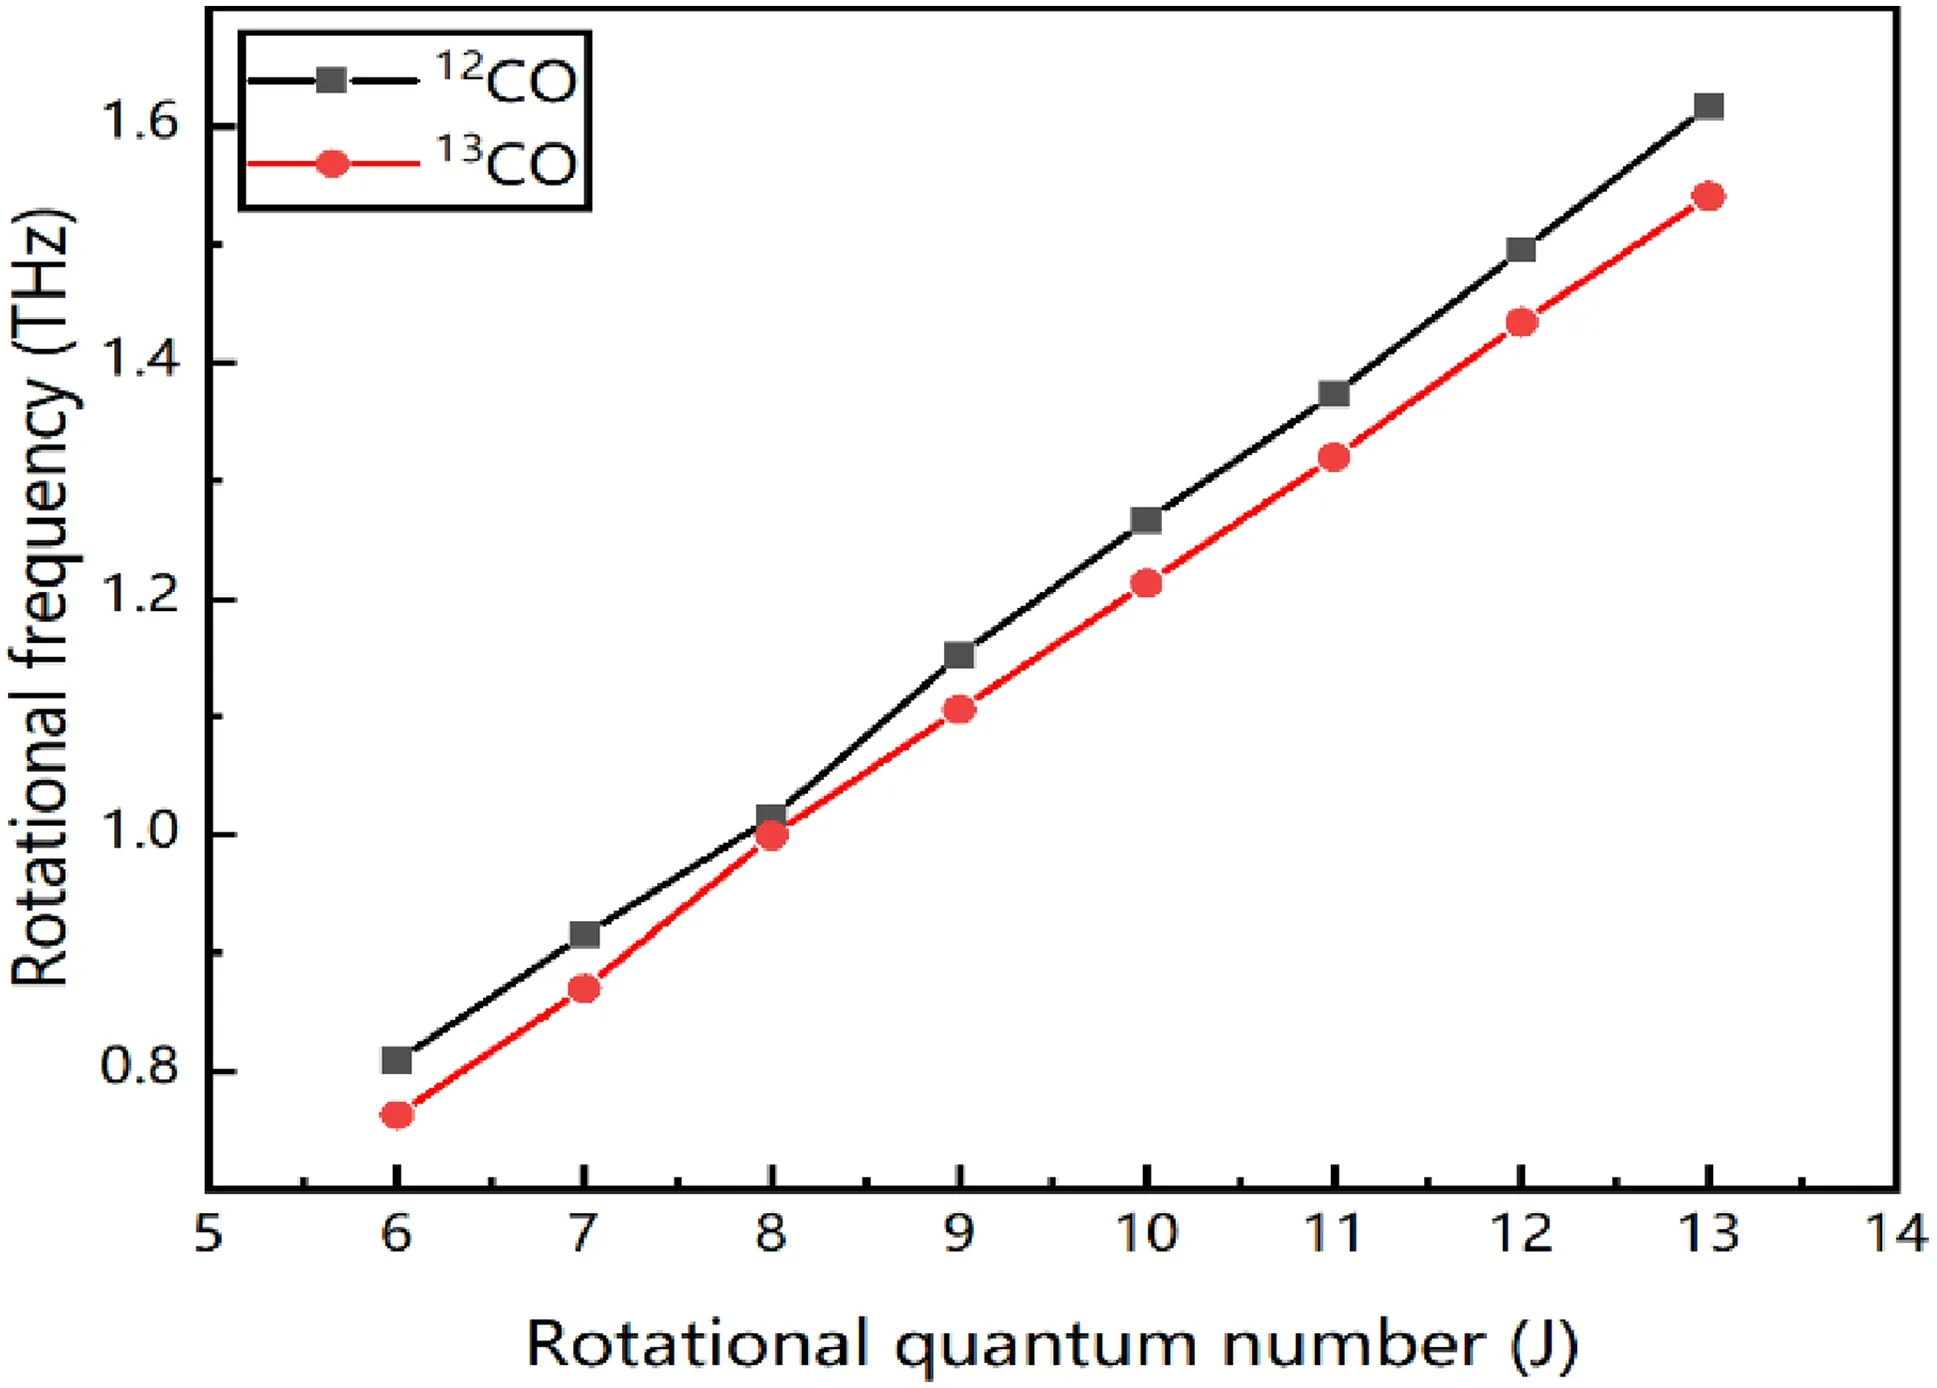
Fig.13 Relation between the rotational quantum number and rotational constant of 40% 13CO
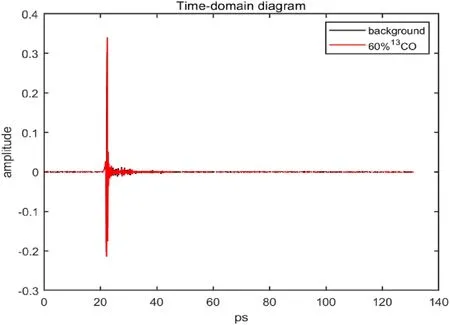
Fig.14 Time domain diagram of 60% 13CO in the terahertz band
3.3.2 Terahertz spectrum of 60% 13CO
The sample in this experiment is13CO gas with 60%abundance,which can be obtained in the same way.Figure 14 shows the terahertz time-domain signal diagram of the mixed sample,and Fig.15 shows the terahertz frequency domain spectrum of the sample is obtained through a fast Fourier transform.
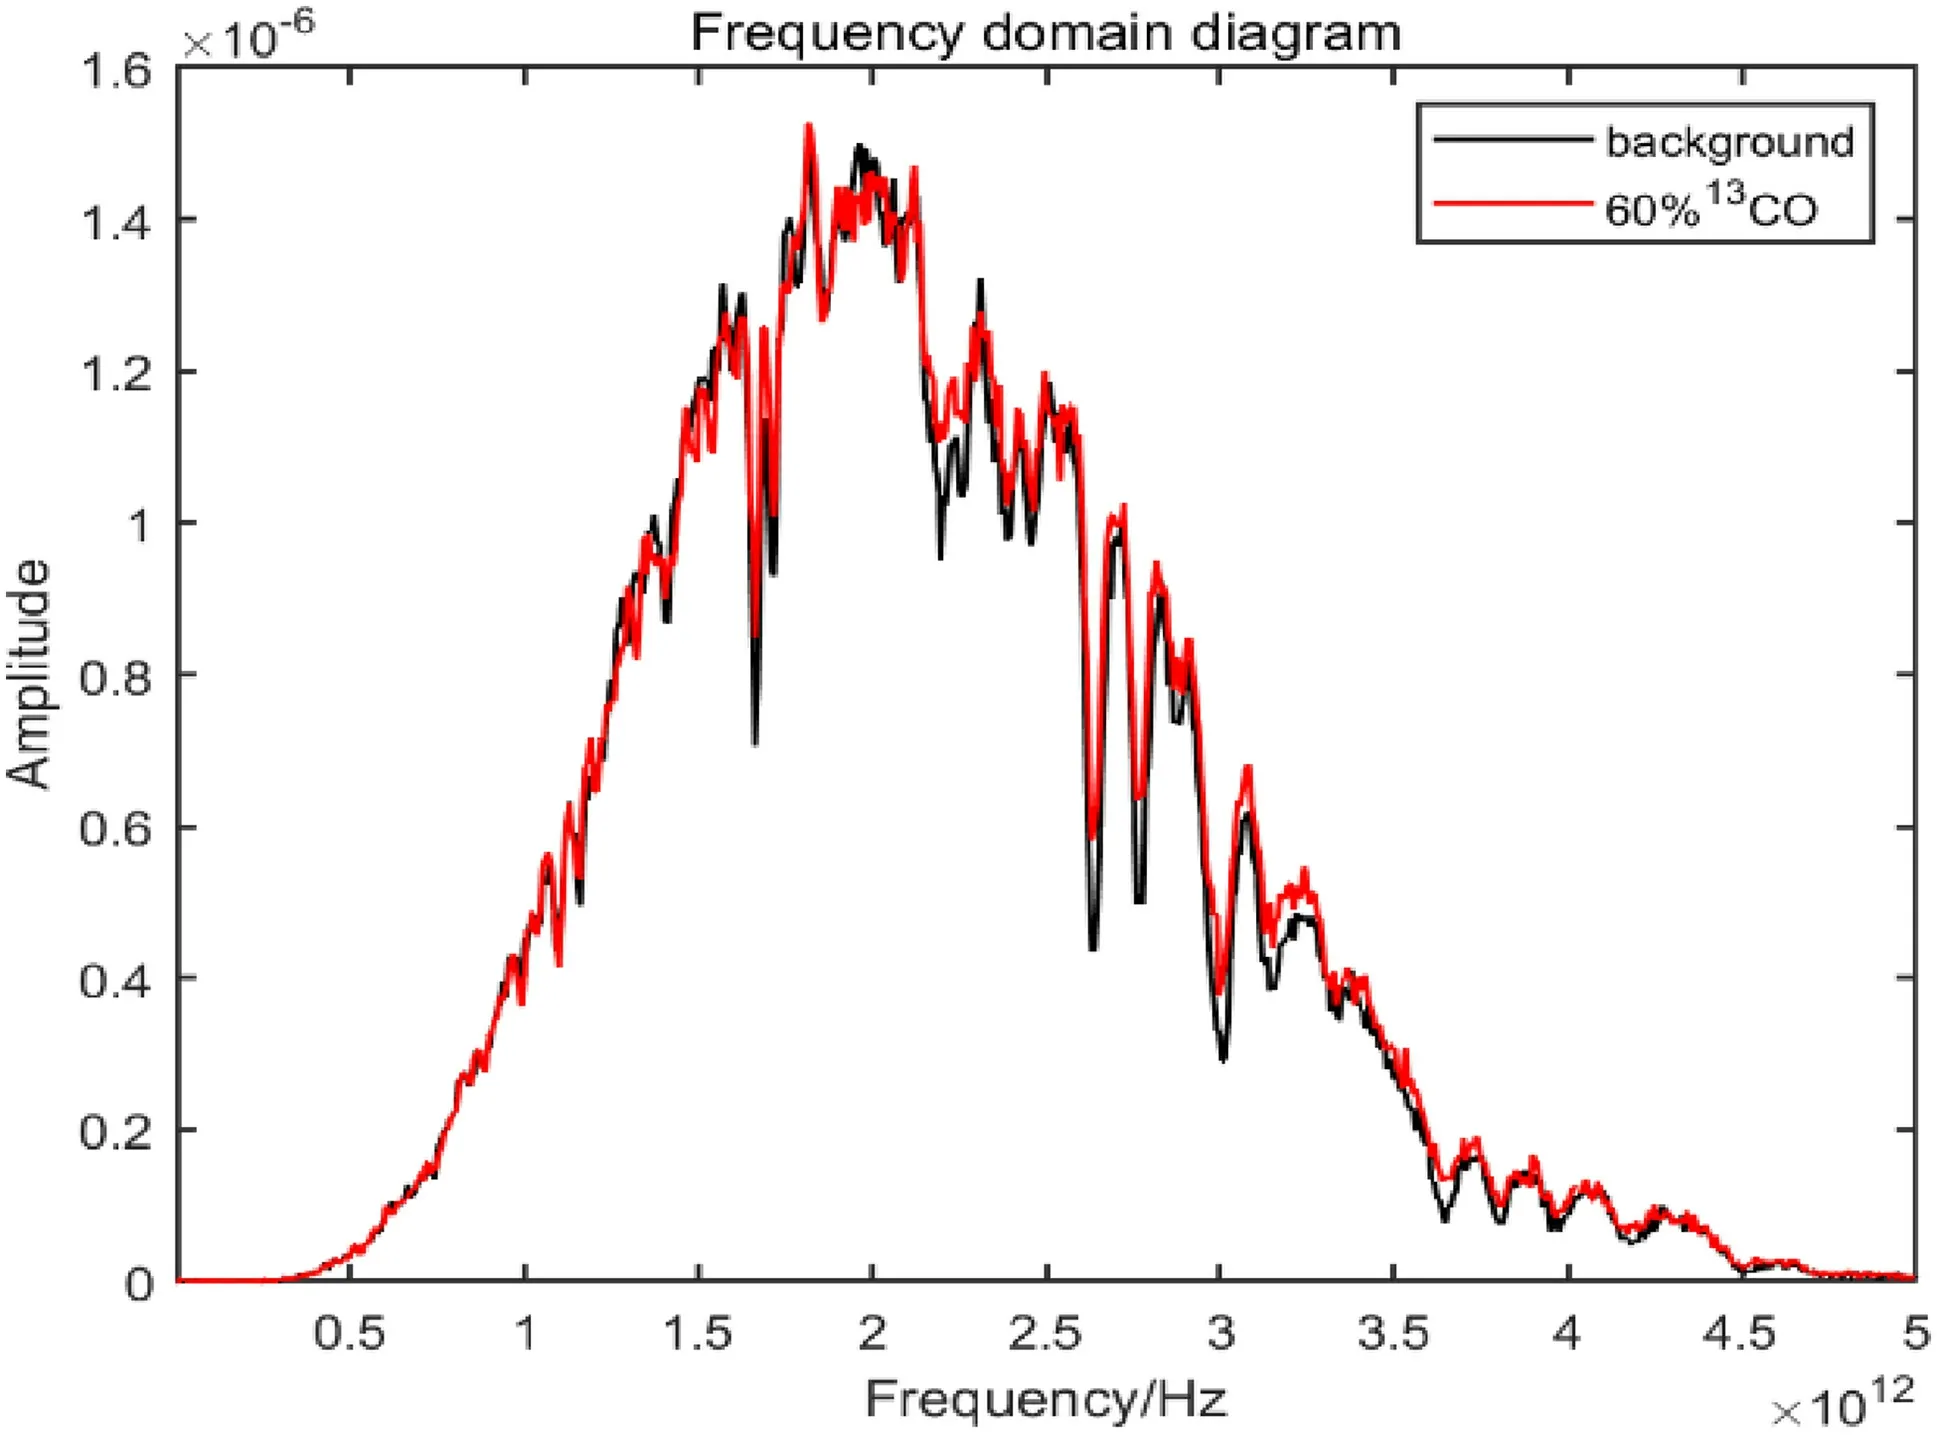
Fig.15 Frequency domain diagram of 60% 13CO in the terahertz band
After further data processing,the absorption peak of the mixed sample in the spectrum range of 0.5–2.5 THz was obtained,as shown in Fig.16.The figure can better distinguish the absorption peak of12CO and13CO,as shown in the figure below:

Fig.16 Absorption peak of 60% 13CO in the terahertz band
Table 3 is obtained by sorting out the figure above and combining the theoretical simulation results (Nolt et al.1987;Zink et al.1990):
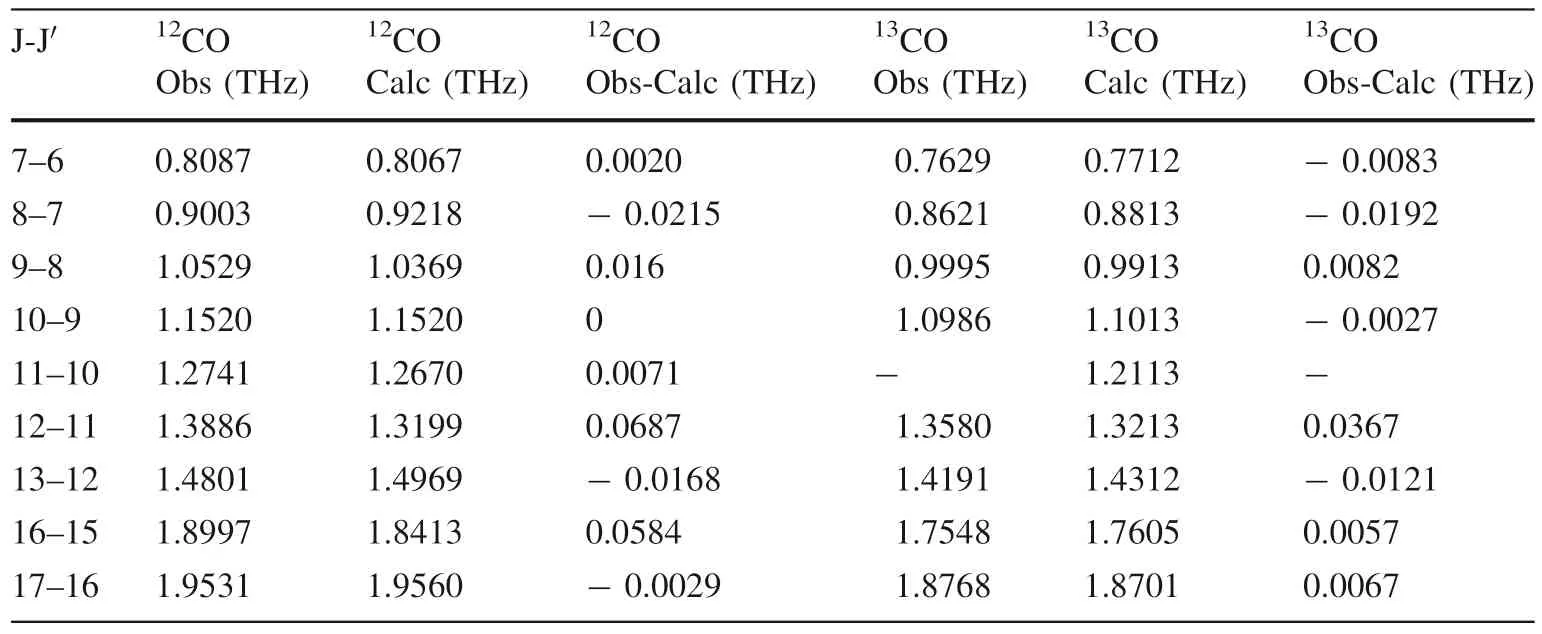
Table 3 60% 13CO rotation spectrum
Similarly,Fig.17 is fitted from Table 3,and the measured rotational quantum numbersJof12CO and13CO have an approximate linear relationship with the rotational frequencyv.

Fig.17 Relation between the rotational quantum number and rotational constant of 60% 13CO
As shown in Fig.17,the slope is 2B,and the rotation constants of12CO and13CO are also 0.058 and 0.055,respectively,which are consistent with the calculated results of theoretical values and the experimental values of the previous stage.Therefore,it is also proven that the characteristic absorption peaks of12CO and13CO can be extracted from the terahertz spectrum with a 60% abundance of13CO.
4 Results and discussion
The absorption spectra of carbon monoxide in the terahertz band were measured by terahertz time-domain spectroscopy.The characteristic absorption peak of CO at the 0.5–2.5 THz band was obtained.The results show that12CO and13CO have significant characteristic absorption peaks in this band,and can be extracted from the same spectrum.The experimental results are in good agreement with the obtained theoretical simulation results (Nolt et al.1987;Zink et al.1990).Moreover,these research results are highly consistent with the experimental results measured by Hu Ying using THz-TDS(Hu et al.2006)and Sun using FTIR (Sun et al.2007).This study proves that THz time-domain spectroscopy can detect and distinguish different isotopologues,lays a foundation for further detection of more isotopologues,and has the conditions for further quantitative analysis of isotopologues.
Terahertz time-domain spectroscopy is an effective means for qualitative and quantitative analysis of various gas components,and has important application value in the detection of isotopologues.Terahertz waves from interstellar materials tend to contain information on their respective gaseous molecules,it can be predicted that the study of the peaks of specific molecular absorption lines by terahertz spectroscopy will be helpful to the study of star formation,galaxy evolution,cosmology and other rich celestial information at various levels.
AcknowledgementsThis paper is supported by Chinese NSF project(42130114),the strategic priority research program (B) of CAS(XDB41000000) and the pre-research Project on Civil Aerospace Technologies No.D020202 funded by Chinese National Space Administration (CNSA).
Declarations
Conflict of interestThe authors whose names are listed above certify that they have NO affiliations with or involvement in any organization or entity with any financial interest (such as honoraria;educational grants;participation in speakers’ bureaus;membership,employment,consultancies,stock ownership,or other equity interest;and expert testimony or patent-licensing arrangements),or non-financial interest(such as personal or professional relationships,affiliations,knowledge or beliefs) in the subject matter or materials discussed in this manuscript.On behalf of all authors,the corresponding authors state that there is no conflict of interest.Yun Liu is Depyty Editor-in-Chief of Acta Geochimica.He was not involved in the journal’s review of,or decisions related to,this manuscript.The authors have no other competing interests to disclose.
- Acta Geochimica的其它文章
- The cooling models of Earth’s early mantle
- Petrology of lherzolite xenoliths of Hosséré Sédé volcano(Adamawa plateau,Ngaoundéré area,Cameroon)
- Distribution,risk evaluation,and source analysis of the heavy metals in the sediment deposition of the lower Shichuanhe River,Shaanxi,China
- Decoding the nature of interaction between felsic clasts and mafic magma in a subvolcanic magma chamber from amphibole–titanite transformation and chemistry
- In situ infiltration-precipitation processes in some rock systems
- Magma source and tectonic setting of the Dunde granite in the Western Tianshan: constraints from geochronology,geochemistry,and Sr–Nd–Hf isotopes