
In situ infiltration-precipitation processes in some rock systems
2023-10-13 01:17ZahraaIbrahimRabihSultan
Acta Geochimica 2023年5期
Zahraa Ibrahim • Rabih Sultan
Abstract We carry out a chemical treatment (acidization or basification) of typical rock specimens in-situ,and characterize the emerging pattern resulting from the infiltration-precipitation scenario.Galena and limestone samples were treated with sulfuric acid,while pyrite was reacted with sodium hydroxide.Various infiltration techniques were employed,after selection of the most feasible method for each rock separately.The patterns of anglesite(PbSO4),anhydrite (CaSO4) and goethite (FeOOH) deposition presented different alteration modes of the bare rock textures.Among the three deposited minerals,only the anhydrite (CaSO4) displayed a band stratification.The formation of a Liesegang pattern in the rock of highest porosity indicates a plausible correlation between the band formation and a minimum porosity requirement.A banded rock of compact texture could then be formed by a cementation mechanism,governing the long time evolution of the rock.
Keywords Liesegang ∙Limestone ∙Galena ∙Pyrite ∙Anglesite ∙Goethite ∙Reaction–diffusion ∙Percolation ∙Porosity ∙Pattern formation
1 Introduction
Periodic precipitation,or Liesegang (Liesegang 1896;Henisch 1988) banding,discovered in 1896,is a phenomenon widely studied in the laboratory until nowadays,due to the rich and diverse physico-chemical scenarios that underlie its dynamics.It consists of the display of parallel bands or rings of precipitate,as co-precipitate ions interdiffuse in a gel medium.The presence of a gel matrix is a traditionally necessary requirement to prevent the fast sedimentation of the sparingly soluble salt.The band formation results from the nonlinear coupling between diffusion and precipitation reactions.Liesegang systems have been the subject of comprehensive studies (Henisch 1988)and periodic reviews (Sultan 2002;Müller and Ross 2003;Nabika et al.2020).Typical Liesegang patterns in one-,two-,and three-dimensional space are depicted in Fig.1a.
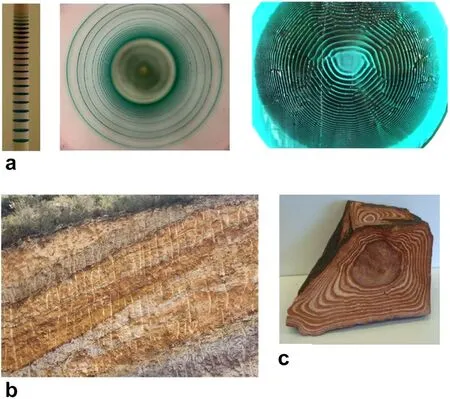
Fig.1 a Liesegang patterns of Co(OH)2 from CoCl2 and NH4OH in 1D(left),2D(middle),and 3D(right).b Stratification in a rock in the region of Jezzine,South Lebanon.c Rhyolite stone,also called the Liesegang stone,displaying concentric ring-like stripes
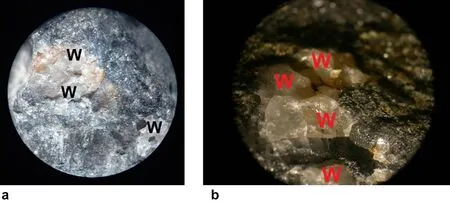
Fig.2 Photomicrographs of the treated galena rock after deposition of the white PbSO4 mineral.The pictures show the white crystals (labeled W)embedded within the galena medium,at two different magnifications: a 1.5 × b 4 ×

Fig.3 Time evolution (marked in days) of the rock treatment after H2SO4 infiltration.The change in texture is observed gradually.The final aspect of the rock is shown after 220 days
The geological landscape presents a typical analogy with the Liesegang phenomenon (Liesegang 1913;Kruhl 1994),given the common observation of a widespread variety of banded and often colorful rocks.The analogies with Liesegang banding have then been stretched to encompass banded patterns not necessarily resulting from precipitation.Such alternation of stripes is seen in biology,chemistry,geology,engineering,and medicine (Sadek and Sultan 2011);and,because of this striking resemblance,any natural pattern presenting a sequence or alternation of bands or stripes is frequently referred to as,or coined a Liesegang pattern.
The closest similarity with Liesegang patterns remains in the geochemical scenery (Sadek and Sultan 2011;Jamtveit and Meakin 1999;Chacron and L’Heureux 1999;L’Heureux 2013;Sultan and Abdel-Rahman 2013) (see Fig.1b,c) and is the subject of the present paper.But is every layering observed in a broad and extended geological landscape congruent with a Liesegang scenario? Not necessarily (Ortoleva 1994).For example,dunes,seasonal variations,and sedimentary layering are not envisaged as Liesegang patterns.A vast discussion of the various possible mechanisms with supporting models can be found in the geochemical literature (Jamtveit and Meakin 1999;Sultan et al.1990;Msharrafieh et al.2006).
Interest in modeling geochemical dynamical processes started growing in the early 1980s(Ortoleva 1994;Dewers and Ortoleva 1989;Ortoleva et al.1986).Examples of geochemical self-organization are typically characterized by mineral or textural patterns in rocks such as cement bands,metamorphic layering,and oscillatory zoning.In a modern view,periodic bands in rocks are believed to result from a nonlinear dynamical scenario due to the coupling of precipitation reactions to the transport processes (essentially diffusion but also percolation and convection)driven by the infiltration flow of the dissolved minerals.Such a mechanism requires the self-patterning system to be out of equilibrium,just like in a laboratory experiment on a tremendously smaller time scale.Continuous normal or reverse compositional zoning,as well as discontinuous oscillatory zoning,can all be signs of physico-chemical disequilibrium.
The generated patterns may be periodic or aperiodic.Typically,the principal processes taking place on widely different time scales,such as a fast precipitation reaction,coupled to slow diffusion of co-precipitate ions yield a pattern of parallel precipitate bands.The huge gap between laboratory time scales and geological time scales remains the primordial challenge in establishing a parallel and a close correspondence between simulation experiments carried out in gels,and geochemical processes taking place in natural rock beds.Back in the 1990s,it was pointed out(Jacob et al.1994) that ‘‘time and interdisciplinary efforts were needed to build a broad and solid acceptance of nonlinear,self-organization mechanisms among the geological community’’.We note that just like precipitate patterns in soft gels last for months or years,the compact,dense bands observed in hard rock media are spatially locked for eons (Msharrafieh et al.2016).Diffusion-precipitation experiments in gels take from a few hours to a few days,while geological transformations last thousands or even millions of years.
Yet,the striking similarity between the obtained patterns in the two domains,along with congruence in the detailed features (spacing laws,secondary banding,eventual aperiodicities) support the viability of a Liesegang-like scenario.L’Heureux(2013)established a detailed comparison between Liesegang patterns in gels and a variety of geological landscapes of different origins such as eruptive(magmatic),sedimentary,hydrothermal,or metamorphic.The most important analogy resides in the solution of reaction-transport dynamical equations,which successfully predicts the formation of sandstones (Vernon 2021),stylolites(Toussaint et al.2018),sapropels(L’Heureux 2013),gypsum/limestone (Al-Ghoul and Sultan 2019),marl/limestone(Böhm et al.2003)and some other systems.In a recent study (Ezzeddine and Sultan 2022),the coexistence of bands and spherulites in the carbonation of a lime gel putty exhibited similarity with bands and orbicules on the surface of a rhyolitic obsedian rock sample.
To overcome any controversy or skepticism,we engaged in forging the physico-chemical processes inside the rock medium(Msharrafieh et al.2006,2016)through a simple physical supply and control of the flow of reagents.In a previous study,the final pattern in the acidization of limestone performed in Msharrafieh et al.(2016) was obtained after 692 days(almost two years).This leads us to a simple conclusion that not any observed rock pattern is necessarily the labor of geological ages.Although the gel method captures the features of banded patterns in rocks and provides a suitable setting for establishing a close parallel in a tremendously accelerated time frame,the insitu picture remains more realistic.Geochemical self-organization through a dynamical reaction-transport scenario is well supported by theoretical modeling studies (Sultan et al.1990;Ortoleva 1994;Al-Ghoul and Sultan 2019).
In the present paper,we bridge the gap between the laboratory experiments in gels,and the vast natural landscapes by carrying out experiments in-situ,i.e.by causing the reaction-transport processes to take place inside real rock samples.The purpose of this method is to eliminate the necessity of drawing time gap analogies: instead,the physico-chemical processes take place on the scene site,just as they would happen in nature.We study three experimental routes tested on three different rock systems:galena,ferruginous limestone,and pyrite.We further investigate the possible correlation between the rock porosity (Woods 2014;Barnes et al.2013) and the type of pattern obtained.
2 Experimental section
Periodic precipitation finds its most feasible and interesting application in the banding modalities seen in rocks.Hence,an experimental simulation of the rhythmic repetition of parallel bands was attempted herein-situ,on three different rock systems.We force and steer the deposition inside a rock bed by replicating the physico-chemical mechanisms that contribute to such deposition,thus accurately mimicking the genuine natural scenario rather than focusing on the study of existing,‘‘readymade’’ banded patterns in some rock specimens.To reach this goal,we forge the geochemical processes (transport+precipitation) in some rocks in-situ:galena,limestone,and pyrite,by selecting the most suitable method.We use techniques such as infiltration using an infusion pump,dropping the solution onto the medium,or half immersing depending on the method that yields the best results.Each rock sample was subjected to porosity measurement in an attempt to correlate the patterns to the porosity,as explained and described in Sect.4.All experiments were performed in a cold room maintained at a temperature of 20 °C.Although high temperatures(>1000 °C)govern the fractional crystallization of various minerals from the magma and layering in igneous rocks(Sultan and Abdel-Rahman 2013),the infiltration of reactive water into a rock aquifer takes place at ambient atmospheric temperatures.So a temperature of 20 °C was selected as a typical representative value.A recent article studied the effect of temperature on Liesegang patterning in polyacrylamide gels (Ali Khan et al.2022).We present the experimental procedure(s) in this section and analyze the obtained patterns in Sect.3.
2.1 Galena rock
Galena,a magmatic rock of grey black color,is the chief ore of lead,and one of the most widely spread metallic sulfides(Nnanwube and Onukwuli 2020).This experiment is done by infiltrating a galena rock with sulfuric acid,causing the dissolution of the lead sulfide mineral in the bare galena rock (PbS) medium according to:
The simultaneous diffusive flow of sulfate ions causes the precipitation of lead II sulfate (PbSO4) behind the dissolution front,in accordance with the reaction:
Trial experiments have shown that dropping within a drilled hole method gives better results than infiltration using a pump (i.e.unlike the limestone experiment of the next Sect.2.2).A cylindrical hole of 1.0 cm diameter and 5 mm depth was drilled at the center of a rock specimen,with great care as galena is a brittle rock.Using a glass Pasteur pipet (Hirschmann),2.0 M sulfuric acid (H2SO4)was added dropwise into the hole until it is filled,then the system was left to set.On the next day(after 24 h),another drop was added,then the addition was repeated daily for 220 days.The pattern morphologies are displayed,and the results are discussed in Sect.3.Scratched powder samples from the various zones(original rock and the deposit areas)were taken and collected in small vials,then analyzed afterward by powder X-ray diffraction.
2.2 Limestone rock
We focus here on reproducing previous results on the acidization of a limestone rock(Msharrafieh et al.2016).A reddish brown ferruginous limestone rock,rich in the calcite mineral (CaCO3) and highly porous is treated with H2SO4.High porosity allows easy acid percolation inside the rock.The acid dissolves CaCO3resulting in a moist Ca2+medium.The infiltration flow causes the precipitation of Ca2+in the form of anhydrite or gypsum (CaSO4or CaSO4∙2H2O respectively).The net reaction is:
Sulfuric acid(2.0 M)was injected into a limestone rock sample using an infusion pump and left for 18 days.Deposits were obtained in the form of irregularly shaped rings.The detailed procedure and the experimental setup were presented in Msharrafieh et al.(2016).
2.3 Pyrite rock
A third rock was tested,chosen to have a porosity distinct from the other two.Since the ferruginous limestone rock used is a sedimentary rock of relatively high porosity compared to galena,a sample of pyrite rock with apparently intermediate porosity was selected for a close investigation.Pyrite,or fool gold is present in sulfide ores(Keith et al.2016) of gray-yellow color with silver luster.The rock sample was half-immersed in a sodium hydroxide(0.50 M NaOH) solution as the outer infiltration electrolyte.The entire setup was then wrapped with aluminum foil and left in the cold room,to avoid the exposition to sunlight (Kako et al.2014).Macroscopic and microscopic pictures of the treated rock were then taken using a fluorescence microscope (Stereo);as well as scanning electron photomicrographs (SEM) coupled to EDX,after coating the samples with a thin layer of gold(10 nm thickness).The net reaction is:
3 Results and discussion
3.1 Galena rock
We start by considering the results obtained for the galena rock.Photographs of the outer surface of the treated rock shot with a Sony digital camera (DSC-F717),show the appearance of white patches originating at the center,and nearly radially outwards.We observe a zonation of white deposits randomly distributed on the surface.
The random white crystallites consisting of the PbSO4precipitate are spread on the surface,leaving clear areas of the dominant black background,which is mainly the bare rock medium.Figure 2 shows a photomicrograph of the treated rock at two different magnifications,clearly illustrating the white PbSO4crystals embedded within the host rock medium.
Figure 3 highlights the time evolution of the infiltrationdeposition experiment,provoking a gradual alteration of the rock texture,into a randomly distributed alternation of white-patched deposits,separated by unaltered black zones.
Although the appearance of the pattern is not that of standard Liesegang stripes,however,the alternation in the zonation modality and the absence of a uniform spread is in congruence with a nonlinear reaction-transport scenario.A longitudinal section was performed on a treated (drilled)galena rock,to examine any pattern formed inside the rock.The cross-section is depicted in Fig.4.
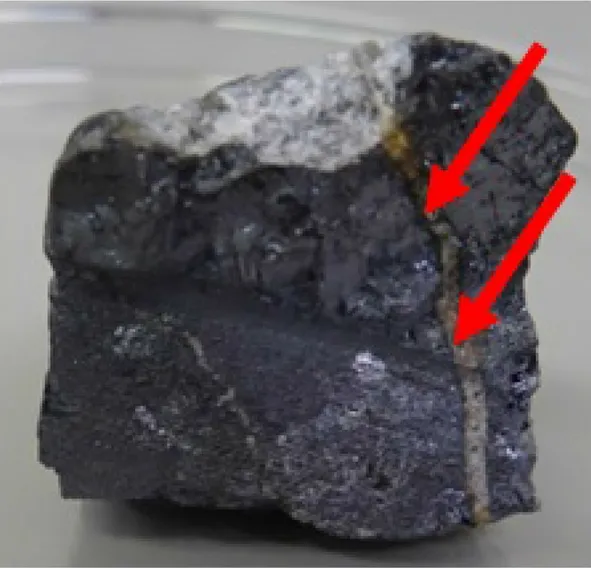
Fig.4 Longitudinal cross-section of a treated galena rock (drilled at the center) and acidized with 2 M sulfuric acid.The rock is essentially compact and homogeneous;rare canals (indicated by the red arrows) may be present in the original sample
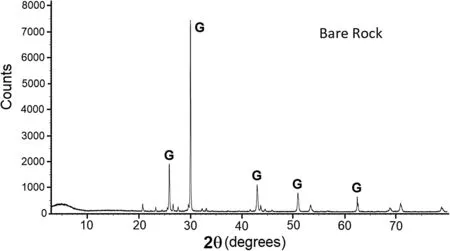
Fig.5 Powder X-ray diffractogram of the pure galena rock,labeled with galena (G) peaks

Fig.6 Powder X-ray diffractogram of the white region deposits,carefully scratched from the surface.The peaks labeled W (white)indicate the anglesite mineral PbSO4
No macroscopic banded patterns were observed,which is attributed to the relatively low porosity of the rock (see porosity measurements in Sect.4),thus hindering a smooth infiltration of the acid.
The chemical content of the various regions was determined by powder X-ray diffraction,on a Brucker D8 Discover instrument.The spectrometer was run in increments of 0.01 degrees,and the counts were collected at 0.5 s per step.The obtained diffractograms showed the X-Ray intensities on the vertical axis versus angles of 2θ on the horizontal axis.Figure 5 shows the X-ray diffractogram of the untreated galena rock sample.
The latter matches with the pattern of the PbS mineral,notably the peaks at 2θ=25.9,30.0,43.0,50.9,and 62.5°.Samples of the white patches deposited randomly onto the treated galena rock surface were scratched and ground into fine powder.Figure 6 displays the X-ray diffractogram of such sampled regions.
The latter coincides with the X-ray pattern of the PbSO4mineral (anglesite),thus confirming the deposition corresponding to Reaction 2.The characteristic peaks fall at 2θ=20.7°,23.2°,29.6°,and 43.7° (Zhang et al.2016).
Scanning electron microscopy (SEM) analysis was performed using a Tescan,MIRA3LMU with an Oxford EDX detector (Inca XmaW20).The accelerating voltage was 10 kV with a magnification scale of 500 nm.SEM photomicrographs of the bare galena rock sample and the white PbSO4regions deposited by reaction 2 are depicted in Fig.7.
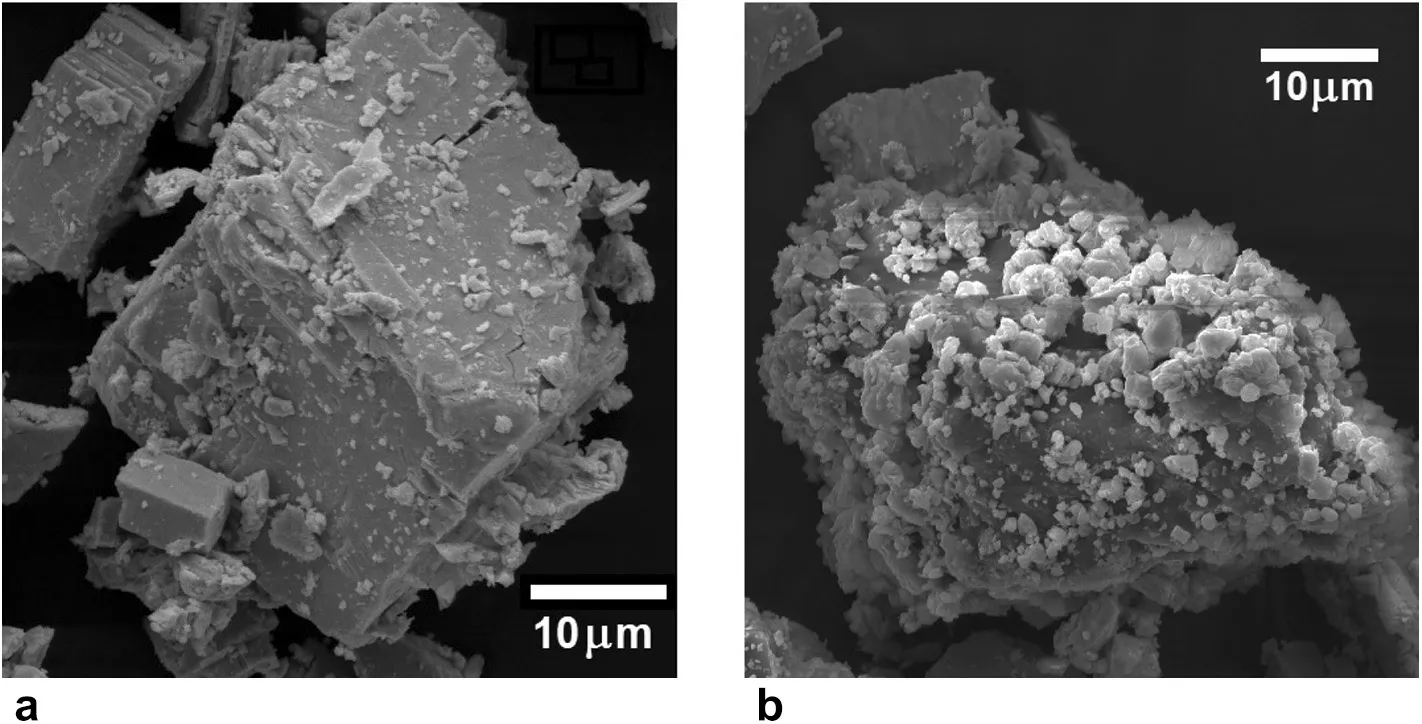
Fig.7 SEM micrographs of the crystalline particles on a 10 μm scale.a Bare galena cubic crystals.b Galena sample after the PbSO4 deposition.The small white crystals are sparsely scattered onto the galena mineral
The PbSO4crystals have an average size of 2.7 μm.EDX analysis yielded atomic percentages of 69.16% O,16.75%S,and 14.08%Pb,satisfactorily consistent with the ratio for PbSO4,O:S:Pb=4:1:1.
3.2 Limestone rock
In this section,we examine the results of the H2SO4infiltration inside a ferruginous limestone rock,described in Sect.2.2.The infiltration was regulated at a constant rate of 33 mL/min through an infusion pump (Thermo Orion;SAGE model M361).
The pattern obtained after 18 days is illustrated in Fig.8.

Fig.8 Ferruginous limestone rock treated with H2SO4 infiltrated through a tube with continuous flow.a Though with an irregular percolation-driven deposition,the CaSO4 zones alternate in layers.b The blue and red contours distinguish between clear and shadowed cavities respectively
A lateral cross-section of the rock shows a radial alteration of deposited CaSO4with an inter-band region essentially void of the latter mineral,typical of a classic Liesegang mechanism.The brown inter-band region,though not distinctly apparent (Fig.8a) is shadowed by some weak white deposits due to the irregular slow percolation of the acid,enhanced by the high rock porosity(see Sect.4).The red contours shown in Fig.8b represent clear zones,while the blue ones emphasize the inevitable shadowing by the white deposits.The results capture the findings of Msharrafieh et al.(2016),wherein the various zones (deposits and inter-band) were identified by X-ray analysis.
3.3 Pyrite rock
A third rock needs to be selected to pursue the investigation of the correlation between band formation and rock porosity.A pyrite rock was half-immersed in 0.50 M NaOH (VWR chemicals BDH) solution as described in Sect.2.3.The texture of the treated rock after 15 and 84 days,is shown in Fig.9.
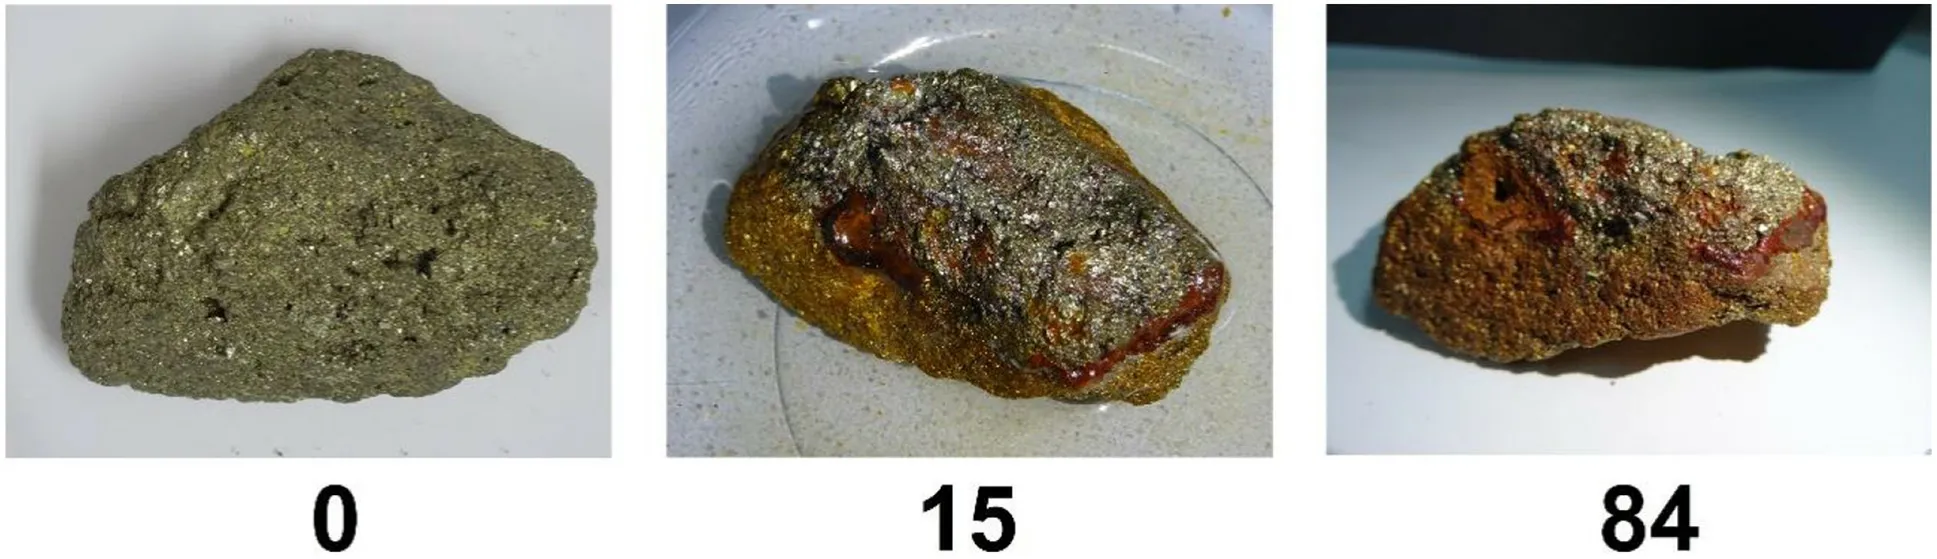
Fig.9 Time evolution of the treated pyrite rock,with time labels in days
A yellow–red deposit is observed to invade and cover the surface in various domains (see notably the 84 days frame of Fig.9).
Photomicrographs of the bare rock,and after treatment(taken using a Stereo fluorescence microscope) are shown in Fig.10.

Fig.10 Photomicrographs of the pyrite rock.a Bare rock before treatment.b After treatment with NaOH showing the red deposit
SEM pictures of the red regions deposited as patches(Figs.9 and 10b),with EDX analysis,are displayed in Fig.11a,b.
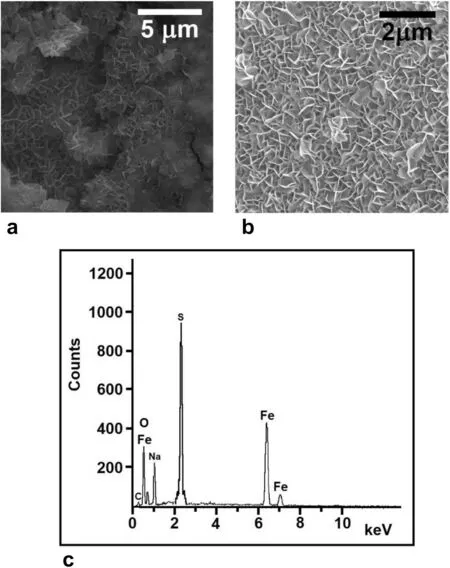
Fig.11 a and b SEM pictures of the red deposits on the surface of the pyrite mineral at two different magnifications.c Energy dispersive X-ray spectrum (EDX) of the red powder confirming the formula of the goethite mineral.The Fe and O peaks shown as weight percents(40.31% and 22.24% respectively),equivalent to 19.49% Fe and 36.17% O.Atomic percents integrate in the ratio O:Fe ≃2:1,consistent with the goethite mineral
The crystals are needle-like,consistent with the microstructure of the goethite mineral(α-FeOOH),in good agreement with the findings of Zhuang et al.(2017) and Gilbert et al.(2008).Analysis of the EDX spectrum depicted in Fig.11.c yields the atomic composition 19.49%Fe and 36.17%O,thus confirming the chemical formula of the mineral.The goethite mineral (FeOOH) is thus obtained by oxidation of the ferrous hydroxide (Sung and Morgan 1980) produced in reaction 4,according to:
The Na and S contaminants in the EDX are residues from NaOH and FeS (pyrite) respectively.The carbon(C)peak results from impurities in the original pyrite rock.We note here that the modeling of a pyrite-goethite system in a mechanism leading to bands was presented earlier(Sultan et al.1990).
4 Porosity measurements
The porosity of a rock is a central characteristic of its identity,and can intensely influence its properties and interactions,notably the infiltration of solution flow.A variety of methods for the measurement of porosity have been developed and reported in the literature(Jamtveit and Meakin 1999;Jahns and Burnham 1969).SEM techniques provide important visual imaging for the comparison of pore size in different rock samples.The most feasible procedures rely on densitometric techniques such as the mercury intrusion method;or gas adsorption methods(Wang 2017).The latter uses the Brunauer–Emmett–Teller(BET) quantitative analysis,which measures the extent of volume-equivalent substitution based on capillary condensation.In addition to the overall pore volume percent,it accurately provides an estimate of the average pore size along with the pore size distribution.The adsorbed gas utilized could be nitrogen (N2) or carbon dioxide (CO2)depending on the suitable rate of gas diffusion and the pore size range.The mercury intrusion is based on the infiltration of mercury inside the rock sample through the same substitution principle,but suffers from limitations(Yao and Liu 2012),and is to be avoided due to the toxicity of mercury (Langford and Ferner 1999).
SEM photomicrographs of the three studied rocks are highlighted in Fig.12.

Fig.12 SEM pictures of the three studied rocks,prior to the treatment.a Galena.b Pyrite.c and d limestone.The limestone has large crevices,revealing high porosity.The pyrite displays intermediate relief variations,while the galena distinctly appears as the most compact.Those topographic characteristics are consistent with the measured porosities 40.1,21.3,and 16.5% by volume
In the present study,we use a simple,safe,and ecofriendly method based on hot liquid gel infiltration.After pre-weighing the rock sample,we wrap it firmly with ultrathin gelatin paper(assumed of negligible volume) and measure its volume by water displacement (Archimides’s principle).After removal of the wrap,the rock is immersed in a beaker containing a hot gel solution(5%w/w agarose,Sigma-Aldrich) and kept on a thermostated hot plate(85 °C) for 6 h,to allow the gel to completely infiltrate through the pores.After gelation,the rock sample is removed and carefully collimated from the excess gel with a blade,while making sure to return the debris to the beaker.
The cooled rock is thus re-weighed with the infiltrated gel,and the mass of the latter is determined by the difference in weight.The volume of infiltrated gel (which is the total pore volume) is finally calculated from its known density,and hence the average pore volume percent is evaluated.
The results of the porosity measurements came out as follows: limestone (40.1%),pyrite (21.3%),and galena(16.5%).This is an indication that the band formation is to a clear extent correlated with porosity.The limestone with the highest (40.1%) pore space gave banding,the galena with the lowest(16.5%)pore space yielded random patches on the surface,while the pyrite rock of intermediate porosity(21.3%)displayed a clear zonation reminiscent of band alternation as seen in Fig.9 (84 days frame).
The photomicrographs of Fig.12 clearly emphasize the differences in porosity at the microscopic level.The last two frames correspond to the limestone rock with clear holes and crevices,as opposed to the other two rocks,with Galena being the most compact of the three.
5 Conclusions
The results of the present study are now summarized as follows:
1.We presented different methods for obtaining a variety of patterns in rocks by forging reaction-transport processes inside the rock medium (in-situ).
2.Liesegang-like patterns,i.e.,the formation of stripes were obtained in the rock with high enough porosity.Among the three rocks tested (galena,limestone,and pyrite),a stratification in parallel CaSO4zones was obtained only in the limestone rock,which has the highest porosity among the three (40.1% by volume).
3.The other obtained patterns (patches or random domains of deposits)are believed to also emerge from a nonlinear reaction–diffusion scenario.
4.Thein-situmethod eliminates the necessity of drawing analogies between experiments in gels and patterns observed in rocks.
Thus,in-situ,a minimum porosity of the rock appears to be a requirement for the diffusion front to propagate and generate band formation via an Ostwald cycle (Ostwald 1906) mechanism.It is to be noted here that a Liesegang pattern of bands is not necessarily observed in presently porous rocks alone,but on the contrary,overwhelmingly in hard and compact rocks.We propose here that band formation occurs at an early stage of porous texture,and is then followed by pore filling,clogging,and cementation(Böhm et al.2003;Tang and Hongyin 2017;Chagneau et al.2015).The rock porosity changes as a result of chemical reactions,and hence cementation determines the long-time evolution of the host rock (Chagneau et al.2015).The porous,uncompacted rock is mechanically stabilized and compacted by various cementation stages(Munnecke et al.1997),but in a way to preserve the original diffusion-precipitation pattern.The degree of cementation (or the cementation exponentm) is measured through the application of Archie’s law (Chagneau 2015;Archie 1942).
AcknowledgementsThis work was supported by a grant from the University Research Board (URB) of the American University of Beirut (AUB).All the X-ray diffractograms (XRD) and the SEM imaging were performed in the Kamal Shair Central Research Science Lab (CRSL) of the American University of Beirut.
Declarations
Conflicts of interestOn behalf of all authors,the corresponding author states that there is no conflict of interest.
- Acta Geochimica的其它文章
- The cooling models of Earth’s early mantle
- Petrology of lherzolite xenoliths of Hosséré Sédé volcano(Adamawa plateau,Ngaoundéré area,Cameroon)
- Distribution,risk evaluation,and source analysis of the heavy metals in the sediment deposition of the lower Shichuanhe River,Shaanxi,China
- Decoding the nature of interaction between felsic clasts and mafic magma in a subvolcanic magma chamber from amphibole–titanite transformation and chemistry
- Isotopic analysis based on terahertz spectrum
- Magma source and tectonic setting of the Dunde granite in the Western Tianshan: constraints from geochronology,geochemistry,and Sr–Nd–Hf isotopes