
Insights into the carbonization mechanism of bituminous coal-derived carbon materials for lithium-ion and sodium-ion batteries
2023-10-27 08:16TIANQingqingLIXiaomingXIELijingSUFangyuanYIZonglinDONGLiangCHENChengmeng
新型炭材料 2023年5期
TIAN Qing-qing, LI Xiao-ming, XIE Li-jing, SU Fang-yuan,YI Zong-lin, DONG Liang,*, CHEN Cheng-meng,*
(1. Key Laboratory of Coal Processing and Efficient Utilization, China University of Mining and Technology, Xuzhou 221116, China;2. CAS Key Laboratory of Carbon Materials, Institute of Coal Chemistry, Chinese Academy of Sciences, Taiyuan 030001, China;
3. School of Chemical Engineering & Technology, China University of Mining & Technology, Xuzhou 221116, China)
Abstract: Despite recent interest in the low-temperature carbonization of coal to prepare disordered carbon materials for the anodes of lithium-ion (LIBs) and sodium-ion batteries (SIBs), the carbonization mechanism is still poorly understood. We selected bituminous coal as the raw material and investigated the chemical, microcrystal, and pore structure changes during the carbonization process from coal to the resulting disordered carbon. These structural changes with temperature below 1 000 °C show an increase in both interlayer spacing (3.69-3.82 Å) and defect concentration (1.26-1.90), accompanied by the generation of a large amount of nano-microporous materials. These changes are attributed to the migration of the local carbon layer and the release of small molecules. Furthermore, a decrease in interlayer spacing and defect concentration occurs between 1 000 °C and 1 600 °C. In LIBs, samples carbonized at 1000 °C showed the best electrochemical performance, with a reversible capacity of 384 mAh g-1 at 0.1 C and excellent rate performance, maintaining 170 mAh g-1 at 5 C. In SIBs, samples carbonized at 1 200 °C had a reversible capacity of 270.1 mAh g-1 at 0.1 C and a high initial Coulombic efficiency of 86.8%. This study offers theoretical support for refining the preparation of carbon materials derived from coal.
Key words: Coal;Carbonization mechanism;Carbon materials;Lithium-ion batteries;Sodium-ion batteries
1 Introduction
Lithium-ion batteries (LIBs) and sodium-ion batteries (SIBs) have emerged as the primary energy storage devices for new energy vehicles due to their high energy density and efficiency[1-3]. Graphite has gradually developed into a commercial carbon anode material for LIBs thanks to its good electrical conductivity and stable layer structure. However, at high charge/discharge rates, graphite surfaces are susceptible to lithium dendrite formation, leading to the accumulation of lithium in large areas. This can result in internal short circuits and thermal runaway, posing risks to battery safety[4]. Furthermore, the problem of volume expansion (10%) of graphite may cause structural damage and decrease its cycling performance[5].When applied to SIBs, the narrow interlayer spacing of graphite materials hinders the relatively large size of sodium ions (1.02 Å). Meanwhile, it is difficult to form stable graphite intercalation compounds due to the weak interaction force between sodium ions and graphite layers[6-8]. Many non-graphitized carbons(hard and soft carbons) have shown great potential for use in LIBs and SIBs due to their large layer spacing,high defect concentration, and rich pore structure[9-10].However, non-graphitized carbon typically utilizes phenolic resin, starch, and coconut shell as carbonaceous precursors, which have a complicated preparation process and low carbon yield that still require improvement. It is still difficult to find anode materials with affordable raw ingredients and superior electrochemical characteristics to fulfill the demand for large-scale energy storage.
As one of the most important strategic minerals,coal plays a decisive role in energy security in China[11]. Currently, large quantities of coal are directly combusted to supply power, causing excess consumption and damage to the environment[12]. Efficient utilization of coal is urgently required for sustainable energy development. Owing to the high carbon residue and low price, coal is also widely used to prepare carbon materials such as graphite[13-14], activated carbons[15-16], and other functional carbon materials[17-20]. Because coal is a heterogeneous macromolecular material with a three-dimensional crosslinked network[21-22], carbon materials derived from it have abundant defects and micropores which serve as active sites and diffusion channels in electrochemical reactions, making them potential candidates for energy storage[23-24].
In recent years, researchers have conducted indepth studies on coal-derived carbon materials for LIBs and SIBs. Jia et al.[25]used electrospinning technology and post-annealing to embed ultrafine MoO3into coal-derived carbon nanofibers. The material has a large specific surface area (82.01 m2g-1) and pore volume (0.091 cm3g-1), which improves the lithium storage performance by effectively promoting the migration of ions and mitigating the volume expansion problem during lithium insertion. Belharouak et al.[26]used nitric acid to modify the coal char, resulting in materials with appropriate pore structures, defect concentration, and C=O functional groups. These structural features are favorable for ion diffusion and irreversible capacity reduction. Zhao et al.[27]altered the thermal conversion pathway by adding a pre-activation that produces many closed pores during carbonization to increase the plateau capacity, resulting in a reversible capacity of 308 mAh g-1and delivering a high-energy density. Recent studies in coal-derived carbon materials are focused on process exploration and regulation of the surface structure. However, the electrochemical properties of materials derived from coal greatly depend on their microcrystalline state and pore configuration, which are closely related to the carbonization process. Reports on the carbonization mechanism of coal-derived carbon materials, which is crucial for controllable preparation, including the formation of a carbon framework, generation of pore structure, modulation of interlayer spacing, and defect concentration, are lacking in the literature.
Herein, we selected low-rank bituminous coal as a carbonaceous precursor and utilized one-step carbonization to regulate the carbon layer structure and microcrystalline morphology, thereby achieving the preparation of coal-derived carbon materials with properties similar to hard carbon. Information on the changing parameters corresponding to chemical and microcrystalline structural evolution during carbonization was obtained through characterization tests. Subsequently, the carbonization mechanism of disordered carbon materials obtained from coal was deduced from the effect of the chemical structural evolution on the microstructure during carbonization at elevated temperatures. The structure-performance relationship between carbon materials and the electrochemical performance of LIBs and SIBs is also discussed. This study provides theoretical support for the refinement preparation of coal-derived carbon materials.
2 Experimental
2.1 Material preparation
Bituminous coal (denoted as RC) from Shendong was used as the starting material to produce coal-derived disordered carbon material. First, the RC was crushed, pulverized, and then sieved using a standard 200 mesh sieve. The mineral components were removed from the coal by treating them with HCl and HF at 60 °C. Subsequently, deionized water was used to wash the acid-treated coal until the solution reached neutrality to obtain ultralow-ash coal (denoted as CC). The proximate and ultimate analyses of RC and CC are presented in Table S1. The CC was subjected to pyrolysis under an argon atmosphere,with a heating rate of 2 °C min-1within the temperature range of 600-1600 °C. The sample was then isothermally held at the final temperature for 2 h before being cooled down to room temperature, yielding the products known as CC-T (where T stands for the pyrolysis temperature).
2.2 Material characterization
The thermogravimetric analysis and mass spectrometer (TG-MS, Pyris Diamond/OmniStar,PE/Pfeiffer Vacuum) were used to study the carbonization behaviors of coal. Fourier transform infrared spectroscopy (FTIR, Invenio S, Bruker) was used to gather data on the functional groups of materials. The elemental composition and oxygen configurations were analyzed by elemental analyzer (EA, Flash 2000) and X-ray photoelectron spectrometer (XPS,ESCALAB 250Xi, Thermo Scientific, K-alpha), respectively. High-resolution transmission electron microscopy (HR-TEM, F200X G2, FEI Talos) was utilized to collect the images for characterizing the lattice morphologies. To determine the crystal structure of materials, X-ray diffraction (XRD, MiniFlex600,Rigaku) with Cu-Ka radiation (λ=1.54 Å) and Raman spectroscopy (LabRAM HR Evolution, Horiba, 514 nm laser) were utilized. Brunauer-Emmett-Teller(BET) method through N2and CO2adsorption-desorption measurements (TriStar 3020 Ⅱ, Micromeritics)were used to calculate information on the pore structure. True density (Accupyc II 1340, Micromeritics)test and small angle X-ray scattering (SAXS, Xeuss 3.0, Xenocs) were used to investigate the structural characteristics of close-pores. The SSA of micropores(Smic) and mesopores (Smes) were determined byt-plot and Barret-Joyner-Halenda methods (BJH), respectively.
2.3 Electrochemical measurements
To evaluate the electrochemical properties of coal-derived carbon materials, the working electrodes of half-cells were fabricated by mixing the active material, Super P, carboxymethyl cellulose (CMC), and polymerized styrene butadiene rubber (SBR). With a weight ratio of 85∶8∶2∶5 for the LIBs electrode and 91∶2∶2∶5 for SIBs electrode. The prepared slurry was then pasted on the Cu foil and the surface mass density of active species was 4-5 mg cm-2. The electrochemical properties of materials were tested in CR2032 coin-type cells. 1.0 mol L-1LiPF6(EC/DMC/DEC=1∶1∶1 in volume) and 1.0 mol L-1NaClO4(EC/DEC=1∶1 in volume) were used as electrolytes for LIBs and SIBs, respectively. The charge/discharge tests and galvanostatic intermittent titration technique (GITT) were obtained through the CT-2001 LAND Cell test system in the voltage range of 0-2.0 V. Cyclic voltammetry tests (CV) were performed in the potential range of 0-2.0 V. Before testing, the cell was cycled three times at 0.1 C (1 C=300 mA g-1) using the LAND Cell test system to activate it. Electrochemical impedance spectroscopy (EIS) was performed at a frequency range of 100 kHz to 0.01 Hz. The CV and EIS measurements were carried out using the Bio-Logic VMP3 electrochemical workstation.
3 Results and discussion
3.1 Chemical structure evolution
To investigate the carbonization behavior of coal,the analytical test was performed using TG-MS under an argon atmosphere. As illustrated in Fig. 1a, 3 stages of the CC carbonization process can be distinguished by the TG-DTG curve. It can be observed from Fig. 1a and b that a significant weight loss occurs during the preheating stage at 25-130 °C, which is attributed to the desorption of free water, CO, and other adsorbed gases in CC[28]. The DTG curve in the temperature range of 130 to 800 °C demonstrates that the mass loss rate increases from 130 to 450 °C along with the release of large amounts of CO, CO2and H2O, and a small amount of CH4. This is probably the result of the destruction of many oxygen-containing functional groups and aliphatic carbon-carbon bonds[29-30]. The mass loss rate gradually decreases from 450 to 800 °C, accompanied by the formation of heat-resistant polycondensed aromatic structure and carbon skeleton. The sample weight remains stable above 800 °C, indicating the completion of large-scale structural variation of CC, and formation of a stable carbon skeleton.
Furthermore, elemental analysis can reveal differences in the composition of carbon-containing materials produced from coal, as summarized in Table S2. The results showed a gradual increase in the percentage of carbon in the entire system from 90.39%(CC-600) to 98.70% (CC-1600) (mass fraction), while the percentages of hydrogen, oxygen, nitrogen, and sulfur elements showed an overall decreasing trend.Combined with the TG-MS analysis, it is confirmed that this is a result of the release of unstable aliphatic hydrocarbon side chains in the molecular structure of coal in the form of small molecules after they are broken. The hydrogen/carbon (H/C) and oxygen/carbon (O/C) atomic ratios are shown in Fig. 1c, with both ratios decreasing sharply in the carbonization temperature interval below 600 °C and leveling off with increasing temperatures. The decrease in H/C and O/C atomic ratios is a result of the dehydrogenation reaction during pyrolysis and the decomposition of oxygen-containing functional groups in the macromolecular structure of coal, respectively. This suggests that coal undergoes a process of carbon atom enrichment and heteroatom removal during carbonization due to the instability of organic matter, a process similar to the upgrading of coal in nature[31].
FTIR was carried out to describe the variation in molecular structure and functional groups during carbonization (Fig. 1d). According to Ref.[32], the spectra are divided into 4 absorbance bands: aromatic groups(700-900 cm-1), oxygen-containing functional groups(900-1800 cm-1), aliphatic groups (2800-3000 cm-1),and hydrogen bonds (3100-3700 cm-1). The contents of the 4 groups decrease rapidly in the range of 25-600 °C but do not change significantly above 800 °C.These results indicate that the condensation reaction of hydroxyl groups, cleavage reaction of aliphatic side chains, and release of oxygen-containing functional groups have all occurred below 800 °C, which is consistent with the thermogravimetric result[30,33]. Furthermore, XPS measurements were performed to determine the proportion and types of oxygen species on the surface of the materials. As shown in Fig. S1a, the oxygen content drops from 13.4 at.% to 5.3 at.% in the range of 25-800 °C. While at 1 000 °C, the oxygen content increases to 6.1 at.% and then gradually decreases with increasing temperature. TG-MS tests revealed that the chemical structure of coal undergoes significant changes primarily during the carbonization process at temperatures below 800 °C. At this stage, the rate of deoxygenation exceeds the rate of decarbonization on the material surface, resulting in a dramatic decrease in the oxygen content. However,when the temperature exceeds 800 °C, the deoxygenation rate decreases compared to the decarbonization rate[34]. Therefore, the relative oxygen content on the surface of CC-1000 (6.1 at.%) is higher than that of CC-800 (5.3 at.%). As illustrated in Fig. 1e, the fitted results for the O1s spectra indicate the presence of 3 types of oxygen bonding states at binding energies(B.E.) of 534.8, 533.4 and 532.1 eV, corresponding to O—H, C—O and C=O, respectively[35]. Table 1 and Fig. S1b provide a summary of the quantitative analysis results for oxygen species. The content of C—Oand C=O decreases, while the change in O—H content is not significant in the range of 25-800 °C, suggesting that C—O and C=O are the primary forms of oxygen functional groups in coal-derived carbon materials.
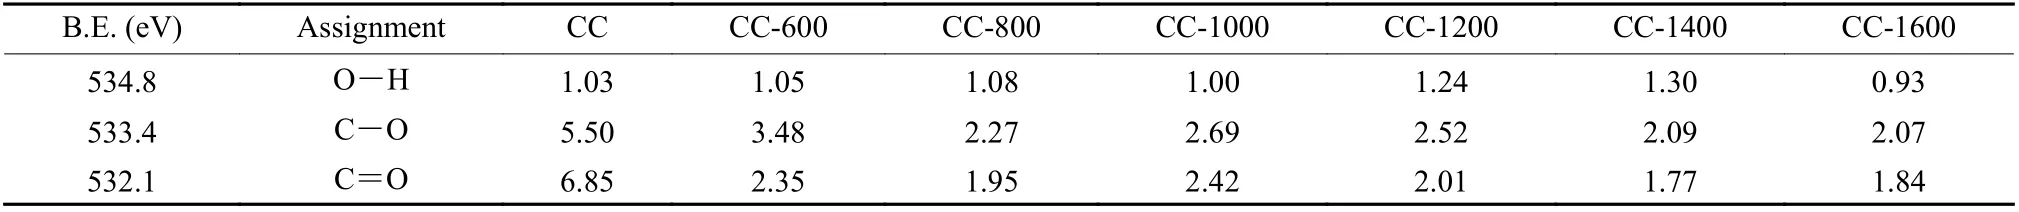
Table 1 The contents of O1s peaks of coal-derived disordered carbon materials
3.2 Microcrystalline structure evolution
To visually observe the lattice evolution, HRTEM tests were conducted. As shown in Fig. S2 and Fig. 2, CC, CC-600 and CC-800 exhibit a high degree of crystal structure disorder, and the diffraction rings in the SAED pattern indicate a typically non-crystalline structure. As the temperature increases, CC-1000 and CC-1200 display pseudo-graphitic domains consisting of small-size carbon layers with random orientations. CC-1400 and CC-1600 present a locally longrange ordered graphite-like structure. The structural transformation is illustrated in Fig. 2g. Furthermore,the correlation of SAED diffraction rings from diffused to sharp indicates a gradual increase in the structural order of coal-derived materials as the carbonization temperature rises.
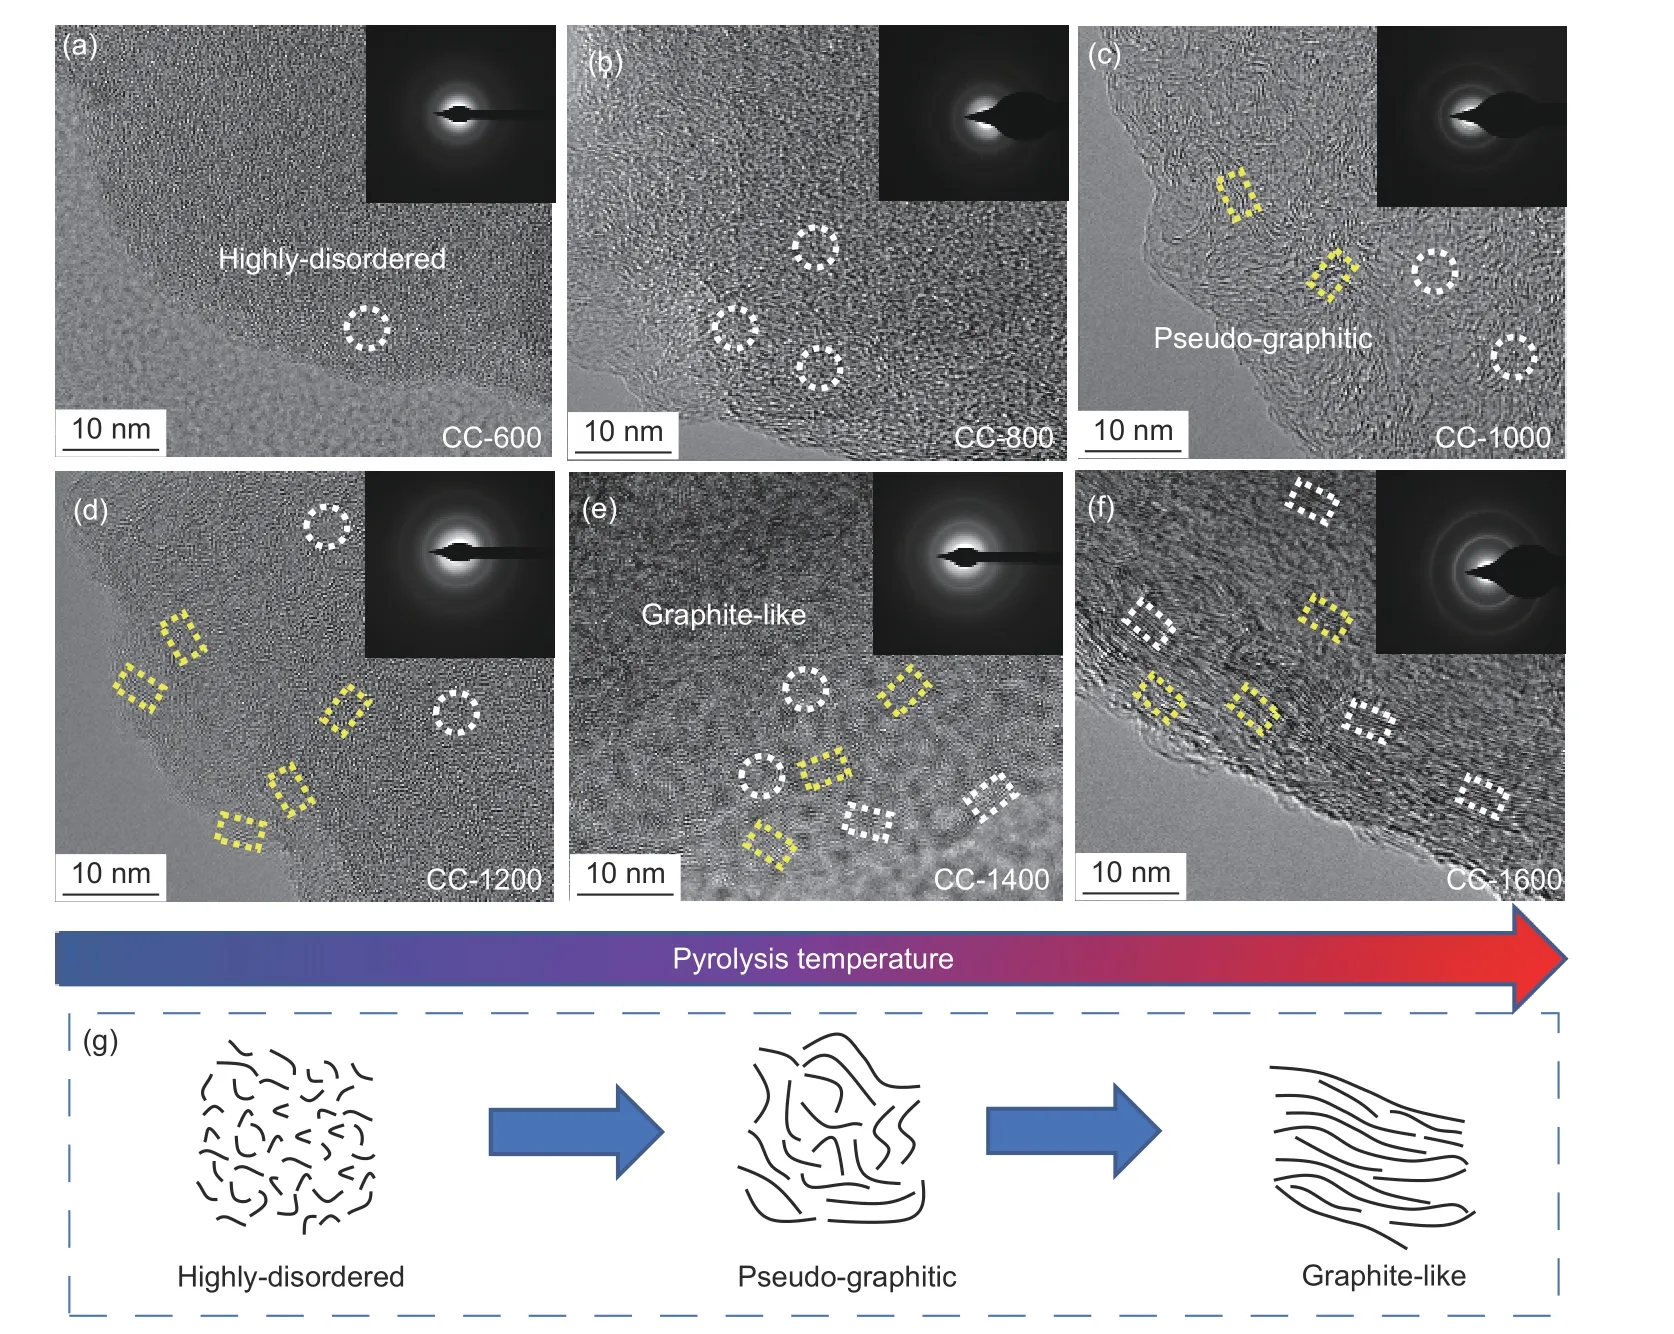
Fig. 2 (a-f) HR-TEM and SAED images of coal-derived disordered carbon materials. (g) Schematic illustration of the structural transformation from a highlydisordered state to a graphite-like structure
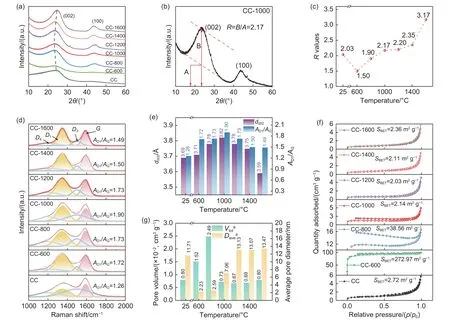
Fig. 3 (a) XRD patterns of CC and coal-derived disordered carbon materials. (b) Schematic definition of the parameter R. (c) Variation curve of R values of CC and coal-derived disordered carbon materials at different carbonization temperatures. (d) Fitted Raman spectra, (e) Values of d002 and AD1/AG, (f) N2 adsorption-desorption isotherms, and (g) total open pore volume and average pore diameter of CC and coal-derived disordered carbon materials
The crystal structure of the materials was revealed using XRD (Fig. 3a). In the XRD pattern,when temperatures exceed 800 °C, the carbon sample shows 2 broad peaks appearing at 23° and 43°, which correspond to the (002) and (100) lattice planes of the graphite structure, respectively[36]. This observation suggests that these prepared carbon products are amorphous carbon materials with low crystallinity.According to a previous study by Dahn et al.[37], the representation parameter (R) is calculated to compare the degree of carbon layer arrangement of amorphous carbon, which is dependent on the (002) peak (Fig. 3b and Fig. S3). A lowerR-value indicates that the carbon in the stacking direction of aromatic layers is more disordered[34]. As displayed in Fig. 3c, theRvalue first decreases sharply from 2.03 for CC to 1.50 for CC-600 due to the depolymerization of the initial carbon skeleton. Following that, as the carbonization temperature rises, theR-value of CC-1600 reaches 3.17, indicating a gradual stacking of graphene sheets into one or more parallel layers in the coal-derived carbons[38]. This observation aligns with the findings from HR-TEM. By employing the Bragg equation, the interlayer spacing (d002) is calculated and presented in Table 2. It is noteworthy that the depolymerization,growth, and reorganization of aromatic structural units in coal result in an increase ind002from 3.69 Å for CC to 3.82 Å for CC-1000. As the temperature further increases to 1 600 °C, the interlayer spacing rapidly decreases to 3.59 Å due to the orientation arrangement of carbon layers.
Further investigation into the evolution of carbon’s microcrystalline structure was conducted using Raman spectroscopy. All Raman spectra exhibit distinctiveDandGpeaks at 1 350 cm-1and 1 590 cm-1,respectively, which correspond to the disordered and sp2hybridized carbons[39], as illustrated in Fig. 3d.However, because the pyrolysis products are heterogeneous carbon materials, fitting and deconvolution of their Raman spectra are required to obtain more specific information[40]. The spectral curves are divided into 4 peaks located at 1 200 (D4), 1 340 (D1), 1 500(D3), and 1 580 cm-1(G)[32]. The intensity ratio ofD1toGbands (AD1/AG) reflects the defect concentration of disordered carbon[41]. As shown in Table 2, theAD1/AGincreases from 1.26 for CC to 1.90 for CC-1000 and then slightly decreases to 1.49 for CC-1600.Combined with the TG-MS analysis results, this phenomenon may be attributed to the release of small molecular substances, which result in the formation of numerous dangling carbon bonds. Due to their instability, these bonds recouple to form small carbon nanoplates, leading to carbon materials with a high defect concentration[42-44]. As the temperature exceeds 1 000 °C, theAD1/AGgradually decreases due to the reduction in heteroatom contents and the continuous repair of the microcrystalline structure with increasing the carbonization temperature, leading to an increase in the degree of graphitization[45]. Fig. 3e displays a comparison of thed002andAD1/AGof the materials obtained at various temperatures, and it shows a consistent trend for both parameters.
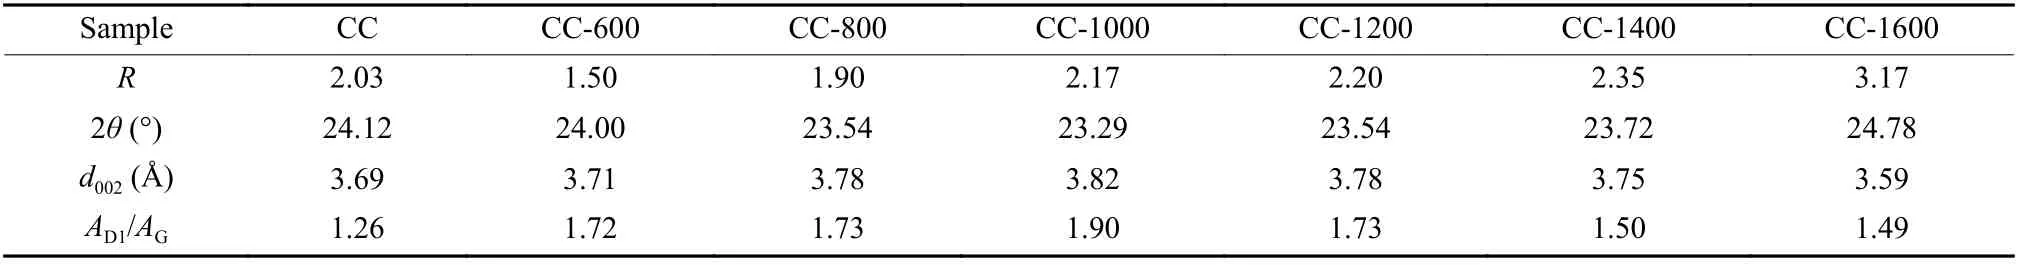
Table 2 Physical parameters of coal-derived disordered carbon materials
Next, the porosity characteristics of the coal-derived disordered carbon materials were measuredviaN2adsorption-desorption isotherm. The coal-derived carbon materials prepared below 1 000 °C exhibit a large hysteresis loop, as depicted in Fig. 3f. One possible explanation is that the formation of bottomnecked pores occurs due to pore wall collapse during this process, making N2desorption in these pores difficult[46]. By comparing the size of the hysteresis loop,it is observed that the hysteresis loop is alleviated and disappears with increasing carbonization temperature.The specific parameter information is outlined in Table 3. Interestingly, the total open pore volume(Vtota) increases rapidly from 0.008 0 cm3g-1for CC to 0.024 9 cm3g-1for CC-800 (Fig. 3g). As the temperature increases,Vtotadecreases instead to 0.006 7 cm3g-1for CC-1200. When the temperature reaches 1 600°C,Vtotaincreases to 0.008 0 cm3g-1for CC-1600.Meanwhile, the corresponding materials obtained in the 600-1000 °C range have a relatively small average pore diameter (Davea). Taken together, the above results indicate that the pore structure may evolve from an open-pore structure to an “ink bottle” shape pore, and eventually to an open-pore/closed-pore structure without a hysteresis loop[38]. The structural properties of close pores were investigated using SAXS and true density analysis. As shown in Fig.S4a, the broad peaks located around 0.1 Å-1indicate the presence of closed pores in the materials. The closed pores volume (Vclosepores) obtained from the results of the true density analysis was calculated using the following formula[34]:
where 2.26 g cm-3represents the ideal graphite density to approximately evaluate the volume of the carbon skeleton. As shown in Fig. S4b, the increasing trends ofVcloseporesin the 1200-1600 °C temperature range evidence the formation of closed pores.
The SSA of coal-derived materials is calculated using the BET method. As shown in Table 3, theSBETarapidly increases from 2.72 to 272.97 m2g-1below 600 °C, suggesting that the escape of small moleculesis beneficial to the formation of micropores[47]. Subsequently, theSBETadecreases significantly to 38.56 m2g-1for CC-800 and then changes little as the temperature increases further. Such a large change in thefurther verifies the collapse of pores during carbonization. Fig. S5 displays the pore size distribution,and the variation ofSmicandSmeswith carbonization temperature are listed in Table S3. In the CO2test system, theSBETcincreases below 800 °C, further demonstrating that ultra-micropores structures (pore diameter <1 nm) are created when nanobubbles escape from the surface. However, a decrease in theSBETcoccurs between 1 000 °C and 1 200 °C, indicating the collapse of pores once again. The net result is that the material obtained at 1 000 °C and 1 200 °C has relatively low amounts of microporous/mesoporous pores but abundant nanopores, which can provide storage space for Li/Na ions. Therefore, during the thermal transition, the molecular structure gradually stabilizes,and the microcrystalline structure is transformed from the original highly-disordered to graphite-like. Meanwhile, interlayer spacing and defect concentration first increase and then decrease. The pore structure characteristics of the materials obtained at different temperatures are distinctly different. In the following section a detailed analysis of the impact of these evolutionary mechanisms on the electrochemical performance of LIBs/SIBs is presented.
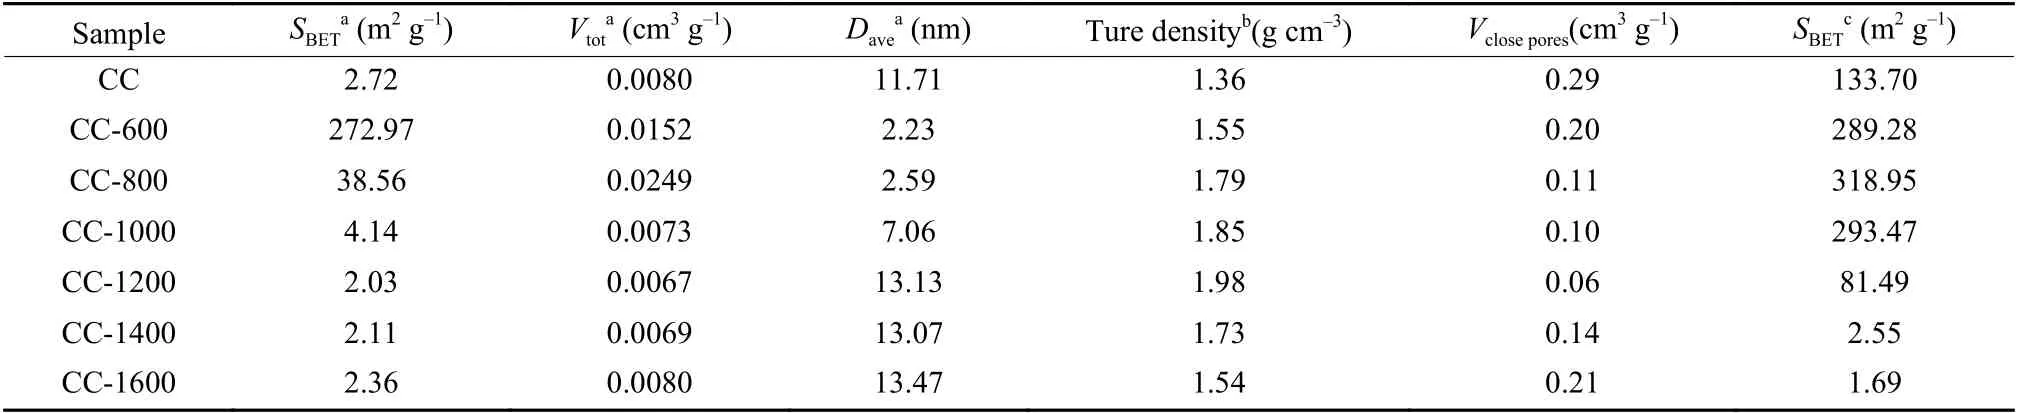
Table 3 Pore structure parameters of coal-derived disordered carbon materials
3.3 LIBs electrochemical properties
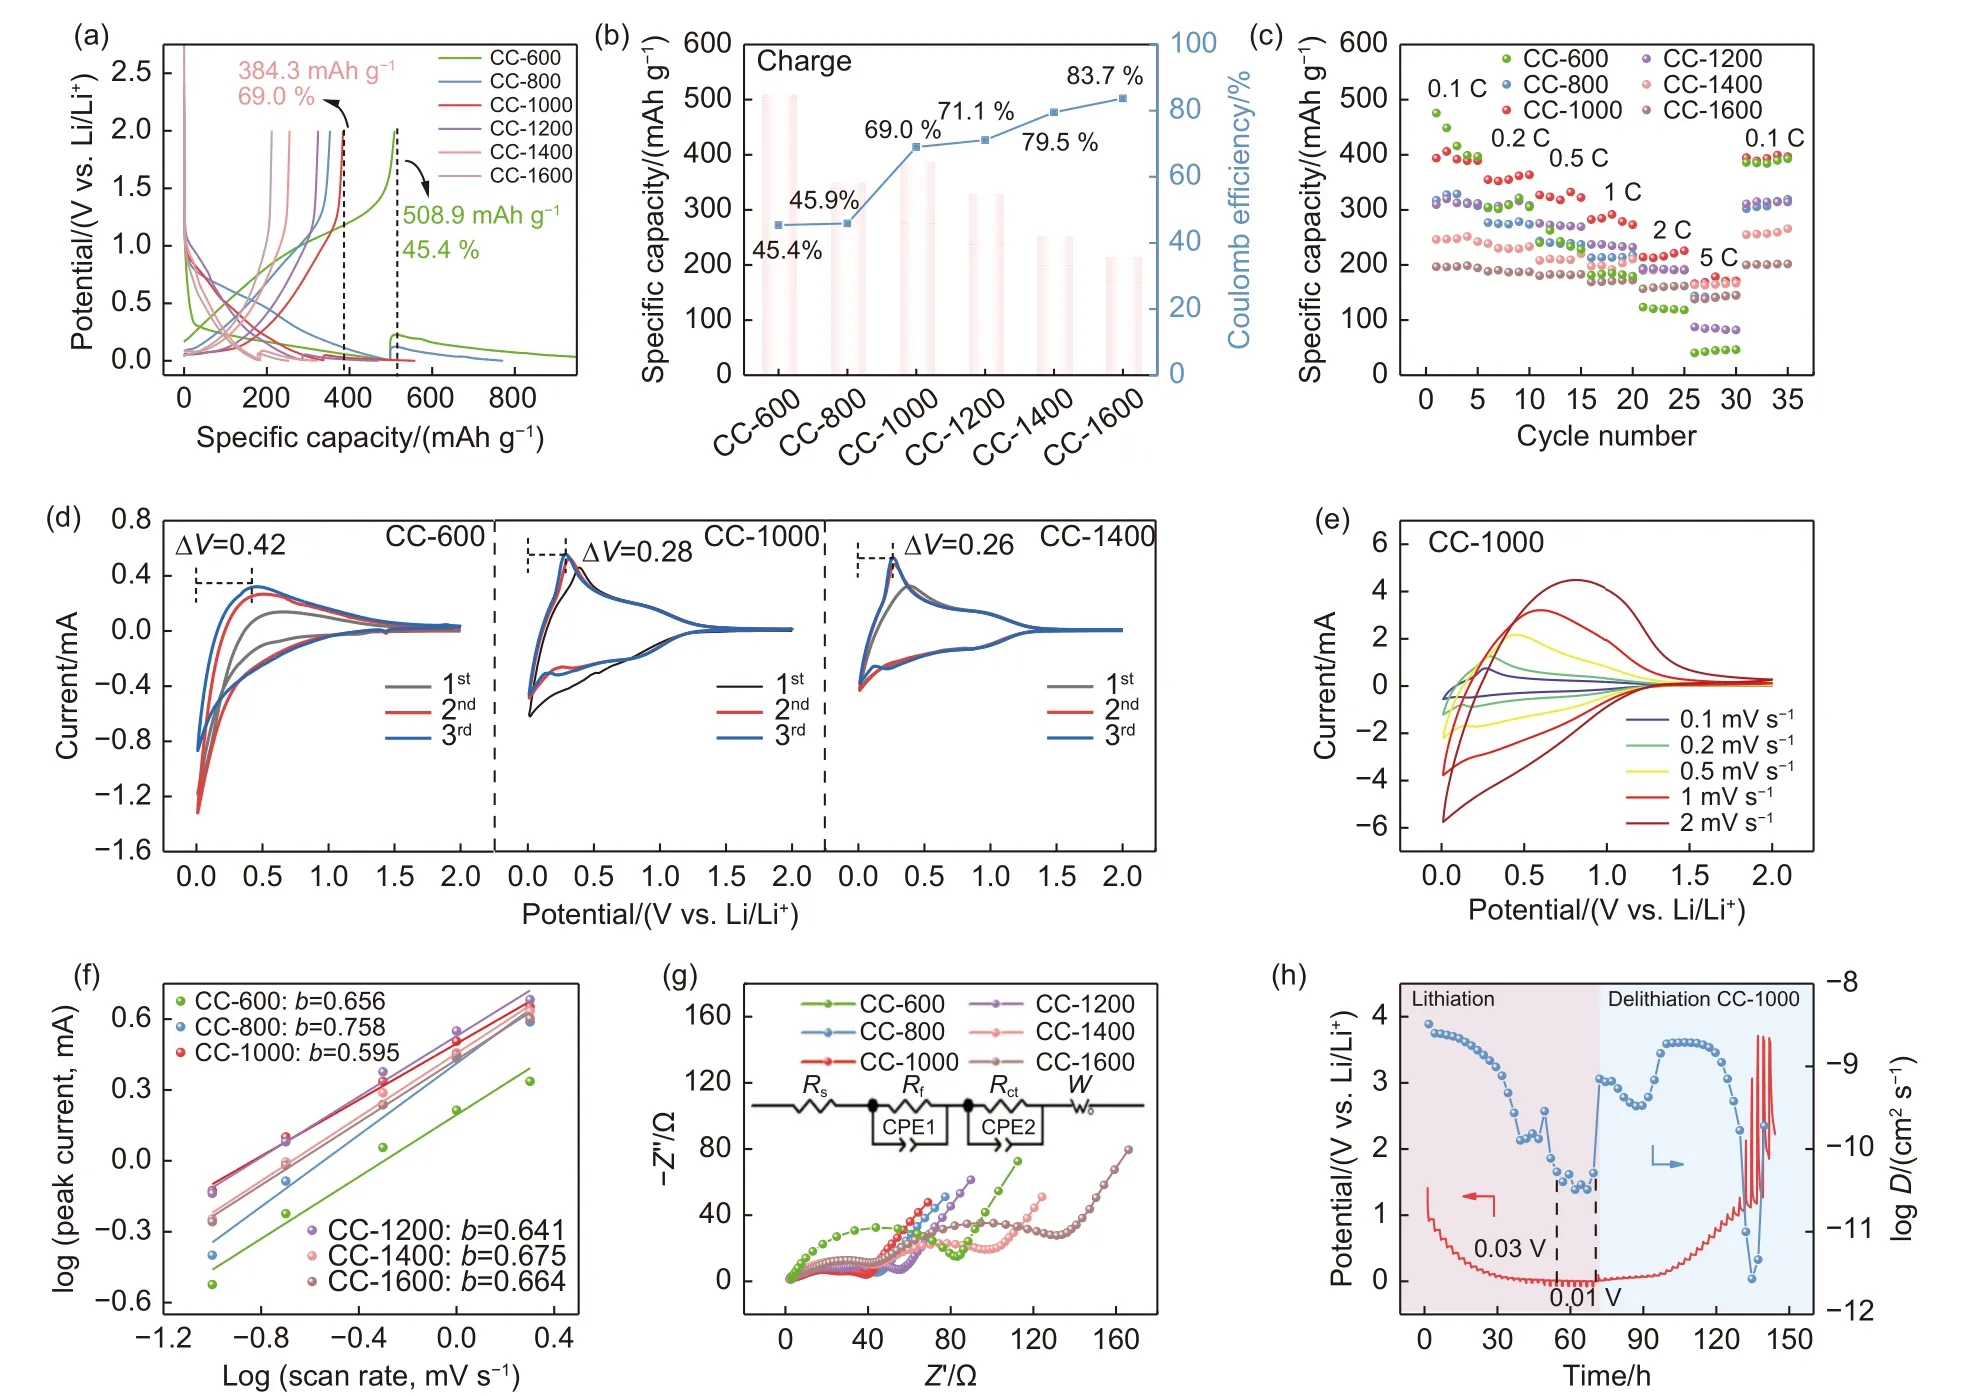
Fig. 4 (a) GCD curves at 0.1C, (b) Variation curve of specific capacity and ICE, and (c) Rate capacity at different current rates of coal-derived disordered carbon materials. (d) The three CV curves of CC-600, CC-1000 and CC-1400. (e) The CV curves at different rates of CC-1000. (f) A linear relationship between log (Peak Currents) and log (Sweep Rate), (g) Nyquist plots of the fresh cells of coal-derived disordered carbon materials. (h) GITT curves of the CC-1000 during the discharge/charge process in LIBs
The initial galvanostatic charge-discharge (GCD)profiles of the Li/CC-T half-cells at 0.1 C are displayed in Fig. 4a and Table S4. The data show that the CC-600 exhibits the highest reversible capacity (508.9 mAh g-1), but it has an extremely low initial Coulombic efficiency (ICE) of 45.4%. This is probably due to the high heteroatom content of CC-600, which provides many active sites for the insertion of lithium ions, resulting in a discharge capacity of 1 120.3 mAh g-1. However, due to the large SSA of the material (272.97 m2g-1), many lithium ions are irreversibly adsorbed. As the temperature rises from 600 to 800°C, the reversible capacity falls from 508.9 to 349.8 mAh g-1, probably due to a reduction in the lithium insertion active sites. Subsequently, a slight rise in reversible capacity is seen at 800-1000 °C, with CC-1000 reaching 384.3 mAh g-1. Therefore, the high reversible capacity of CC-1000 is attributed to the high defect concentration (1.90), which can act as active sites for lithium ion storage, thereby improving the reversible capacity of the material. Furthermore, the large interlayer spacing (3.82 Å) enables rapid insertion and extraction of lithium ions in the carbon skeleton[26]. Above 1 000 °C, there is a clear tendency for the reversible capacity to decrease, in contrast to the ICE, which gradually increases to 83.7% (CC-1600)with increasing temperature (Fig. 4b). The decrease in capacity may be attributed to the ordering of the carbon layer lattice, which hinders effective lithium ions insertion into the carbon layer. On the other hand, as the defect concentration gradually decreases, some lithium ions are no longer immobilized with disordered carbon, resulting in a subsequent increase in ICE[48].
Meanwhile, the charge/discharge profiles show that most of the reversible capacity of coal-derived disordered carbon materials originates from the slope region below 1 V, thus implying that the materials may exhibit satisfactory capacity at high current rates[37]. Fig. 4c demonstrates that the CC-1000 electrode exhibits minimal attenuation and still delivers 170 mAh g-1at 5 C. The capacity of CC-1000 is nearly restored when the current rate returns to 0.1 C,indicating excellent electrochemical reversibility. It is noteworthy that other CC-T materials also exhibit good capacity retention at high current densities, although their capacities are lower than that of CC-1000. This can be attributed to the presence of more heteroatoms and/or smaller interlayer spacing. Therefore, these results suggest that the carbonization process significantly affects the microcrystalline state and pore configuration of materials generated from coal,which will result in different electrochemical performances.
The kinetics of ion storage in the samples were analyzed using cyclic voltammetry (CV). Fig. 4d and Fig. S6 display the trends of the 3 cycles’ curves of coal-derived disordered carbon materials at 0.1 mV s-1after 3 turns of activation at 0.1 C. The voltage hysteresis of CC-1000 (ΔV=0.28 V) is significantly lower than that of CC-600 (ΔV=0.42 V), which contains a higher concentration of heteroatoms. As the carbonization temperature increases, the abundance of heteroatoms decreases, and the overlap of the CV curves increases. The above results suggest that materials prepared at carbonization temperatures above 1 000°C exhibit improved electrical reversibility during deintercalation at low voltages, attributed to their lower heteroatom content[49]. Furthermore, the presence and abundance of heteroatoms can significantly impact the lithium storage process in LIBs, leading to the generation of irreversible capacity even after 3 cycles of activation. Moreover, the distinct differences observed in the feature of the CV curves suggest a significant change in the microcrystalline structure during carbonization, transitioning from a highlydisordered state to a graphite-like structure, resulting in different storage behavior. The CV curves of the obtained materials at different scan rates are displayed in Fig. 4e and Fig. S7. Based on Eq. (B.1) in the Supporting Information, thebvalue is determined to evaluate the storage mechanism of lithium ions.The samples prepared at 600, 800, 1 000, 1 200,1 400 and 1 600 °C havebvalues of 0.656, 0.758,0.595, 0.641, 0.675 and 0.664, respectively (Fig. 4f).All the values between 0.5 and 1 suggest that the lithium ions are stored in coal-derived disordered carbon material by a combination of capacitive and diffusion control mechanisms. This composite storage behavior helps to reduce the polarization of the material at low voltages and improves the rate performance[50-51]. Notably, CC-1000 has the smallestbvalue, indicating that the lower heteroatom content and the presence of rich ultra-micropore structure in CC-1000 are beneficial for the diffusion process of lithium ions.
The EIS tests were conducted to elucidate the variations in the electrochemical kinetics of the material electrodes. The whole equivalent circuit for coalderived carbon materials is fitted by using the Z-view software (Fig. 4g), and the obtained parameters are summarized in Table S5. The internal resistance of the electrodes tends to decrease from 76.34 Ω for CC-600 to 38.17 Ω for CC-1000, and then increase to 127.25 Ω for CC-1600. These results indicate that the presence of pseudo-graphitic microcrystal clusters and ultra-micropores enhances electrical conductivity and facilitates rapid charge transfer, resulting in excellent rate performance[52]. The lithium ion diffusion kinetic of coal-derived disordered carbon materials was investigated by GITT (Fig. 4h and Fig. S8). These results show that the CC-1000 anode exhibits a plateau between 0.03 and 0.01 V, implying that pseudo-graphitic domains are more stable in the lithiation process at low voltages compared to other materials. In summary, coal-derived carbon materials prepared at 1 000 °C reveal good electrochemical performance in LIBs due to their abundant lithium insertion active sites and smooth ion diffusion channels.
3.4 SIBs electrochemical properties
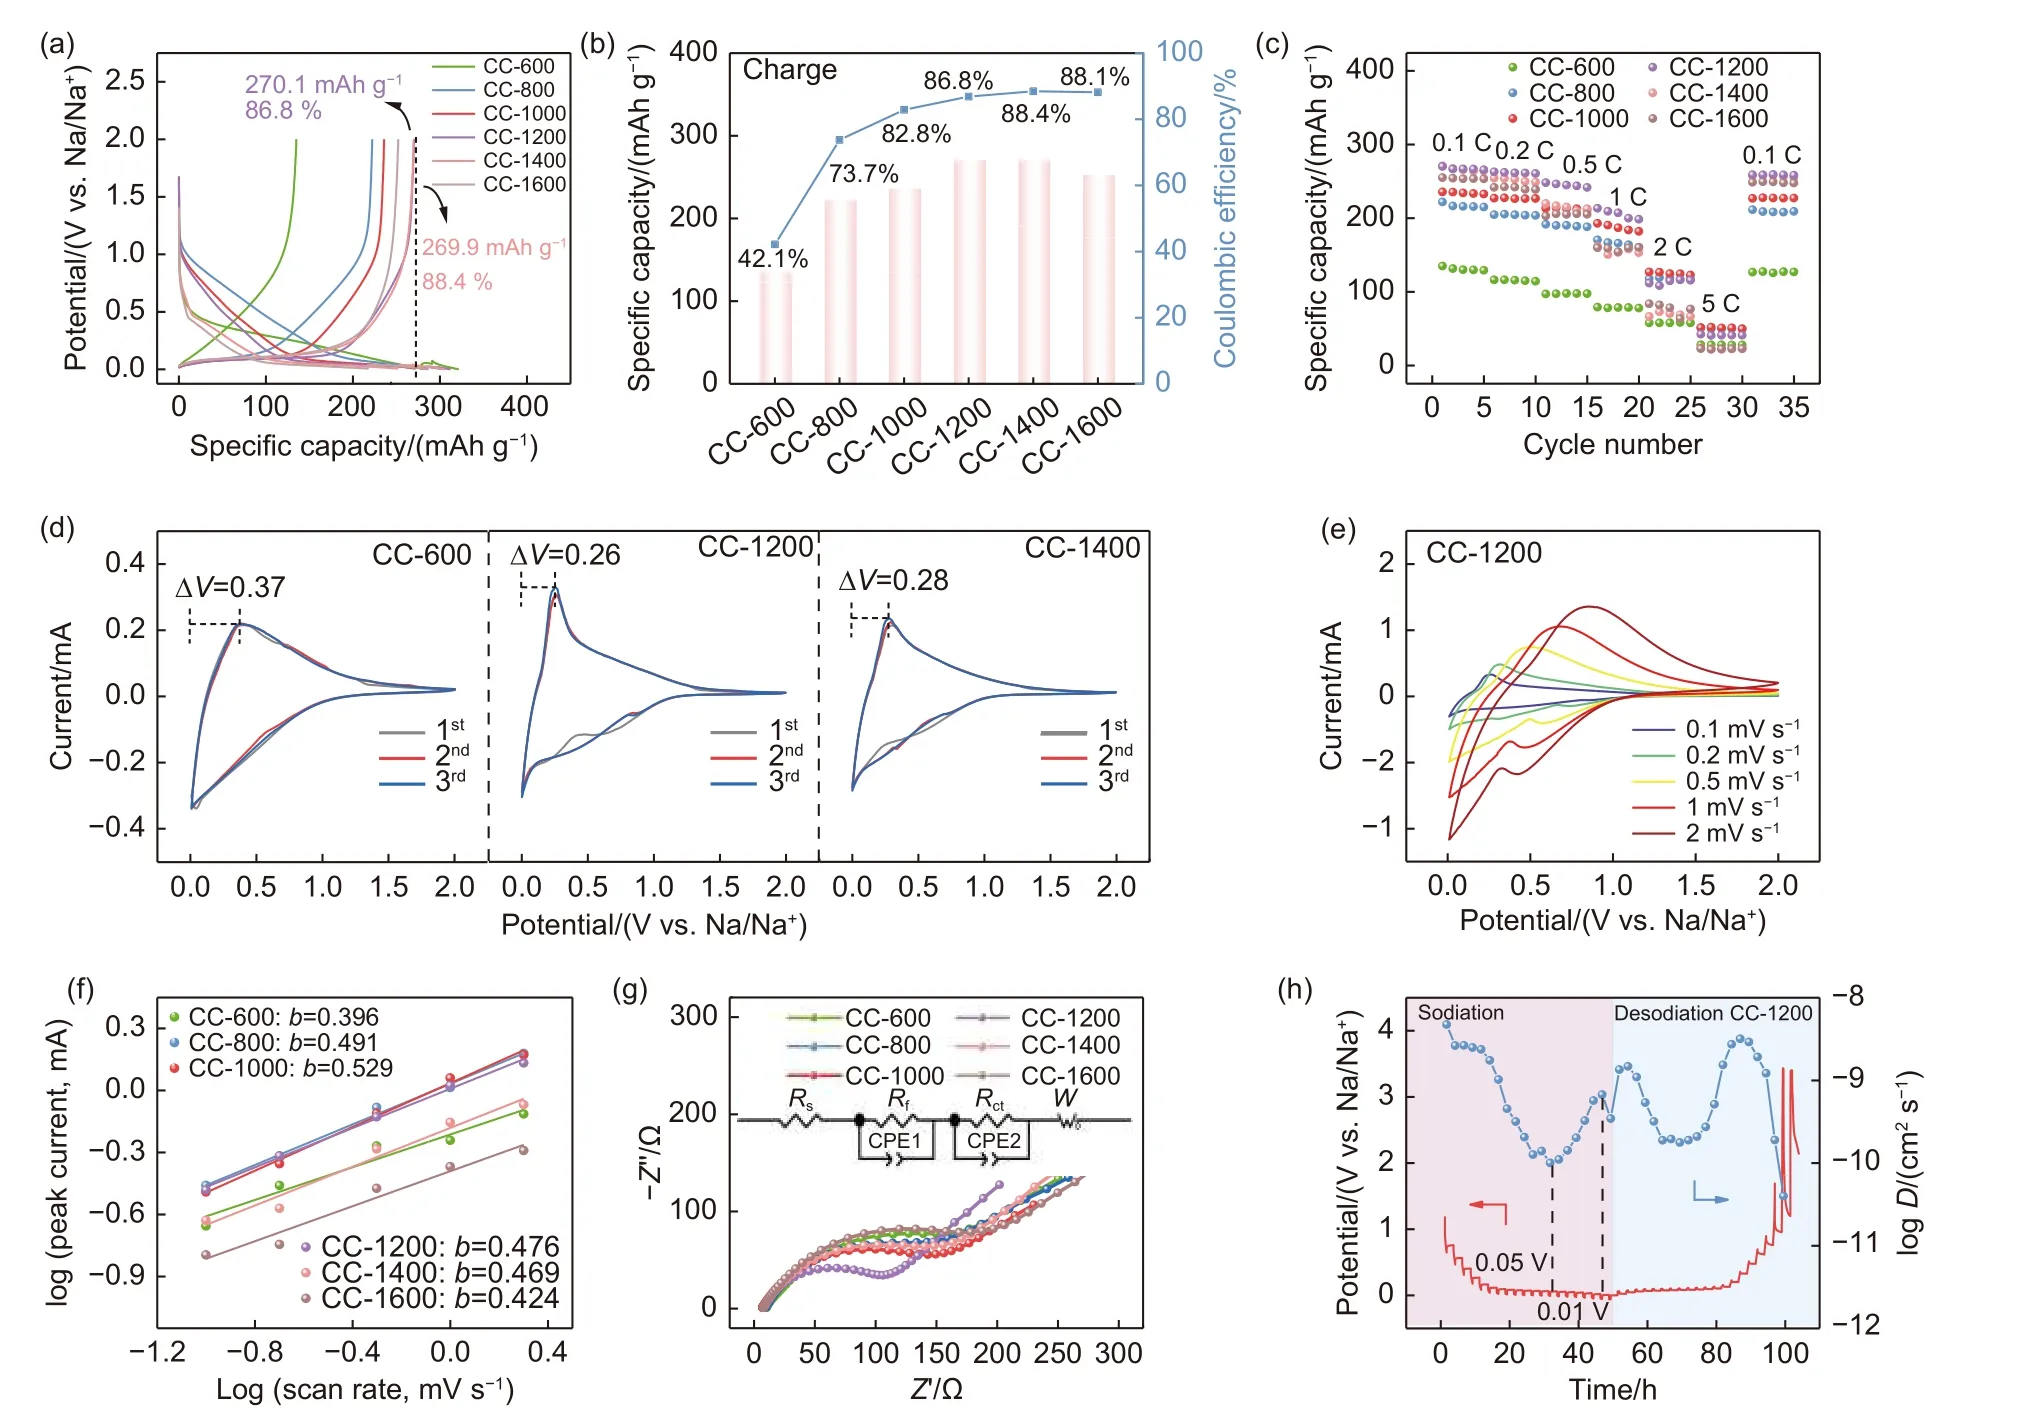
Fig. 5 (a) GCD curves at 0.1C, (b) Variation curve of specific capacity and ICE, and (c) Rate capacity at different current rates of coal-derived disordered carbon materials. (d) The 3 CV curves of CC-600, CC-1200 and CC-1400. (e) The CV curves at different rates of CC-1200. (f) A linear relationship between log(Peak Currents) and log (Sweep Rate), (g) Nyquist plots of the fresh cells of coal-derived disordered carbon materials.(h) GITT curves of the CC-1200 in SIBs
The electrochemical performance of the as-obtained carbon materials in SIBs was evaluated using a similar procedure as that of LIBs. As seen in Fig. 5a and b, the capacities of the obtained material at 0.1 C are 135.0, 222.2, 235.8, 270.1, 269.9 and 252.1 mAh g-1, respectively. These charge capacities correspond to ICE of 42.1%, 73.7%, 82.8%, 86.8%, 88.4%and 88.1%. The specific parameter information is summarized in Table S6. CC-600, which exhibits the maximum reversible capacity in LIBs, shows the lowest reversible capacity and ICE when applied to SIBs.The results show that a large SSA leads to the irreversible insertion of sodium ions. Meanwhile, the heteroatoms are unable to act as active sites during the sodiation process. CC-1200 and CC-1400 exhibit very close capacities of about 270 mAh g-1. It is attributed to their similar short-range ordered microcrystalline state and pore configuration. However, as the carbonization temperature is further increased, a transformation from pseudo-graphitic domains to regularly arranged graphite-like domains is promoted, which adversely affects the specific capacity and increases the energy barrier for sodium ion diffusion. Meanwhile,the gradually decreasing interlayer spacing is also unfavorable for the insertion/extraction of sodium ions,resulting in a lower capacity for CC-1600 compared to CC-1400[53]. The rate performance of the SIBs employing the obtained materials at different current rates are shown in Fig. 5c. CC-1200 displays a higher reversible capacity when the current rate is reverted to 0.1 C, demonstrating its superior kinetic performance.
To assess the kinetics of sodium storage, the 3 CV curves at a scan rate of 0.1 mV s-1for SIBs are shown in Fig. 5d and Fig. S9. For sodium ion storage,CC-600 (ΔV=0.37 V) still exhibits a large voltage hysteresis, while the value of ΔVtends to be consistent after carbonization at 800 °C. These results imply that a carbonization temperature of at least 800 °C is required to achieve better deintercalation reversibility of sodium ions at low voltages. Additionally, the high overlap of the CV curves measured after cell activation in SIBs indicates that stable SEI films can be formed during the activation process, regardless of the abundance of heteroatoms in the material. This suggests that the presence of heteroatoms does not impact the reversibility of SIBs. Fig. 5e and Fig. S10 display CV curves for electrodes at varying sweep rates.For the materials obtained from 600 to 1 600 °C, the values of the constantbare 0.396, 0.491, 0.529,0.476, 0.469 and 0.424, respectively (Fig. 5f). This indicates that the storage of sodium ions in CC-T is dominated by diffusion control. EIS testing results are displayed in Fig. 5g and Table S7. The CC-1200 exhibits the smallest internal resistance (88.73 Ω), indicating better dynamic properties. Moreover, GITT measurements were conducted to analyze the ion diffusion kinetics. As shown in Fig. 5h, the sodium ion diffusion coefficients (DNa+) of CC-1200 increase during sodiation at 0.05-0.01 V, which could be caused by pore filling with Na clusters[54]. Therefore, CC-1200, with its pseudo-graphitic domain and the lowest internal impedance, is particularly advantageous for sodium ion storage at low voltages through diffusion-controlled intercalation behavior. In summary,coal-derived carbon materials obtained at 1 200 °C show good electrochemical performance in SIBs due to their suitable sodium storage microcrystal morphology and smooth ion diffusion channels.
3.5 Carbonization mechanism and structure-performance relationship
Combined with the aforementioned results, a possible mechanism of coal carbonization is proposed.The microstructure and performance of coal-derived carbon in lithium/sodium storage are correlated, as shown in Fig. 6. The carbonization process can be divided into 2 stages based on the different crystal forms of the microcrystalline structure. Stage I corresponds to the formation of a disordered region (below 1 000 °C). During this stage, the initial aromatic structural units in coal undergo fragmentation, causing the carbon layer structure to undergo movement driven by thermodynamics, thus leading to an expansion of the interlayer spacing. Unstable side chains and functional groups at the edge are released as small molecular substances. Dangling carbon bonds generated during this process are recombined, resulting in an increase in the defect concentration within the materials. During the release of these substances, pore structures are formed on the surface. However, the collapse of these pore structures leads to the disappearance of micropores and mesopores at 1 000 °C. Stage II corresponds to the turbulent-disordered region (1000-1600°C). Owing to the orientation arrangement of the carbon layers, the interlayer spacing gradually decreases and arranges in a more orderly manner when the temperature further increases. Meanwhile, high temperatures facilitate the repair of microcrystals, leading to a reduction in the defect concentration within the materials. In summary, the carbonization of coal is a process of interaction between the disordered structures that are produced by the fracture of the carbon skeleton and the release of small molecule substances, and the ordered structures that are produced by graphitization.
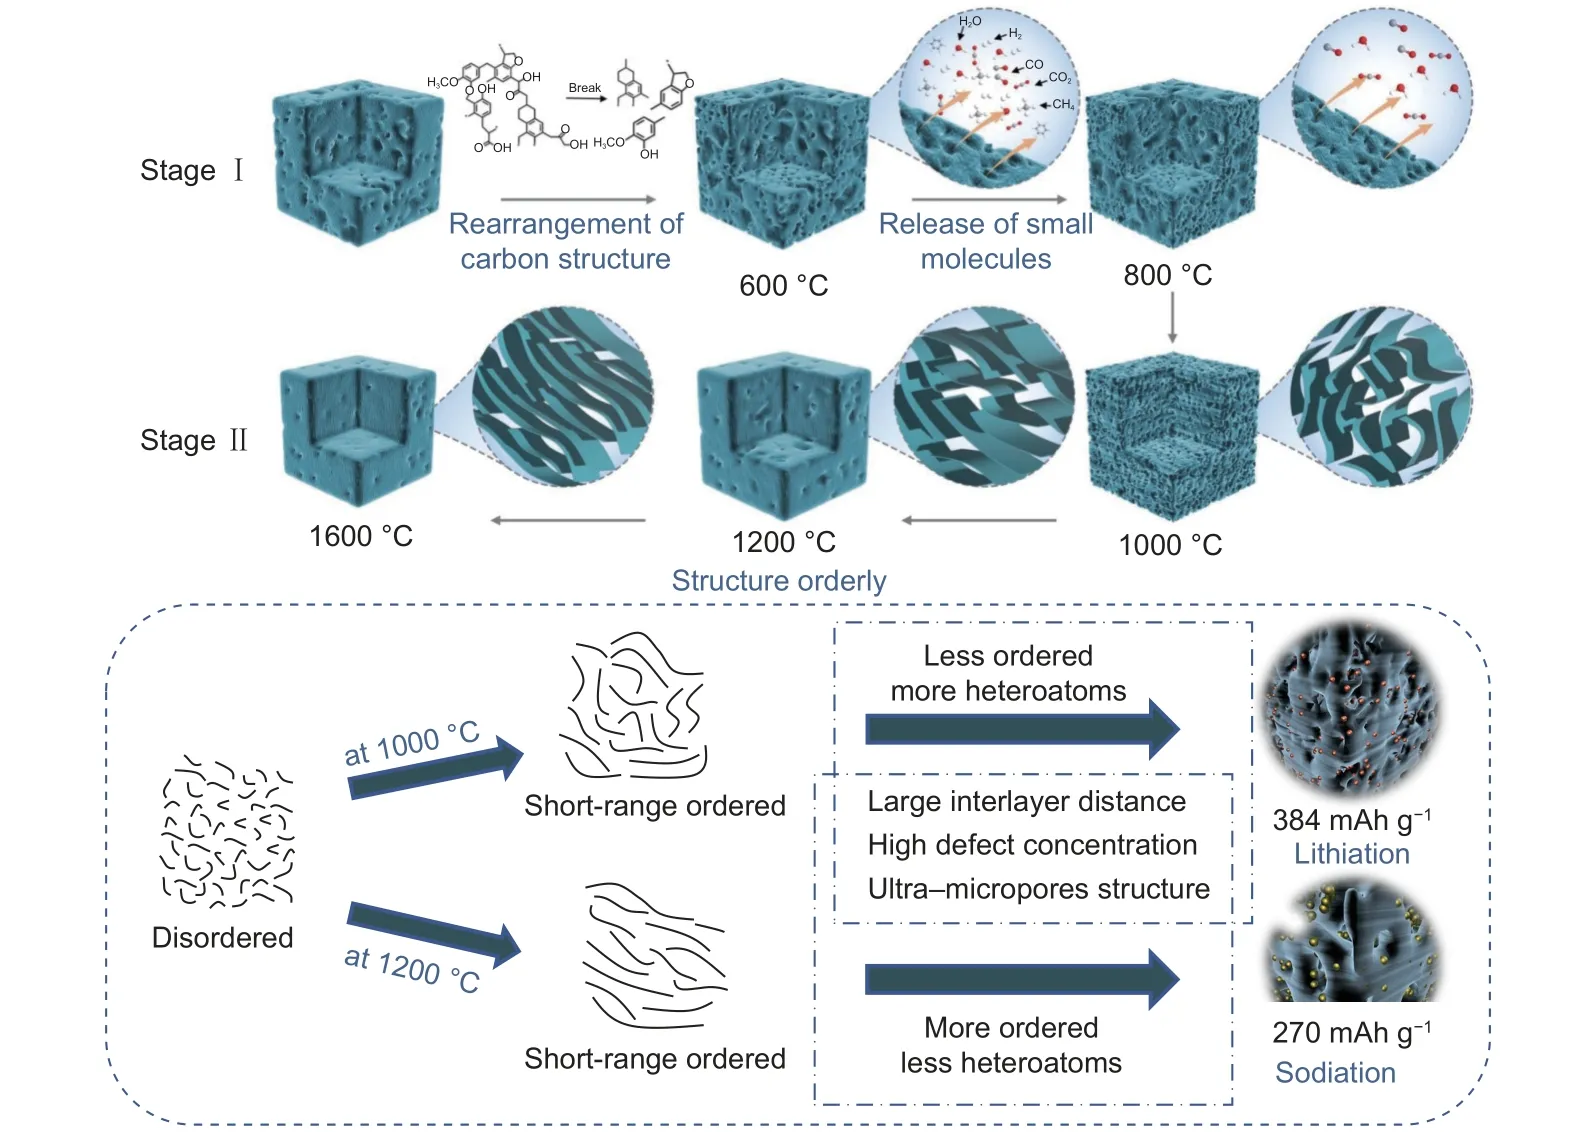
Fig. 6 Possible carbonization mechanism of coal and the correlated structure-performance relationship in LIBs and SIBs
The reasons for the improved Li/Na storage performance of the CC-1000 and CC-1200 can be summarized as follows: (1) The presence of pseudographitic domains facilitates the conduction of both electrons and ions, contributing to the improved rate performance of the materials. (2) The large layer spacing can alleviate the volume expansion during ion insertion, resulting in good structural stability. (3) The high defect concentration can provide active sites for ion insertion, thereby increasing the reversible capacity. (4) Ultra-micropores provide both storage locations for ions and pathways for diffusion, thereby accelerating the kinetic properties. (5) Heteroatoms can be exploited as active sites in LIBs to increase the reversible capacity of the material, but they hardly play a role in SIBs.
4 Conclusions
Here, we have proposed the mechanism underlying carbonization of bituminous coal suitable for preparing carbon anodes of LIBs and SIBs by investigating the structural evolution of coal with temperature during carbonization. In the first stage (below 1 000°C), the structure of coal is affected by the fracture of the carbon skeleton and release of small molecular substances, which increase the interlayer spacing and defect concentration; thereby generating ultra-micropores. In the second stage (1000-1600 °C), the crystal lattice is gradually repaired owing to the directional arrangement of carbon layers, resulting in a decrease in interlayer spacing and defect concentration. At carbonization temperatures of 1000-1200 °C, coal-derived disordered carbon materials exhibited rich pseudo-graphitic domains, with larger interlayer spacing (3.78-3.82 Å), higher defect concentration (1.73-1.90), and abundant nano-microporous structures. A short-range ordered structure with a large interlayer spacing is conducive to the effective transfer of ions and electrons. High defect concentration and ultra-microporous structure provide more active sites and migration paths for ions. In addition, materials with a higher heteroatom content are more suitable for application in LIBs, whereas they are more suitable for SIBs. This work provides insights into the structural transformation mechanism of bituminous coal to carbon materials, which is helpful for the controllable preparation of carbon anodes for LIBs and SIBs from coal.
Acknowledgements
This work was supported by the Natural Science Basic Research Program of Shanxi (2019JLZ-10), the National Natural Science Foundation of China(22179139), Fundamental Research Program of Shanxi Province (20210302123008), Fundamental Research Program of Shanxi Province(20210302124101), the Key Research and Development (R&D) Projects of Shanxi Province(2022ZDYF028). The authors would like to thank Zhenyu Duan from Shiyanjia Lab(www.shiyanjia.com) for the XPS analysis.
Declaration of competing interest
The authors declare that they have no known competing financial interests or personal relationships that could have appeared to influence the work reported in this paper.
Credit authorship contribution statement
Qing-qing Tian: Investigation, Data curation,Writing-original draft, Writing-review & editing.Xiao-ming Li: Investigation, Formal analysis, Methodology. Li-jing Xie: Investigation, Formal analysis,Writing-review & editing. Fang-yuan Su: Investigation, Formal analysis, Writing-review & editing.Zong-lin Yi: Writing-review & editing. Liang Dong:Supervision, Project administration, Conceptualization. Cheng-meng Chen: Conceptualization, Project administration, Supervision and Funding acquisition.
Data availability statement
The data that support the findings of this study are openly available in Science Data Bank at https://cstr.cn/31253.11.sciencedb.08875 or https://doi.org/10.57760/sciencedb.08875.

- 新型炭材料的其它文章
- Development of biochar electrode materials for capacitive deionization: preparation, performance, regeneration and other challenges
- Highly efficient Co—N—C electrocatalysts with a porous structure for the oxygen reduction reaction
- Reversible surface modification of PAN-based carbon fibers by a ferrocene-based surfactant
- Recent advances in 3D interconnected carbon/metal high thermal conductivity composites
- Synthesis and electrochemical properties of nano-Si/C composite anodes for lithium-ion batteries
- Large-scale synthesis of 3D ordered microporous carbon at low temperature using cobalt ions exchanged zeolite Y as a template