
Urine biomarkers discovery by metabolomics and machine learning for Parkinson’s disease diagnoses
2023-11-18 09:50XioxioWngXinrnHoJiYnJiXuDnnHuFnfnJiTingZngFuyuWngBolunWngJihngFngJingJiHmiLunYnjunHongYnhoZhngJinyoChnMinLiZhuYngDououZhngWnlnLiuXioongCiZongwiCi
Chinese Chemical Letters 2023年10期
Xioxio Wng, Xinrn Ho, Ji Yn, Ji Xu, Dnn Hu, Fnfn Ji, Ting Zng,Fuyu Wng, Bolun Wng, Jihng Fng, Jing Ji, Hmi Lun, Ynjun Hong,Ynho Zhng, Jinyo Chn, Min Li, Zhu Yng, Douou Zhng,*, Wnln Liu,*,Xioong Ci,*, Zongwi Ci,*
a State Key Laboratory of Environmental and Biological Analysis, Department of Chemistry, Hong Kong Baptist University, Hong Kong, China
b Department of Neurosurgery, Shenzhen Key Laboratory of Neurosurgery, the First Affiliated Hospital of Shenzhen University, Shenzhen Second People’s Hospital, Shenzhen 518035, China
c The Central Laboratory, the First Affiliated Hospital of Shenzhen University, Shenzhen Second People’s Hospital, Shenzhen 518035, China
d Department of Nutrition, Food Safety and Toxicology, West China School of Public Health, Sichuan University, Chengdu 610041, China
e Mr. and Mrs. Ko Chi Ming Centre for Parkinson’s Disease Research, School of Chinese Medicine, Hong Kong Baptist University, Hong Kong, China
Keywords:Parkinson’s disease High-resolution mass spectrometry Biomarker Metabolomic Machine learning
ABSTRACT Parkinson’s disease (PD) is a complex neurological disorder that typically worsens with age.A wide range of pathologies makes PD a very heterogeneous condition, and there are currently no reliable diagnostic tests for this disease.The application of metabolomics to the study of PD has the potential to identify disease biomarkers through the systematic evaluation of metabolites.In this study, urine metabolic profiles of 215 urine samples from 104 PD patients and 111 healthy individuals were assessed based on liquid chromatography-mass spectrometry.The urine metabolic profile was first evaluated with partial leastsquares discriminant analysis, and then we integrated the metabolomic data with ensemble machine learning techniques using the voting strategy to achieve better predictive performance.A combination of 8-metabolite predictive panel performed well with an accuracy of over 90.7%.Compared to control subjects, PD patients had higher levels of 3-methoxytyramine, N-acetyl-L-tyrosine, orotic acid, uric acid,vanillic acid, and xanthine, and lower levels of 3,3-dimethylglutaric acid and imidazolelactic acid in their urine.The multi-metabolite prediction model developed in this study can serve as an initial point for future clinical studies.
As a progressive brain disease related to aging, Parkinson’s disease (PD) is characterized by the neuronal death within the substantia nigra that results in a combination of movement disorder and non-motor symptoms [1,2].A global estimate shows that the prevalence of disability and death due to PD is rising faster worldwide than for any other neurological condition [3].PD is diagnosed clinically based on motor symptoms associated with loss of nigrostriatal dopaminergic neurons late in the disease process[4].It is urgent to find and validate biomarkers for PD to improve clinical assessment and management.Metabolomics has emerged in recent years as an effective and promising technique for identifying biomarkers or "metabolic fingerprints" associated with PD at different stages.Basically, this technique involves profiling the metabolites in various body fluids such as serum, plasma, cerebrospinal fluid or urine [5].Urine, as an ideal source of information for metabolic characterization of PD, can be utilized to quantify several hundreds of metabolites, including central metabolism,xenobiotics, microbiota metabolites, and nutrition derivatives[6–8].
Metabolomics has increasingly been applied to clinical research over recent years, however, such high-dimensional data remains challengeable to conventional statistical methods especially when the number of profiled metabolites and clinical events are imbalanced seriously [9–12].Machine learning techniques have emerged as an effective tool to extract information from the vast pool of high-dimensional data, and thereby were employed to metabolomics data to develop clinical prediction models for biomarker discovery and validation [13,14].
Herein, we performed integrative liquid chromatography-mass spectrometry (LC-MS) based analysis and machine learning techniques to investigate urinary metabolic characteristics and screen diagnostic biomarkers associated with PD with 215 urine samples.To achieve better predictive performance, we developed a set of prediction models that use a combination of ensemble-based methods.These methods include partial least-squares discriminant analysis (PLS-DA), random forest (RF), extreme gradient boosting(XGBoost), least absolute shrinkage and selection operator (LASSO),and Ridge regression.Voting strategy was then used to combine multiple models’ performance to determine the final metabolic prediction pattern for distinguishing PD patients from healthy individuals.Finally, based on accuracy and area under the curve(AUC), a prediction panel composed of eight metabolites was identified with high performance in discriminating patients with PD.By incorporating machine learning techniques into LC-MS-based urine analysis, it may be possible to improve the diagnosis of PD,which may facilitate further research into the disease in the near future.
There were a total of 215 participants involved in this study;104 were diagnosed with PD and 111 served as healthy controls.We included PD patients who met the clinical diagnostic criteria prescribed by United Kingdom Parkinson’s Disease Brain Bank(UKPDBB).All participants in this study gave written consent before participating in this study.Fig.1A shows the male and female proportion in PD and control groups.There were more male participants in the PD group than female participants, which is consistent with the prevalence rate of PD being 1.4–1.5 times higher in the male population than in the female population [15–17].Fig.1B shows similar age profiles between PD and healthy controls with average ages at 59.43±12.15 years and 57.26±9.15 years, respectively.The two-tailed Mann-WhitneyUtest demonstrated that the gender and age distribution of PD patients and control subjects was not significantly different withpvalue at 0.2107 and 0.2419,respectively.The average disease duration among the PD patients was 8.34±5.52 years, and the Hoehn-Yahr (H-Y) stages of the PD patients was an average of 2.73±0.73.
The urine samples that were collected from 104 patients with PD and 111 healthy individuals were precipitated with 100 μL of methanol, and then centrifuged at a speed of 14,000gfor 10 min at a temperature of 4°C.An analysis of the supernatants was conducted for metabolite profiles on a Q-Exactive Orbitrap-focus LCMS/MS system (Thermo Scientific).Periodic quality control (QC)samples, PD patients, and healthy individuals’urine samples were conducted to ensure system stability and high-quality data.QC samples were generated by pooling equal amounts of PD patients and control urine sample.D3-creatinine and 4-Cl-phenylalanine were used as the internal standards.A high-resolution full scan mode was used in the mass spectrometer (35,000-mass resolution), followed by data-dependent acquisition (DDA)-based MS/MS scans of the top 5 abundant precursors.The Supporting Information provides details of the chromatographic and mass spectrometric conditions.The alignment of nontargeted metabolic profiles’peak acquisition and retention times was performed using Metabolite Identification and Dysregulated Network Analysis software (MetDNA, v 1.1.2) [18].Based on the MS data obtained, the metabolite was identified using the Compound Discoverer software (version 2.1, Thermo Scientific), which can automatically align peaks, extract MS, and generate consensus MS/MS spectra.The metabolite annotation was carried out using the public mass spectral database, mzCloud, in which the monoisotopic precursor masses of the metabolites were matched with their relative MS/MS spectra (mass tolerance<5 ppm).To correct the signal and integrate the metabolomic data, the Quality Control Robust Loess Signal Correction (QC-RLSC) algorithm and the ratio of D3-creatinine/creatinine were used.The relative standard deviation (RSD) values for QC samples were set at 30% to ensure the repeatability of metabolomics data.The filtered matrix was used to perform both univariate and multivariate analyses.A total of 6909 and 5633 metabolic characteristics were extracted from urine metabolic profiles in positive and negative ionization modes, respectively.A clear cluster differentiation was observed between PD patients’metabolic profiles and those of the control groups,as shown by the PLS-DA score plot shown in Fig.1C, indicating metabolic perturbation occurring within PD patients.The permutation test is shown in Fig.S1 (Supporting information).Twentyseven differentially expressed metabolites (16 increased and 11 decreased) were identified between the PD patients and the controls based on the criteria ofP <0.05 and fold change (FC)<0.8 or>1.2 (Fig.1D volcano plot) (Table S1 in Supporting information).
The application of machine learning in untargeted metabolomics is becoming increasingly prevalent due to its advantages in reducing the dimensions of metabolomic datasets[19].In addition, an ensemble-based approach for the discovery of biomarkers in metabolomics data analysis has the potential to exploit the advantages of individual techniques, defeat their limits,and improve reliability as well [14,20,21].The strategy applied in this study is a combination of multiple algorithms including PLS-DA, RF, XGBoost, LASSO, and Ridge regression for the selection and reduction of features.The voting strategy based on the score of importance derived from the combination of these different algorithms was then applied for the final prediction.The voting process relies on the performance of these five algorithms in combination, which could avoid large errors or misclassifications from one model that could lead to detrimental voting results.Besides,a model that performs poorly may be offset by other models with strong performance during the voting process.As illustrated in Fig.2A, a total of 96 features identified by the Compound Discoverer software were chosen as the datasets for the selection of potential biomarkers for PD.A randomization process was used to separate the dataset into the training sets and the test sets (7:3).The potential features were ranked by the feature importance scores, which were provided by these five machine learning methods (Figs.2B-F).Voting strategy was then used to choose the top 8 highest scorers as the final prediction.Fig.3A shows the relative intensities of the biomarker panel.PD and control groups show significant difference in the levels of these metabolites.Among them, urinary levels of 3,3-dimethylglutaric acid and imidazolelactic acid were lower in PD patients as compared to healthy controls.In contrast, a higher level of 3-methoxytyramine,N-acetyl-L-tyrosine, orotic acid, uric acid, vanillic acid, and xanthine was found in the urine of patients with PD.The discriminant performance for the biomarker panel built from the ensemble-based algorithm reached an area under the curve (AUC) of over 94.7% and an accuracy of over 90.7%with different machine learning models (including decision tree,RF, extremely random forest, support vector machine, k-nearest neighbor, XGBoost) (Fig.3B).
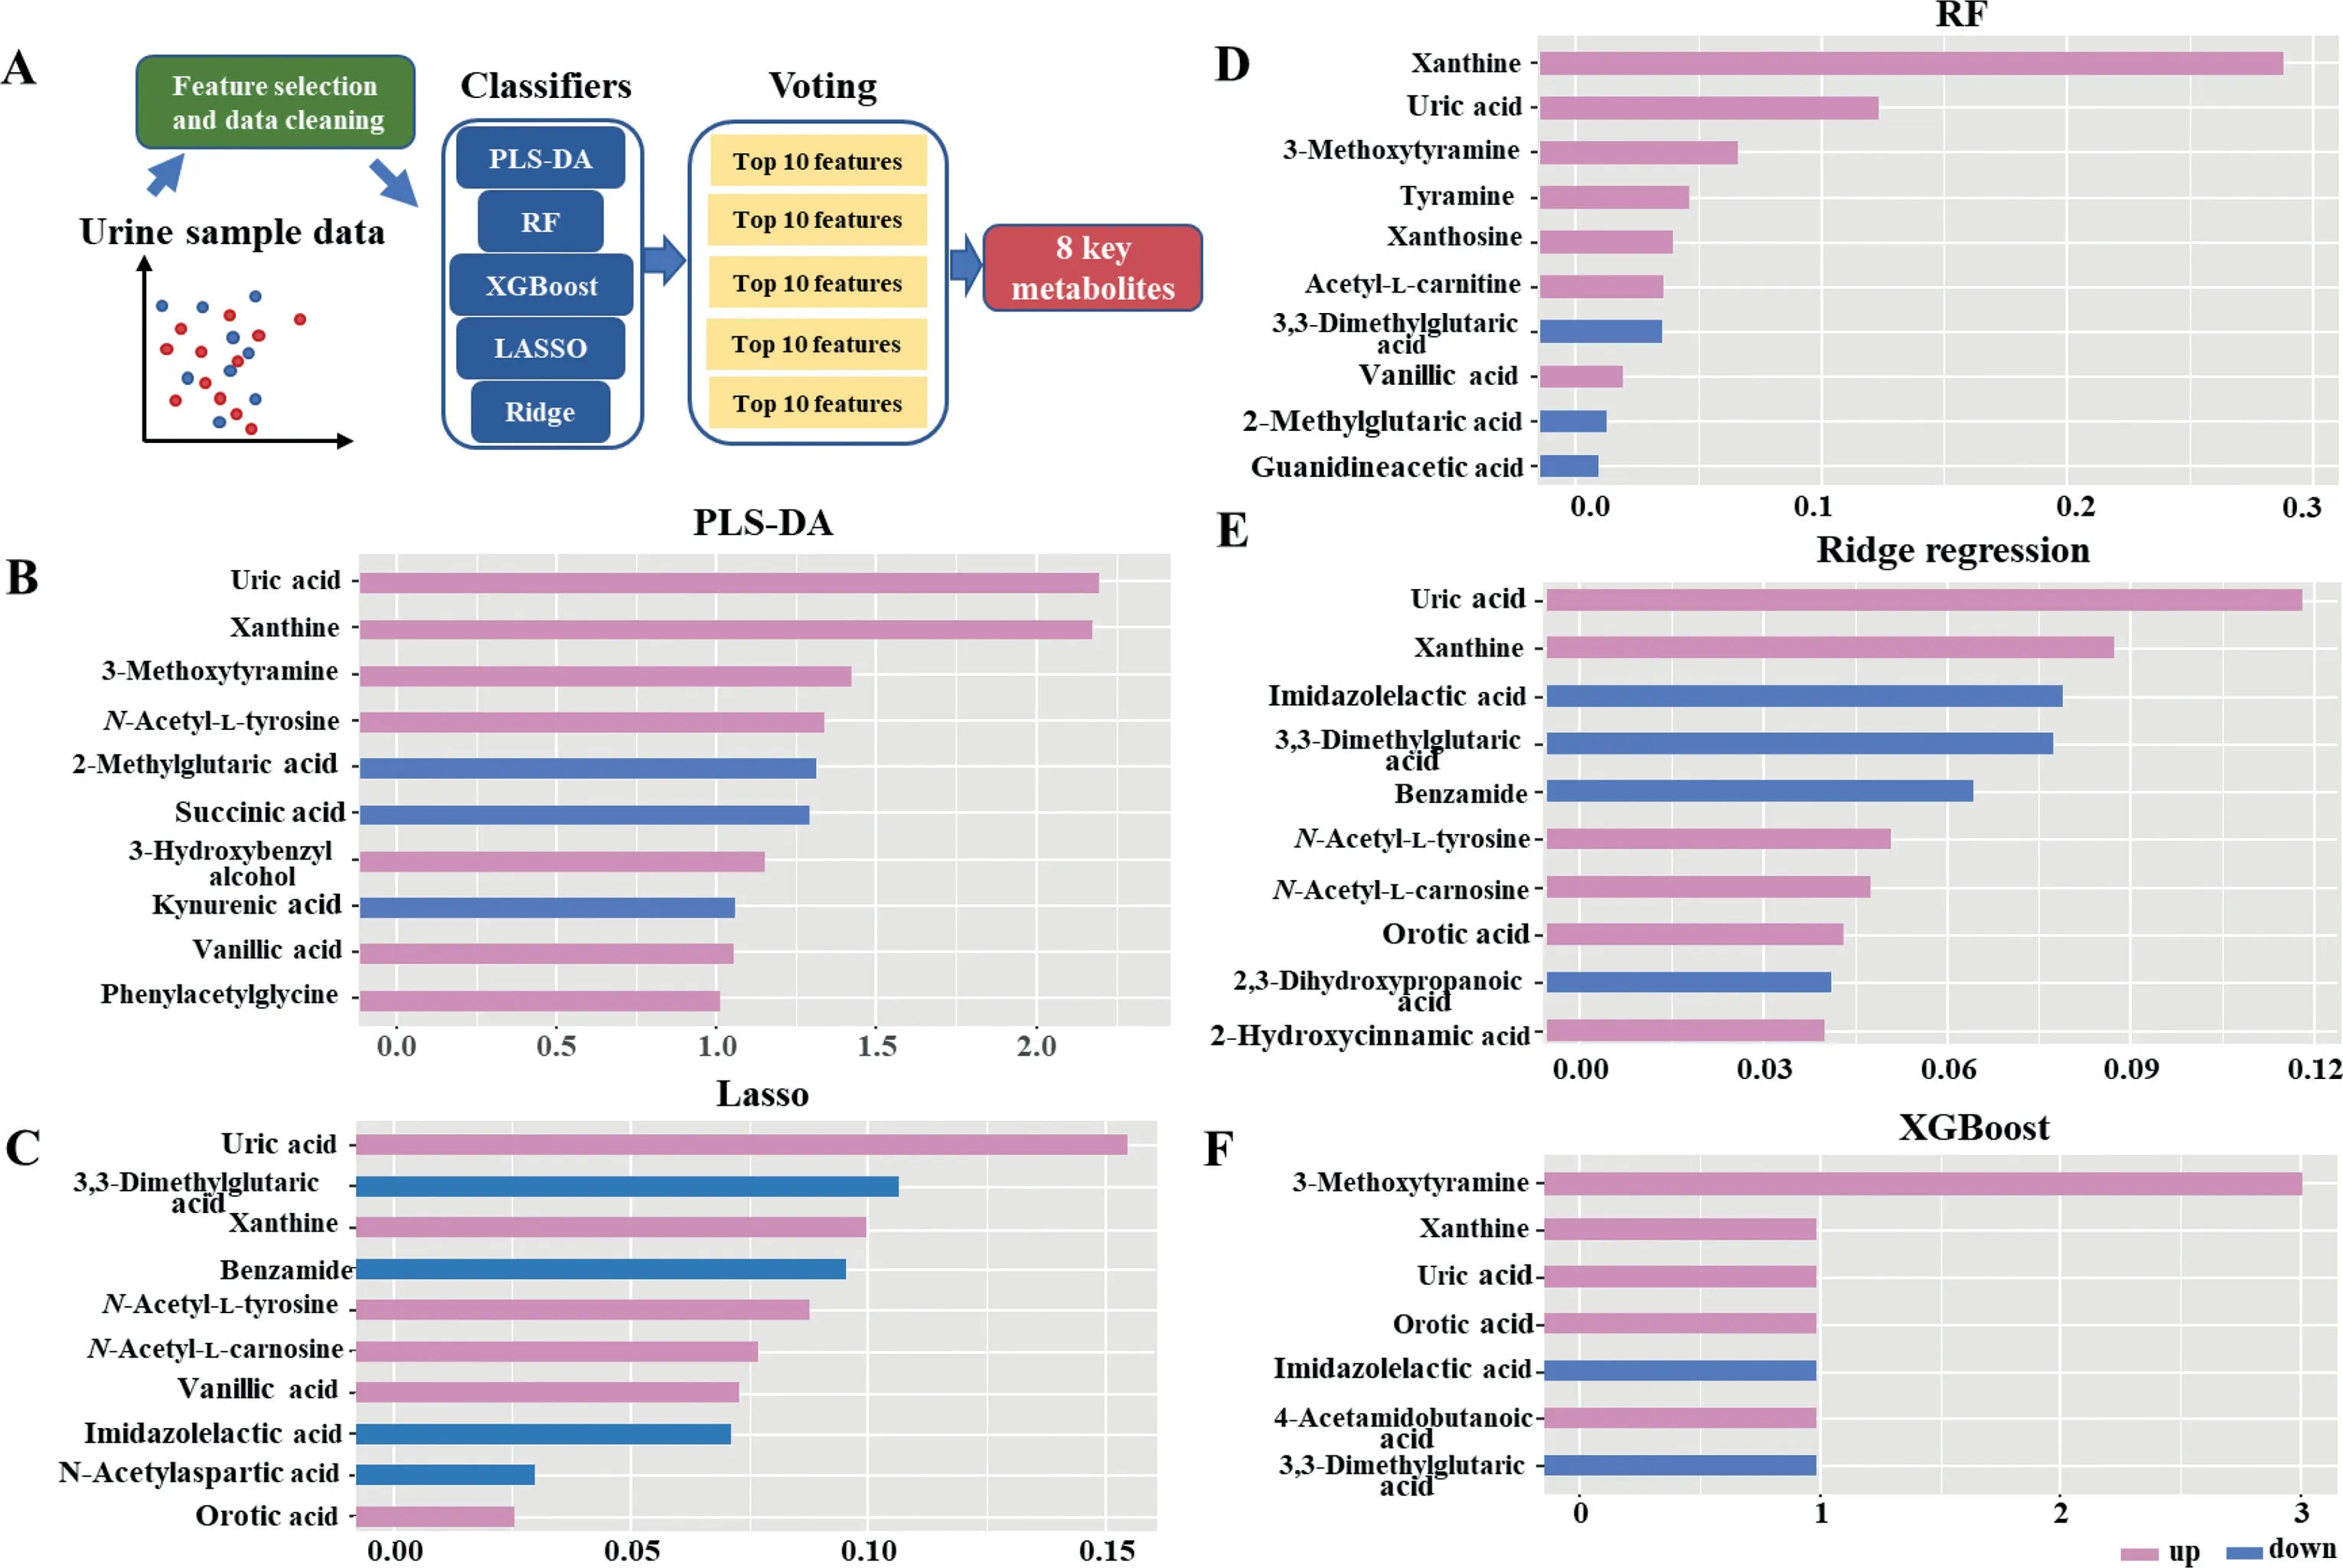
Fig.2.The development of a multi-metabolite model using a combination of machine learning methods for PD diagnosis.(A) Statistical workflow for feature selection.The top 10 important metabolic predictors ranked by VIP scores (B), LASSO frequencies (C), MDI scores (D), F score (Ridge regression) (E), and F score (XGBoost) (F).
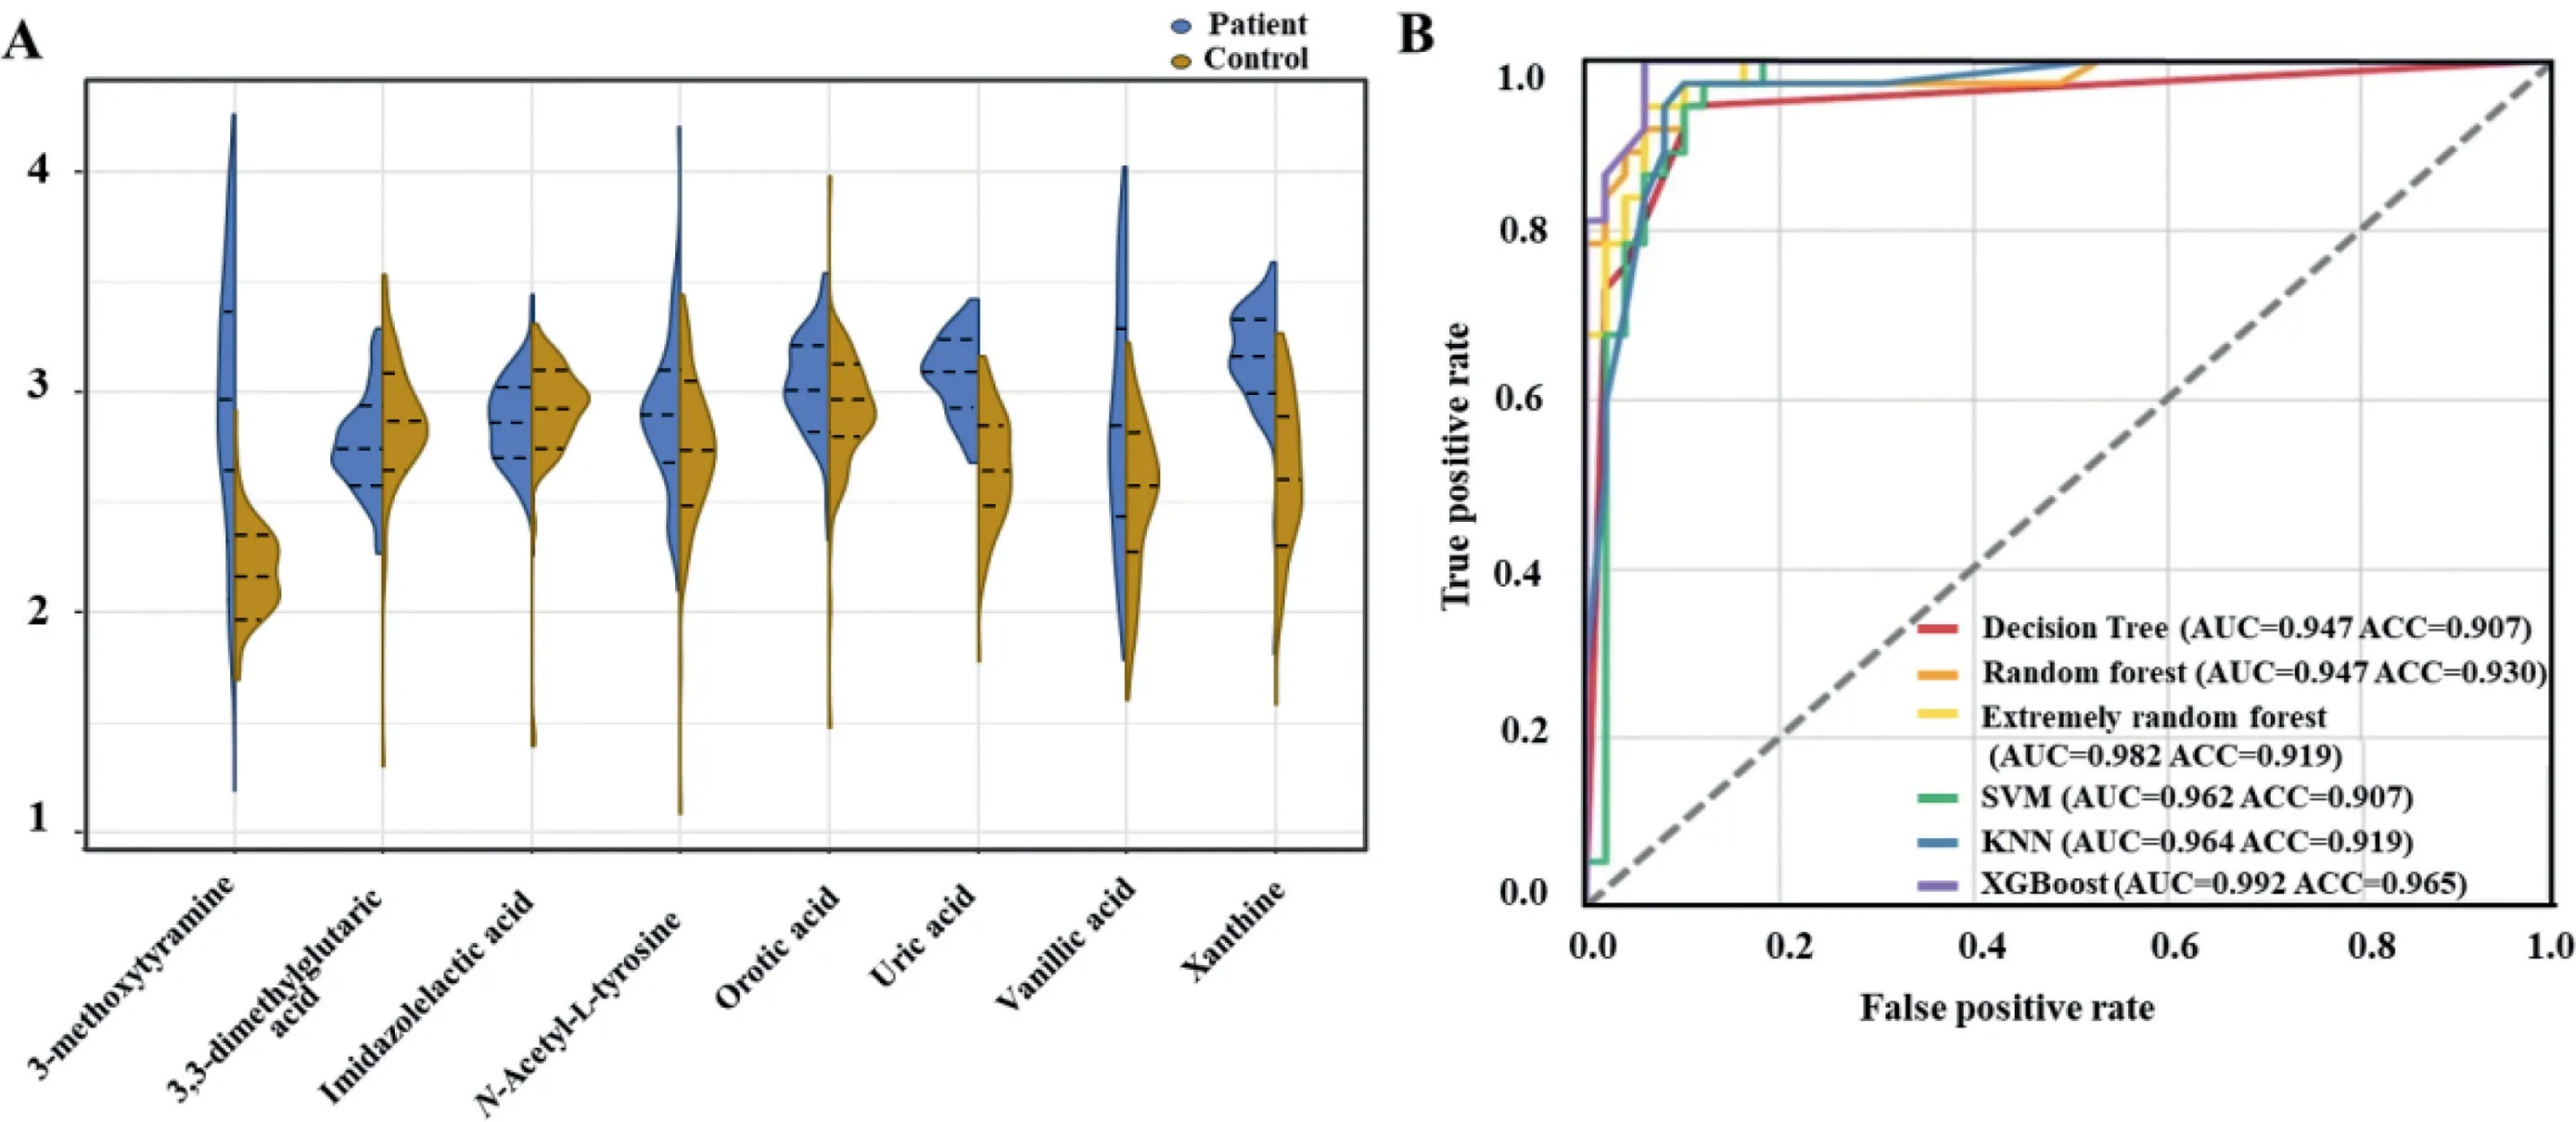
Fig.3.(A) A relative quantitative analysis of eight metabolic predictors.Violin plots have a median value and a quartile value, each represented by three lines (75 percent,50 percent, 25 percent).(B) ROC curve analysis of 6 machine learning algorithms for prediction of PD patients with 8 key metabolites.SVM, support vector machine; KNN,k-nearest neighbor; ROC, receiver operating characteristic; AUC, area under the curve; ACC, accuracy.

Fig.4.IPA of differential metabolites involved in signaling pathways and molecular networks implicated in PD.
In this study, QIAGEN ingenuity pathway analysis (IPA) software was used to analyze the biomarkers that differ between PD patients and control subjects, which enabled a successful and intuitive analysis of correlations between PD and biomarkers.We can use IPA to improve our understanding of the characteristics of various molecules, including biomarkers that are involved in gene, protein, and chemical pathways, along with their interactions with each other.The obtained eight metabolites were imported into IPA for analysis of biological pathways.Based on the IPA analysis results (Fig.4), uric acid, xanthine, vanillic acid, and 3-methoxytyramine were linked to PD-related signaling pathways and molecular networks.Uric acid, the end product of purine metabolism in humans [22], is an important physiological antioxidant that may play a role in oxidative stress reduction [23,24].PD patients have lower level of uric acid in their serum, which has been reported in many clinical and epidemiological studies [25–27].Besides these clinical and epidemiological studies, uric acid levels in serum or plasma are shown to be inversely related to the development and progress of PD [28–33].3-methoxytyramine, the main extracellular metabolite of dopamine, appears to be useful for the evaluation of decreased dopamine release [34,35].Previously,vanillic acid was demonstrated to be an endogenous metabolite of noradrenaline and adrenaline [36].Vanillic acid has been shown to attenuate behavioral, histopathological and histochemical changes occurring within rotenone-induced PD model, these effects were shown to be related its antioxidant properties [37].In addition,neuroinflammation signaling pathways were affected, as determined by the canonical pathway established by IPA analysis.There is growing evidence that the pathogenesis of PD is strongly linked to chronic neuroinflammation and targeting inflammation may be an effective therapy for the disease in the future [38].Understanding the role neuroinflammation plays in PD will facilitate a deeper understanding of the pathogenic mechanism of the disease, as well as the development of effective treatment options in the future[39].
In summary, a multi-metabolite predictive model based on ensemble machine learning methodologies using a voting stagey has been developed and has been found to be accurate to provide PD diagnostics with a rate of over 90.7% in 215 urine samples from PD and control subjects.The results of this study may be used as a reference for further clinical evaluation.
Declaration of competing interest
The authors declare that they have no known competing financial interests or personal relationships that could have appeared to influence the work reported in this paper.
Acknowledgments
The authors would like to acknowledge the financial support from the Collaborative Research Fund (No.C2011–21GF) and from Guangdong Province Basic and Applied Basic Research Foundation(No.2021B1515120051).
Supplementary materials
Supplementary material associated with this article can be found, in the online version, at doi:10.1016/j.cclet.2023.108230.
 Chinese Chemical Letters2023年10期
- Chinese Chemical Letters的其它文章
- Tribute text in memoriam of James N.Seiber (1940–2023)
- Recent advances in MXenes-based glucose biosensors
- Oxidative cyclopalladation triggers the hydroalkylation of alkynes✩
- An integrated supramolecular fungicide nanoplatform based on pH-sensitive metal–organic frameworks
- Probing the effect of nitrate anion in CAN: An additional opportunity to reduce the catalyst loading for aerobic oxidations✩
- Nickel-catalyzed reductive coupling reaction of monofluoroalkyl triflates with alkyl carboxylic acids toward the synthesis of α-alkyl-α-fluoro-alkylketones✩