
Selective conformer detection of short-lived base pair tautomers: A computational study of the unusual guanine-cytosine pairs using ultrafast resonance Raman spectroscopy
2023-11-18 09:52BolingTinYizhouFngShuliLeiKeXuChozhengHeShujunLiHoRen
Chinese Chemical Letters 2023年10期
Boling Tin, Yizhou Fng, Shuli Lei, Ke Xu, Chozheng He, Shujun Li,c,Ho Ren
a College of Chemistry and Pharmaceutical Sciences, Qingdao Agricultural University, Qingdao 266109, China
b Hubei Key Laboratory of Low Dimensional Optoelectronic Materials and Devices, Hubei University of Arts and Science, Xiangyang 441053, China
c Institute of Chemistry, Free University of Berlin, Arnimallee 22, Berlin D-14195, Germany
d Hubei Longzhong Laboratory, Xiangyang 441000, China
e Institute of Environment and Energy Catalysis, School of Materials Science and Chemical Engineering, Xi’an Technological University, Xi’an 710021, China
f School of Materials Science and Engineering, China University of Petroleum (East China), Qingdao 266580, China
Keywords:Guanine-cytosine pair Hydrogen bonding Tautomer Resonance Raman Vibronic coupling
ABSTRACT Base pair mismatch has been regarded as the main source of DNA point mutations, where minor shortlived tautomers were usually involved.However, the detection and characterization of these unnatural species pose challenges to existing techniques.Here, by using systematic structural and ultrafast resonance Raman (RR) spectral analysis for the four possible conformers of guanine-cytosine base pairs, the prominent marker Raman bands were identified.We found that the hydrogen bonding vibrational region from 2300 cm-1 to 3700 cm-1 is ideal for the identification of these short live species.The marker bands provide direct evidence for the existence of the tautomer species, thus offering an effective strategy to detect the short-lived minor species.Ultrafast resonance Raman spectroscopy would be a powerful tool to provide direct evidence of critical dynamical details of complex systems involving protonation or tautomerization.
Finding an effective strategy for conformer-selective detection of short-lived tautomer species is of pivotal importance to understand the biological processes of DNA in physiological environments.The maintenance of the genetic code relies on specific hydrogen bonding recognition between nucleic acid bases [1].According to the Watson–Crick model, the guanine–cytosine base pairs (G:C) are stabilized by three hydrogen bonds as shown in Fig.1a.This structural feature is important since it enables one to read the DNA sequence without unzipping the base pairs and is responsible for the recognition specificity and the binding patterns between other molecules and DNA strands [2,3].The nucleic acid bases are well known to exhibit various tautomeric conformations in different environments, implying that DNA could also accommodate a range of alternative pairing patterns that determines both the DNA double-helix structures and its biological function [4].The “reverse Watson-Crick” minor tautomer (G*:C*)shown in Fig.1b is proposed according to the Löwdin hypothesis [5,6], which is believed to cause pairing mismatch and potentially is the main source of spontaneous point mutations.We adopt the initial structure of the G*:C*tautomer from the work by Fuet al.[7], which has been extensively examined as a source of mutagenic GC tautomers [8].Other possible proton transferred tautomers were ruled out by structure optimizations and previous transition state calculations.While the noncanonical Hoogsteen guanine–cytosine base pairing (G:CH+) shown in Fig.1d exists in the dynamic equilibrium with Watson–Crick conformation,which is sparsely populated (~0.02%-0.4%) and short-lived (lifetimes ~0.2–2.5 ms) [9].The Hoogsteen G:CH+can alter the base pair’s electrostatics, constrict the DNA backbone, as well as play unique roles in DNA recognition [10].The hydrogen bonding interaction in various transient guanine–cytosine base pairs produces the key aspects of both DNA structures and genetic-related features[11,12].However, these transient isomers and the dynamic interconversions between them are difficult to detect due to the intrinsic complexities of the complexity and the fast kinetics in biological systems.Conventional crystalline characterizations are usually affected by crystallographic environments.Several crystalline experiments showed evidences of the existence of Hoogsteen G:CH+,however, solution nuclear magnetic resonance (NMR) characterizations suggest the same systems are Watson–Crick G:C conformation, implying that crystalline structures deviate from thosein vivo[13].In addition, the dynamic nature poses extra challenges for the detection and characterization of these short-lived conformers.

Fig.1.Optimized geometries of the guanine–cytosine (with assigned labels) considered in this work: (a) Canonical Watson–Crick G:C, (b) the rare Watson–Crick tautomer G*:C*, (c) the protonated Watson–Crick H+G:C, and (d) the noncanonical Hoogsteen G:CH+.Silver, blue, red and white balls denote carbon, nitrogen, oxygen and hydrogen atoms, respectively.
Some insights into these rare species are conventionally obtained by using X-ray crystal diffraction (XRD), infrared (IR) and/or Raman spectroscopy and mass spectrometry [14–16].However,these detections are usually not performedin vitro, leading to ambiguities related to physiological functions.In addition, these techniques usually have temporal resolutions much lower than the fast binding kinetics.For instance, NMR relaxation dispersion experiments have successfully detected Hoogsteen G:CH+in small,naked DNA duplexes [17], but it is difficult to characterize large DNA/protein complexes, due to severe spectral overlaps and unfavorable relaxations.There are a number of successful characterizations of the short-lived or sparely populated guanine–cytosine tautomers [18], but they are incapable of capturing the atomic resolution structures, and the tautomerization dynamics are not clear.
An effective tool to selectively detect G:C in a mixture with its transient tautomers would greatly facilitate the understanding of the microscopic mechanism and related biological functions.Spontaneous resonance Raman (spRR) spectroscopy detects the vibronic coupling between molecular vibrations and electronic transitions,and is a powerful technique to provide molecular fingerprint information [19–22].Molecular vibrations are sensitive to local chemical environments and their resonance with electronic transitions provides a high signal-to-noise ratio [23–26].By tuning the excitation wavelengths, spRR is capable of probing specific basepairs during complex biological processes.Combined with ultrafast pulses,spRR has been extended to the time domain, i.e., stimulated resonance Raman (stRR), which can give kinetic information of fast biological processes [27,28].With these advantages, spRR and stRR are powerful tools for identifying base-pair species probably with short lifetimes or only exist transiently.
In this work, we carried out systematicab initiosimulations to study the spRR and ultrafast stRR spectra of the four biologically important guanine–cytosine conformers,i.e., G:C, G:CH+, G*:C*and H+G:C.G:C is the most populated Watson–Crick conformation,while the hoogsteen G:CH+exists in dynamic equilibrium with canonical G:C.The rare tautomers G*:C*and H+G:C, which might participate in DNA mutation, were also considered here.The characteristic RR spectral patterns, as well as the appropriate excitation wavelengths for resonance enhancement, were predicted and would serve as references for future experiments.The spRR signals were evaluated by calculating the differential Raman scattering cross section [29]:
whereωinis the incident frequencies, whileωsigis the Raman signal frequencies.P(a) denotes the population of the state |a〉.αca(ωin) is the polarizability between state |a〉 and |c〉, which explicitly depends on the incident frequencyωin.In the practical calculations, the delta functionδ(ωin-ωsig-ωca) is replaced by a Gaussian function, which can ensure energy conservation during the scattering process.The pump-probe stRR signals can be obtained by:

HereωiandEi(ω) denote the center frequency and envelope of theith pulse, respectively.Detailed derivations of spRR and stRR can be found in Ref.[29].Considering the electronic dynamics is much faster than the nuclear relaxation, we use the linewidth parameters of 10 cm-1and 100 cm-1for the vibrational and electronic spectra to capture the broadening effects originating from intermediate state lifetimes.These values have been widely used in previous theoretical calculations [30–33].The calculated vibrational frequencies were scaled by 0.97 to correct the systematic errors [34].All the calculations, including structure optimization, vibrational analysis and electronic transitions were carried out by using the Gaussian 16 package at the (time-dependent) B3LYP/cc-pVTZ level of theory [35].This computational scheme has been proven successful to describe the electronic structures of nucleobases [36].To understand the strong peaks in the UV absorption spectra, we performed natural transition orbital (NTO) analysis for the corresponding electronic transitions [37].The first order Franck-Condon contribution to the vibronic coupling was considered, while the higher order Herzberg-Teller terms were neglected since only strongly allowed electronic transitions were involved [38,39].The solvation effect was implicitly accounted by the polarizable continuum model with conductor-like solvations (CPCM) method [40].

Fig.2.Vibration resolved UV–vis absorption spectra for four guanine–cytosine conformers.
Fig.1 shows the fully optimized structure of the guanine–cytosine base pairs.The Watson–Crick pairing pattern has three hydrogen bonds, while the Hoogsteen structure has only two.Three kinds of hydrogen bonds in G:C are shown in Fig.1a,one proton is covalently bonded to N1 of guanine and hydrogen bonded to N7 of cytosine, the second hydrogen bond occurs between the amino group of cytosine and the O1 of guanine, and the third hydrogen bond occurs between the amino group of guanine and the O2 of cytosine.The Hoogsteen G:CH+pairing pattern is stabilized by two hydrogen bonds resulting from a 180° rotation of the purine base in Watson–Crick.As shown in Fig.1d, one proton is bonded to N7 of cytosine and N5 of guanine, and the second hydrogen bond occurs between the amino group of cytosine and the O1 of guanine.The formation of two hydrogen bonds shortens the C–C distance between guanine and cytosine, which can lead to the kinks of the DNA double helix.Herein, except for the biologically important Watson–Crick G:C and Hoogsteen G:CH+conformation, we extend the selected analogs including the “reverse Watson-Crick” minor tautomer G*:C*and the isolated protonated Watson-Crick H+G:C.The G*:C*species is a double proton transfer state of G:C.As shown in Fig.1b, the guanine exists in its enol form (G*), and the cytosine exists in the form of iminocytosine (C*).The hydrogen bonds of G*:C*are covalently bound to O1 of guanine and the N7 of cytosine, respectively.This short-lived G*:C*tautomer is considered to be the main potential source of spontaneous point mutations.But there is no direct experimental evidence to probe this isomer so far.Accessing its spectroscopic signatures would facilitate the investigation of the proton transfer mechanism on DAN mutation.The protonated H+G:C as shown in Fig.1c, mainly existing in solution at pH 5.8 [41,42], is one base pairing conformer of the protonated DNA, which is very important for a better understanding of DNA biological chemistry.Here, both the canonical G:C and the double proton transfer conformer G*:C*are neutral structures, while the protonated H+G:C and the protonbound non-covalent G:CH+are with net charges +1, respectively.To reduce the computational cost of the simulations without affecting the spectroscopic properties, the methyl groups were used to instead the binding sites at N8 of cytosine and N4 of guanine in guanine–cytosine isomers, which is bound to ribose or deoxyribose in nucleic acids.
Appropriate excitation wavelengths are required to match the UV absorption of the target species for UVRR detection.It can be obtained by examining the vibrational resolved UV absorption spectroscopy of guanine–cytosine.As shown in Fig.2, the total absorption and the dominant contributions of the main peaks of each conformer were depicted in 222–286 nm (35,000–45,000 cm-1) region, which match well with the experimental UV–vis absorption spectra of nucleotides [43].Herein, we also assessed the spatial distribution of the strongly allowed electronic excitations by performing NTO analysis.The NTO plots of the interesting electronic transitions of the four conformers are presented in Figs.S1–S4(Supporting information).For clarity, we denote theith electronic transition of isomers S asεSi.The total absorption spectra are plotted in black.
As shown in Fig.2a, four electronic transitions have been identified as contributing significantly to the total UV–vis spectrum of the canonical G:C.The maximum peak lies near 40,726 cm-1(245.5 nm), which is mainly attributed to the electron rearrangement transition ofεI4from guanine to cytosine.It contains considerable hydrogen bond distribution changes around the N6H2,N1H3, and N2H4 regions along with the NTO analysis in Fig.S1.Two weak absorption bands at 37,747 cm-1(264.9 nm) and 38,968 cm-1(256.6 nm) are comparable in intensity.One is contributed from theεI2excitation at 37,747 cm-1, which is ascribed to the electron rearrangement inside the guanine base, while the second band at 38,968 cm-1comes from a typical electron rearrangement transition ofεI3inside the cytosine base.The spatial distributions of the NTOs for these transitions are depicted in Fig.S1.The fourth transitionεI6is located in the 228.7 nm region,which is a weak transition.
G*:C*is the double proton transfer state from G:C.Two main peaks appear at 36,921 cm-1(270.9 nm) and 38,007 cm-1(263.1 nm), respectively.One comes from theπ→π*transition ofεII2excitation at 270.9 nm and another peak arises from theεII3excitation at 263.1 nm.Herein,εII2is a typical electron rearrangement inside guanine, andεII3is the typical electron rearrangement inside cytosine as shown in Fig.S2.Compared to G:C, there are no obvious peaks in the 240–260 nm region.Two relatively weaker shoulder bands are observed at 237.9 and 235.2 nm, which are corresponding to the excitation ofεII4at 42,020 cm-1(237.9 nm) andεII5at 42,463 cm-1(235.2 nm).These two excitations arise from the electron rearrangement from guanine to cytosine as shown in Fig.S2.It is worth noticing that the electron rearrangement excitations from guanine to cytosine in G*:C*exhibit some blueshift compared to that of G:C, while the electron rearrangement excitations inside guanine (εII2) and cytosine (εII3) exhibit some redshift,which are in agreement with the proposing hyperchromic effect or subtractive effect.
For the H+G:C conformer, the protonation has a significant effect on its absorption spectrum.As shown in Fig.2c, there are no obvious bands in the region above 260 nm.Comparatively, the peaks are more dense and concentrated in the region 240–260 nm,which are respectively centered at 38,772 cm-1, 39,664 cm-1and 40,808 cm-1.According to the corresponding NTO analysis(Fig.S3), these peaks at 38,772 cm-1and 39,664 cm-1are assigned from the contributions ofεIV3at 257.9 nm andεIV4at 252.1 nm, which are related to the electron rearrangement from guanine to cytosine.While the other two peaks at 40,808 cm-1and 41,054 cm-1are assigned to the contributions ofεIV5at 245.1 nm andεIV6at 243.6 nm, which are typically considered the electron rearrangement from cytosine to guanine.In addition, there is a strong peak in the deep UV region at 40,808 cm-1, which is assigned to the electron rearrangement inside the cytosine base byεIV8excitation at 226.2 nm.These characteristic features suggest that the protonated H+G:C represents important uniqueness,which may contribute to the detection of H+G:C.
As the purine of G:C is rotated 180°, one proton of guanine is covalently bound to the N7 of the cytosine to form G:CH+.As shown in Fig.2d, the Hoogsteen G:CH+spectra feature also has three typical absorption peaks, which are generally similar to the Watson-Crick G:C.The strongest band appears is corresponding to the contributions ofεIII4at 41,017 cm-1(243.8 nm), while two weaker transitions appear above 260 nm.The strongest peak of G:CH+at 243.8 nm displays some blue-shift compared to that of G:C at 245.5 nm, while other two weak peaks of G:CH+above 260 nm show some red-shifts.In addition, two weak peaks are also dramatically reweighted in the relative intensities in G:CH+.One peak located at 37,495 cm-1(266.7 nm) is stronger than that at 37,951 cm-1(263.5 nm).The former peak assigned toεIII2mainly comes from the contribution of N7-H6 stretching, while the weakerεIII3peak is mainly assigned to the N1-H3 stretching,which is in agreement with the NTOs analysis of these electronic excitations depicted in Fig.S4.Spectroscopically, we cannot directly distinguish four conformers alone due to the congestion of their UV–vis spectrum, but these spectral data provide the basis necessary for further exploitation of UVRR spectroscopy.

Fig.3.Two-dimensional spontaneous Raman spectra of (a-d) four guanine–cytosine conformers with excitation energy scanned from 35,000 cm-1 to 45,000 cm-1.The horizontal and vertical axes represent the Raman shift and excitation energy, respectively.
To illustrate the capability of RR to characterize the pairing patterns of guanine–cytosine conformers, the correlation between the structural components and their RR spectroscopic signatures is established.According to the structural analysis, the hydrogenbonding interaction modes, especially the CH/NH/OH modes in the hydrogen-bonding interactions region from 2300 cm-1to 3700 cm-1, are the key RR active modes.They are far away from the normal vibrational frequencies of the guanine or cytosine monomer, and can be effectively filtered out from the vibrational modes of H2O or peptides by tuning the incoming excitation wavenumber.These properties make these hydrogen-bond related vibrational modes have unexpected marking effects in structural diagnosis, which can benefit experimental applications in spectroscopy detection.These well-defined RR marker bands under the UV resonance excitation have been assessed as shown in Fig.3.Tables 1–4 present the Raman active vibrational modes with relatively obvious intensity in the range 2300–3700 cm-1under the excitation from 35,000–45,000 cm-1.There are also other vibra-tion modes, which did not include in these Table lists, but they are all RR-silent or with weaker intensity in this excitation region.

Table 1 Raman active modes and assignments of G:C.All frequencies are wavenumbers.

Table 2 Raman active modes assignments for G*:C*.All frequencies are wavenumbers.
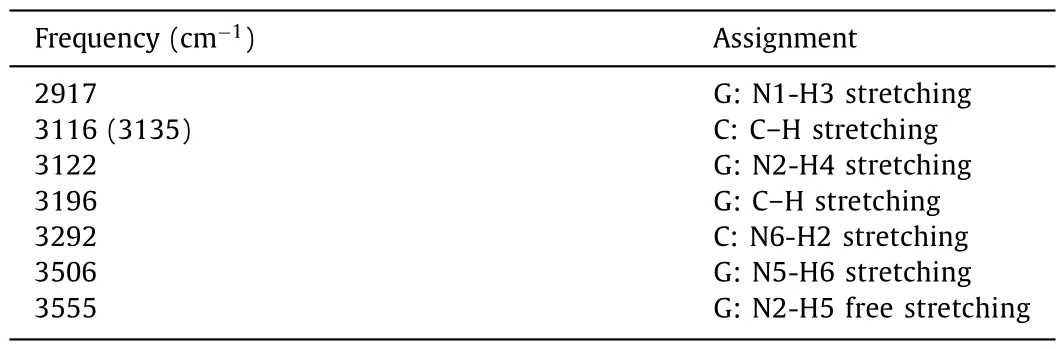
Table 3 Raman active modes and assignments for H+G:C.All frequencies are wavenumbers.
Using the marker bands of G:C as a benchmark, prominent UVRR bands of its short-live tautomers are evaluated at each excitation wavelength.As shown in Fig.3a, five well-separated vibrational modes are observed under the resonant excitation from 35,000 cm-1to 45,000 cm-1, which can be conveniently classified into two categories.One is originated from the C–H stretching, such as the C–H stretching of CH3inside guanine at 2960 cm-1, and the C–H stretching of guanine or cytosine at 3139 or 3115 cm-1.Another special signal band comes from the N–H stretching, including the N–H stretching inside the hydrogen bonds and the free N–H stretching.Such as both the G:N1-H3 stretching at 3041 cm-1, the G:N2-H4 stretching at 3203 cm-1, and the C:N6-H2 stretching at 3215 cm-1are all the N–H stretching involved to the hydrogen bonds, while both the G:N2-H5 stretching at 3567 cm-1and the C:N6-H1 stretching at 3563 cm-1are free N–H stretching.Compared to free N–H stretching around 3500 cm-1, all the hydrogen bonds related N–H stretching centered from 3000 cm-1to 3200 cm-1are blue-shifted, which can be selectively identified by theεI2resonant excitation at 264.9 nm(37,750 cm-1).It can also be confirmed by the NTO analysis of G:C(Fig.S1).As the most population conformation, the Watson–Crick G:C will be considered as the reference standard in the following RR spectral discussion.
To confirm its tautomeric conformer, we further investigate the spRR spectra of G*:C*.As shown in Fig.3b, one strong signal at 2440 cm-1exhibits strong Raman intensity, while bands of medium intensity are observed at 2993, 3117(3136), 3366 and3565(3431) cm-1.This is different from that of canonical G:C, especially the G:O1–H2 stretching at 2440 cm-1, which is formed by the hydrogen bonded to N6 of cytosine, and belongs to the marker RR band of G*:C*.This peak is the strongest signal for G*:C*under the selected excitation range, which is the direct evidence for the formation of transient G*:C*.Meanwhile, as the atom H3 inside guanine undergoes proton transfer, a new N7-H3 bond is formed inside G*:C*,and its characteristic Raman signal N7-H3 stretching appears at 2993 cm-1, which exhibits a redshifted compared with the G:N1-H3 stretching at 3041 cm-1inside G:C.It is also a characteristic RR peak for G*:C*.That means if the G*:C*is present at physiological conditions, both a strong RR signal band around 2440 cm-1and a weaker peak around 2993 cm-1would be observed under specific electronic excitation.The full assignment of the other three assigned RR bands, such as the C:C–H stretching at 3117 cm-1, the G:N2-H4 symmetric stretch at 3366 cm-1,and the free N–H stretching at 3431 cm-1(C:N6-H1 stretching) or 3566 cm-1(G:N2-H5 stretching) are listed in Table 3, which are also valuable for the detection of G*:C*.For example, the G:N2-H4 stretching at 3366 cm-1in G*:C*has some blue-shift compared to that of G:C at 3202 cm-1.Based on the analysis of the vertical excitation energy, bothεII2at 270.9 nm (36,921 cm-1) andεII4at 238.0 nm (42,020 cm-1) can be selected as the preferred excitation wavelengths to identify G*: C*.Under this excitation, the specific RR peaks at 2240 cm-1and 3366 cm-1can be well identified, which are much stronger than the C–H stretching signals.This is consistent with the NTOs analyses ofεII2andεII4for G*:C*shown in Fig.S2.
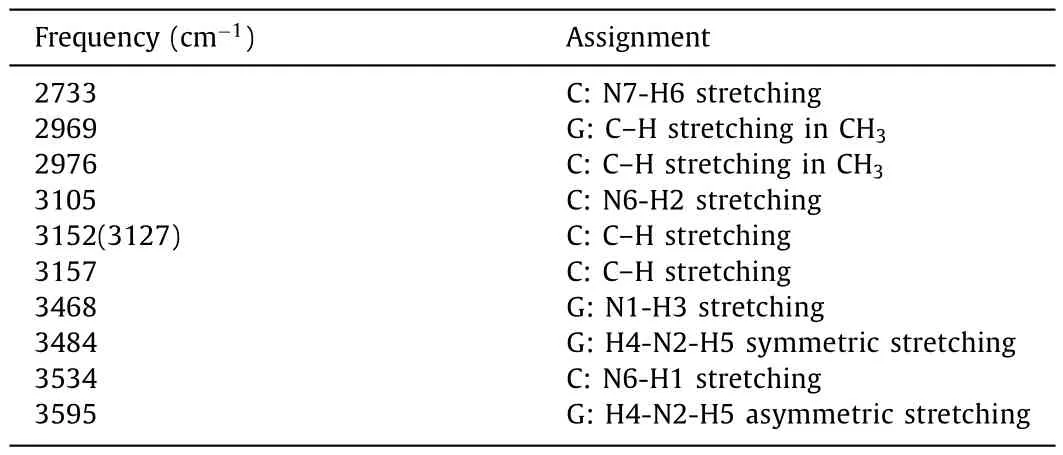
Table 4 Raman active modes and assignments for G:CH+.All frequencies are wavenumbers.
H+G:C is the protonated conformer of G:C under a low pH environment, in which one proton is bound to the N5 of guanine.Different from G*:C*, there are no obvious Raman bands in the low-frequency region below 28,000 cm-1.In the high-frequency region above 3400 cm-1, H+G:C shows another intense Raman band at 3506 cm-1in addition to the free G:N2-H5 stretching at 3555 cm-1, which is assigned to the G:N5-H6+stretching.It is a characteristic marker RR band of H+G:C.In the medium region from 2900 to 3300 cm-1, the spRR spectrum shows several identical vibrational modes attributable to hydrogen bond interaction,such as the G:N1-H3 stretching at 2917 cm-1, G:N2-H4 stretching at 3122 cm-1, and C:N6-H2 stretching at 3292 cm-1.Due to the strong ion-induced dipole interaction, three typical hydrogenbond related modes exhibit obvious red or blue shift, such as that the G:N1-H3 stretching is red-shifted from 3042 to 2917 cm-1, the G:N2-H4 stretching is red shifted from 3202 to 3122 cm-1, and the C:N6-H2 stretching is blue-shifted from 3216 to 3292 cm-1.Moreover, the spRR signal bands of H+G:C is more separated compared to that of G:C.
G:CH+is stabilized by two hydrogen bonds, with the bond donors being the N6 and N7 of cytosine and acceptors being the O1 and N5 of guanine, respectively.As a result, both the C:N7-H6 stretching at 2733 cm-1and the C:N6-H2 stretching at 3105 cm-1are the typical marker bands to characterize G:CH+.Meanwhile, as the broken of three hydrogen bonds in G:C, one free N1-H3 bond is released.As shown in Fig.3d, three N–H stretching modes, such as the free G:N1–H3 stretching at 3468 cm-1, the G:H4–N2–H5 symmetric stretching at 3484 cm-1and the G:H4–N2–H5 asymmetric stretching at 3495 cm-1are also observed.All these characteristic RR bands can be well identified under the special electronic excitation.For example, both the C:N7-H6 stretching at 2733 cm-1and C: N6-H2 stretching at 3105 cm-1can be well identified under theεIV2excitation at 266.7 nm (37,495 cm-1), the G:N1-H3 stretching at 3468 cm-1is a RR active mode under theεIV3excitation at 263.5 nm (37,951 cm-1).Compared to that of G*:C*, even a similar N7-H6 bond is also appeared in G:CH+, but the corresponding G:N7-H6 stretching signals are red shifted from 2993 to 2733 cm-1, which is far away from the noise C–H stretching and makes the identification of G:CH+conformer much easily.The spatial distribution of the NTOs forεIV2,εIV3andεIV4are depicted in Fig.S4.Herein, the electronic transitionεIV2is related to the N7-H6 bond with an O2 to N7 transition, the electronic transitionεIV3is mainly related to the electronic transition localized around N1-H3 bond, and the electronic transitionεIV4is mainly related to the electronic transition localized around N6-H2 bond, which are all in better agreement with the typical spRR signals.

Fig.4.One-dimensional spontaneous Raman spectra of G:C (red), G*:C* (green),H+G:C (cyan) and G:CH+(blue) species.The excitation energies are selected at (a)272, (b) 266, (c) 264 and (d) 229 nm.
The UVRR spectra of H2O and D2O solutions of nucleosides (dA,dG, dC, dT) have been extensively studied under the laser excitation wavelengths in the deep UV region from 193 nm to 280 nm[44–46].The results show that the RR spectral signal are strongly dependent on excitation wavelength and constitute sensitive and selective probe for nucleosides.To characterize the prominent Raman bands that could potentially be used to identify different short-lived tautomer species, we studied the spRR spectra of four conformers excited at selected excitation wavelengths of 272, 266,264 and 229 nm.
Fig.4a compares UVRR spectra of G:C, G*:C*, H+G:C, and G:CH+excited at 272 nm.The dominant bands at 2440 cm-1exhibits the outstanding Raman intensity in G*:C*, which is well isolated from other UVRR markers under this excitation.This band is assigned to the mode involving of G:O1-H2 stretching in G*:C*.Another typical band of G*:C*occurs at 3366 cm-1.It’s assigned to a G:N2-H4 stretching, which exhibits a moderately Raman intensity.These are useful marker Raman bands of G*:C*, which provide a unique advantage in discriminating the G*:C*.In contrast, G:C excited at 272 nm exhibits the weakest signal intensities, roughly lower than 150 orders of magnitude of G*C*, while both the H+G:C and G:CH+exhibit relatively weak Raman signals.
Fig.4b shows the UVRR spectra excited at 266 nm.G:CH+gives a well-resolved band at 2733 cm-1assigned to the C:N7-H6 stretching.It’s well isolated from markers of other species.Another typical band of G:CH+occurs at 3105 cm-1due to C:N6-H2 stretching.These markers are well resolved, which are useful marker bands for diagnosing G:CH+.It is worth noting that a weak band at 3506 cm-1of H+G:C under 266 nm excitation exhibits a strong signal under excitation at 264 nm (Fig.4c).It corresponds to the G:N5-H6+stretching of H+G:C, which provides a potentially valuable indicator of H+G:C The results show that UVRR signals of the G:C and its short-lived tautomer species are strongly dependent on excitation wavelength and constitute a sensitive and selective detection of the labeled bands.We also investigated the spectral signal under excitation at 229 nm, a common excitation wavelength in experiments.As shown in Fig.4d, both G:C and H+G:C species exhibited stronger UVRR signals compared to the other two species.A typical marker band for both G:C and H+G:C is the G:N1-H3 stretching, which appears at 2960 cm-1in G:C,but shifts to 2916 cm-1in H+G:C.Both G*:C*and G:CH+exhibited weaker UVRR signals, but also provided well-resolved marker bands at 2440 cm-1and 2733 cm-1, respectively.

Fig.5.Comparison between stRR (dashed) and spRR (solid) spectra for (a) G:C, (b)G*:C*, (c) H+G:C and (d) G:CH+ BPs.The center frequencies of the pump and probe pulse used in the stRR simulation are denoted as (ε0, εi), with the pump chosen to be pre-resonant at ε0=25,000 cm-1.
As mentioned above, the protonated H+G:C and G:CH+can be effectively identified under excitation at 266 and 264 nm, while the excitation wavelength of 272 nm is a suitable excitation energy to enhance the G*:C*signals.These results provide a library of UVRR labeled bands for structural analysis of guanine–cytosine undergoing protonation or tautomerization events.
Different from spRR, time-resolved stimulated resonance Raman(stRR) is a nonlinear technique using a pump-probe pulse configuration that drives the system to evolve in its vibrationally excited states, which can directly probe the structural dynamics along their vibrational modes and has a sufficiently high temporal resolution to capture spectroscopic snapshots for short-lived tautomer species.The pump pulse prepares a vibrationally excited state wave packet in the ground electronic state via a pre-resonance Raman process, and the probe pulse arrives the sample after a time delay to probe the dynamics of this wave packet with a resonance Raman process.This pulse configuration preserves the selectivity and resonant enhancement of spRR, in the meantime, avoiding the excited state population probably caused by the pump.A strong signal in the stRR spectra implies that the corresponding vibrational excitation survives the time delay between the pump and probe pulses and hence produces a strong correlation.Fig.5 presents the one-dimensional (1D) stRR results simulated to illustrate the applicability of this technique in conformer-selective detection.The pump was chosen to be centered atε0=25,000 cm-1,which is off-resonant with any excited states of four GC conformers.The probe is chosen to be resonant with the selected electronic excitation for each system denoted as i.The center frequencies of the pump and probe pulse used in the stRR simulation are denoted as (ε0,εi).
The 1D stRR spectra (dashed line) accompanied with the frequency-domain spontaneous version (solid lines) are shown in Fig.5.Similar to the spRR signals, the stRR can capture the distinctive features of four species, ensuring their capability for structure characterization, such as that both the G:O1-H2 stretching of G*:C*at 2440 cm-1and the marker C: N7-H6+stretching of G:CH+at 2733 cm-1are all identified under the special stRR simulation.However, the relative intensities of the marker peaks change obviously.As shown in Fig.5a, the prominent spectral indicative of stRR for G:C is an intense Raman band at 3114 cm-1,which involves C–H stretching of cytosine under the excitationεI2,while the maximum intensity bands turn to the G:N2-H4 stretching at 3202 cm-1in the spRR detection.For G*:C*as shown in Fig.5b, in addition to the marker band at 2440 cm-1, both the C:N7-H3 stretching at 2993 cm-1and C:C–H stretching at 3117 cm-1exhibit relatively more intensities in the stRR detection compared to that of spRR.Similarly, H+G:C presents an intense band around 2916 cm-1under theεIII5resonance excitation of spRR spectrum.However, this peak is not detected and the maximum peak shifts to 3121 cm-1in stRR spectra.This demonstrates that the proper choice of the excitation wavelength makes stRR spectroscopy a suitable technique for capturing the rapid structural changes of guanine–cytosine undergone upon protonation or tautomeric transformation events.
In summary, the present UVRR signatures of four guanine–cytosine species exhibit abundant marker Raman bands, which carry rich structure information about the microscopic structure,with specific characteristics that would be helpful for conformer selective detection of short-lived tautomer species in DNA mutations.Both frequency-domain spRR and time-domain stRR features were simulated byab initiostudies.These data clearly show the unique UVRR fingerprints of the four species.Although both stRR and spRR induce similar spectral signals, the spectroscopic features excited with different wavelengths of incident lights demonstrate the excitation wavelength selectivity of the RR technique.Moreover, the stRR technique also provides femtosecond scale high temporal resolution, providing the ability to detect specific species during the fast kinetics or dynamics undergone upon protonation or tautomeric transformation events.Combining the fingerprint nature of vibration modes, the chemical-specie dependent selectivity of excitation wavelengths, and the resonance enhancement, our results suggest that spRR and stRR are powerful tools for the chemical identification of various guanine–cytosine pairing patterns at low concentrations or possess short lifetimes.Considering the complexity of the physiological environment, the vibrational modes of these G:C tautomers would be affected by the solution environment.An additional assessment on the effects of hydrogen-bonding with solvent water was performed (Tables S1-S4 in Supporting information).The frequency variations of the vibration features discussed here are not significant and would not alter the qualitative conclusions.By carefully choosing excitation energies, it not only filters out the vibrational modes from the solvents,but also monitors the transient short-lived base pair tautomers in different environments.Combined with other conventional methods of experimental characterization, this technique promises to be a powerful tool to provide direct evidence of critical dynamical details of complex systems involving protonation or tautomerization.
Declaration of competing interest
The authors declare that they have no known competing financial interests or personal relationships that could have appeared to influence the work reported in this paper.
Acknowledgments
We acknowledge the financial support from the National Key Research and Development Program of China (No.2019YFA0708703), the National Natural Science Foundation of China (NSFC, No.21773309), the High-level Science Foundation of Qingdao Agricultural University (No.663/1114351), the Hefei National Laboratory for Physical Sciences at the Microscale (No.KF2020004), Xiangyang Science and Technology Research and Development (No.2020YL09) and Hubei University of Arts and Science (Nos.HLOM222003, 2020kypytd002).
Supplementary materials
Supplementary material associated with this article can be found, in the online version, at doi:10.1016/j.cclet.2023.108144.
 Chinese Chemical Letters2023年10期
- Chinese Chemical Letters的其它文章
- Tribute text in memoriam of James N.Seiber (1940–2023)
- Recent advances in MXenes-based glucose biosensors
- Oxidative cyclopalladation triggers the hydroalkylation of alkynes✩
- An integrated supramolecular fungicide nanoplatform based on pH-sensitive metal–organic frameworks
- Probing the effect of nitrate anion in CAN: An additional opportunity to reduce the catalyst loading for aerobic oxidations✩
- Nickel-catalyzed reductive coupling reaction of monofluoroalkyl triflates with alkyl carboxylic acids toward the synthesis of α-alkyl-α-fluoro-alkylketones✩