白光LEDs 用Ca9.15La0.9(PO4)7∶Eu2+, Mn2+材料的发光特性及能量传递
2023-12-29 15:56张晓帅李晓彤王志军李盼来
发光学报 2023年12期
王 涛, 张晓帅, 李晓彤, 王志军, 李盼来*
(1. 中国石油大学(华东) 理学院, 山东 青岛 266580; 2. 河北大学 物理科学与技术学院, 河北 保定 071002)
1 Introduction
In recent years, the concept of high-quality and healthy lighting has been deeply rooted in the hearts of the people. Full-spectrum phosphors have become a research hotspot in the field of lighting[1-2]. In order to obtain full-spectrum phosphors, it is a simple and effective method to use energy transfer between different ions[3]. The energy transfer from the sensitizer to the activator can not only broaden the emission spectrum coverage of the phosphor, but also continuously regulate the emission color of the phosphor[4]. Compared with the luminescent material doped with a single activator, the luminescent material co-doped with multiple rare earth ions has richer luminescent properties due to its multiple luminescent centers. For example, for La2MgGeO6∶Eu3+,Bi3+, the energy transfer between the two activators is used to change the content of Eu3+, and the regulation of the luminous color from blue to red is realized[5]; for Ba10(PO4)6O∶Eu2+,Mn2+, not only realized the change of luminous color from blue to yellow, but also obtained a white light material with broadband emission[6]; for Sr6Ca4(PO4)6F2∶Eu2+,Mn2+, when single-doped, there is only a blue light at 450 nm in the emission spectrum, and a red light at 570 nm is added after the introduction of Mn2+, Eu2+can transfer energy to Mn2+. When the content of Mn2+is increased, the emission color can be adjusted, and a white phosphor with broadband emission is obtained[7].
Commonly used red light emitting activators usually choose Sm3+, Pr3+, Mn2+. The former two, because their transition mode is f-f transition, usually exhibit linear emission and cover a small area in the spectrum[8-10]. However, in the research of this paper,it is necessary to obtain a wider spectral coverage as much as possible, hence these two ions are not suitable for use as co-doped activators. In comparison,the transition metal ion Mn2+, which has an unfilled outer electron shell, can generally exhibit broadband emission due to the transition of4T1(4G)→6A1(6S),and its 3d energy level is exposed, therefore, with the change of the crystal field, the low-coordination green emission can be transformed into the high-coordination red emission[11]. It is known from previous research reports that the optimal doping concentration of Eu2+is 0.05, so we conducted follow-up experiments on this basis[12]. The matrix can provide a high coordination site for Mn2+, hence series of Ca9.15La0.9(PO4)7∶0.05Eu2+,yMn2+(C9L0.9C0.15P∶0.05Eu2+,yMn2+) and Ca9.3La0.8(PO4)7∶0.05Eu2+,yMn2+(C9L0.8C0.3P∶0.05Eu2+,yMn2+) were synthesized , and its luminescent properties were studied.
2 Sample Preparation
2.1 Material Synthesis
The phosphors of C9L0.9C0.15P∶0.05Eu2+,yMn2+and C9L0.8C0.3P∶0.05Eu2+,yMn2+were synthesized by the high temperature solid state method. The raw materials are CaCO3(99.9%), La2O3(99.9%), Mn-CO3(99.9%), Eu2O3(99.9%) and NH4H2PO4(99.9%).According to the designed chemical formula composition and stoichiometric ratio(within the allowable error of 0.000 5 g), the required raw materials were calculated and weighed. Grind it in an agate mortar for at least 25 minutes to mix well, and then, all the powders were loaded into an alumina crucible, and placed in a box-type high-temperature furnace for continuous calcination at 1 200 ℃ for 5 hours under a carbon-reducing atmosphere. The carbon-reducing atmosphere would reduce Eu3+to Eu2+. After cooling down naturally, the sample was taken out and placed in a mortar and ground into powder again.
2.2 Material Characterization
The crystal phase of the sample was tested by Bruker D8 X-ray diffractometer, whose radiation source was Cu target Kα(λ=0.154 06 nm), working voltage was 40 kV, working current was 40 mA,scanning range was 2θ=10°-80°, and step size was 0.02(°)/s, and determine whether the synthesized material is pure phase. The spectral characteristics of the samples were measured by a Hitachi F-4600 fluorescence spectrometer with an excitation source of 450 W xenon lamp, a scanning range of 200-800 nm, a scanning speed of 240 nm/min, and a temperature range of 4-350 K. We use HoribaFL3 to characterize the life decay curve of the sample, use 350 nm nano-LED as the excitation source when testing the life of Eu2+, and use 450 W Xe lamp as the excitation source to test the life of Mn2+.
3 Results and Discussion
3.1 Phase Formation of Samples
Fig. 1(a) shows the XRD patterns of C9L0.9C0.15P∶0.05Eu2+, C9L0.9C0.15P∶0.05Eu2+,0.6Mn2+, C9L0.8-C0.3P∶0.05Eu2+and C9L0.8C0.3P∶0.05Eu2+,0.6Mn2+,and the maximum concentration is selected as a representative and compared with the standard card(ICSD#59590). It can be seen from the figure that the diffraction peaks of the samples match well with the standard card, and no redundant diffraction peaks appear. It shows that the introduction of Mn2+does not change the crystal structure, and the synthesized sample is a pure phase. In order to further prove that the samples meet the experimental requirements, the refined software GSAS was used to refine the structure of the selected samples, and the results are shown in Fig. 1(b). The specific refinement parameters can be seen from the attached Tab.S1, bothRpandRwpmeet the experimental requirements(less than 10% and 15% respectively). And the unit cell volumeVdecreases in different degrees. It is proved that the transition metal Mn2+can be successfully introduced into the matrix without changing the structure. Fig. 1(c) shows the rich cationic sites present in the matrix. Depending on the match between the valence state and the radius of the ion, Eu2+and Mn2+will randomly replace three different calcium positions.
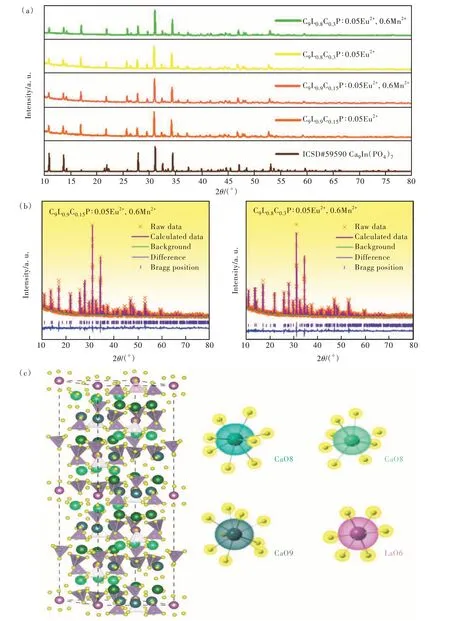
Fig.1 (a)XRD patterns of CLCP∶Eu2+,Mn2+. (b)Refinement results of C9L0.9C0.15P∶0.05Eu2+,0.6Mn2+ and C9L0.8C0.3P∶0.05Eu2+,0.6Mn2+ based on ICSD#59590 standard card. (c)Crystal structure of Ca9La(PO4)7.
3.2 Luminescence Properties
Fig. 2(a) and (b) depict the emission spectra of C9L0.9C0.15P∶0.05Eu2+,yMn2+and C9L0.8C0.3P∶0.05Eu2+,yMn2+under 330 nm excitation. And the spectrum exhibits a broad coverage range from 380 nm to 750 nm, and the three emission bands located art 427, 510, 650 nm, respectively. With the increase of the Mn2+concentrations, the intensities of the first two emission peaks are continuously weakened, and the intensity of the latter emission peak is continuously enhanced. Aty= 0.6, the intensity of the emission peak reaches the maximum, and then begins to weakened. As shown in Fig. S1, under 330 nm excitation, the emission spectra of C9L0.8C0.3P∶Eu2+, C9L1P∶Eu2+and the excitation spectra corresponding to the two emission peaks were tested, and the two emission peaks were located at around 427 nm and 510 nm, respectively. Fig. 2(a)-(b) and Fig. S1 show that the first two peaks come from the luminescence of Eu2+ions in different lattice positions, hence it is obvious that the emission peak at 650 nm belongs to Mn2+, which is very similar to the results in the literature[12]. The illustration shows the effect of the change of Mn2+doping concentration on the luminescence of the three emission peaks. The change of emission intensity in the figure implies that there may be the energy transfer between Eu2+and Mn2+in the sample, indicating that the regulation of the matrix has no effect on the fact that the energy transfer between the two may occur. The regulation of matrix components only affects the energy transfer efficiency between Eu2+and Mn2+.
In order to verify whether there is energy transfer between Eu2+and Mn2+in CLCP∶0.05Eu2+,yMn2+, C9L0.9C0.15P is used as an example. We monitor the fluorescence curves of Eu2+ions at 427 nm and 510 nm, respectively, and the results are shown in Fig. S2. According to the equations (1) and(2)[13-15]:
whereI(t) represent the luminous intensity,A1andA2are constants,tis time, andτ1andτ2are the fast and slow decay lifetime. The average effective lifetime of an ion can be calculated as:
the results obtained by the formula are recorded in Tab.S2, and the results are shown in Fig.2(c)-(d).With increasing the Mn2+concentration, the lifetime of the two Eu2+peaks tends to decrease. The lifetime obtained at 427 nm attenuates from 587.3 ns to 49.4 ns, and the lifetime obtained at 510 nm attenuates from 903.7 ns to 237.6 ns. Obviously, the energy transfer from Eu2+to Mn2+exists in C9L0.9C0.15P∶0.05Eu2+,yMn2+. The energy transfer efficiency(ηT)can be calculated by equation (3)[16]:

Fig.2 Emission spectra of C9L0.9C0.15P∶0.05Eu2+,yMn2+(a) and C9L0.8C0.3P∶0.05Eu2+,yMn2+(b)(λex=330 nm). Lifetime of Eu2+in C9L0.9C0.15P∶0.05Eu2+,yMn2+(λem=427 nm)(c) and (λem=510 nm)(d).
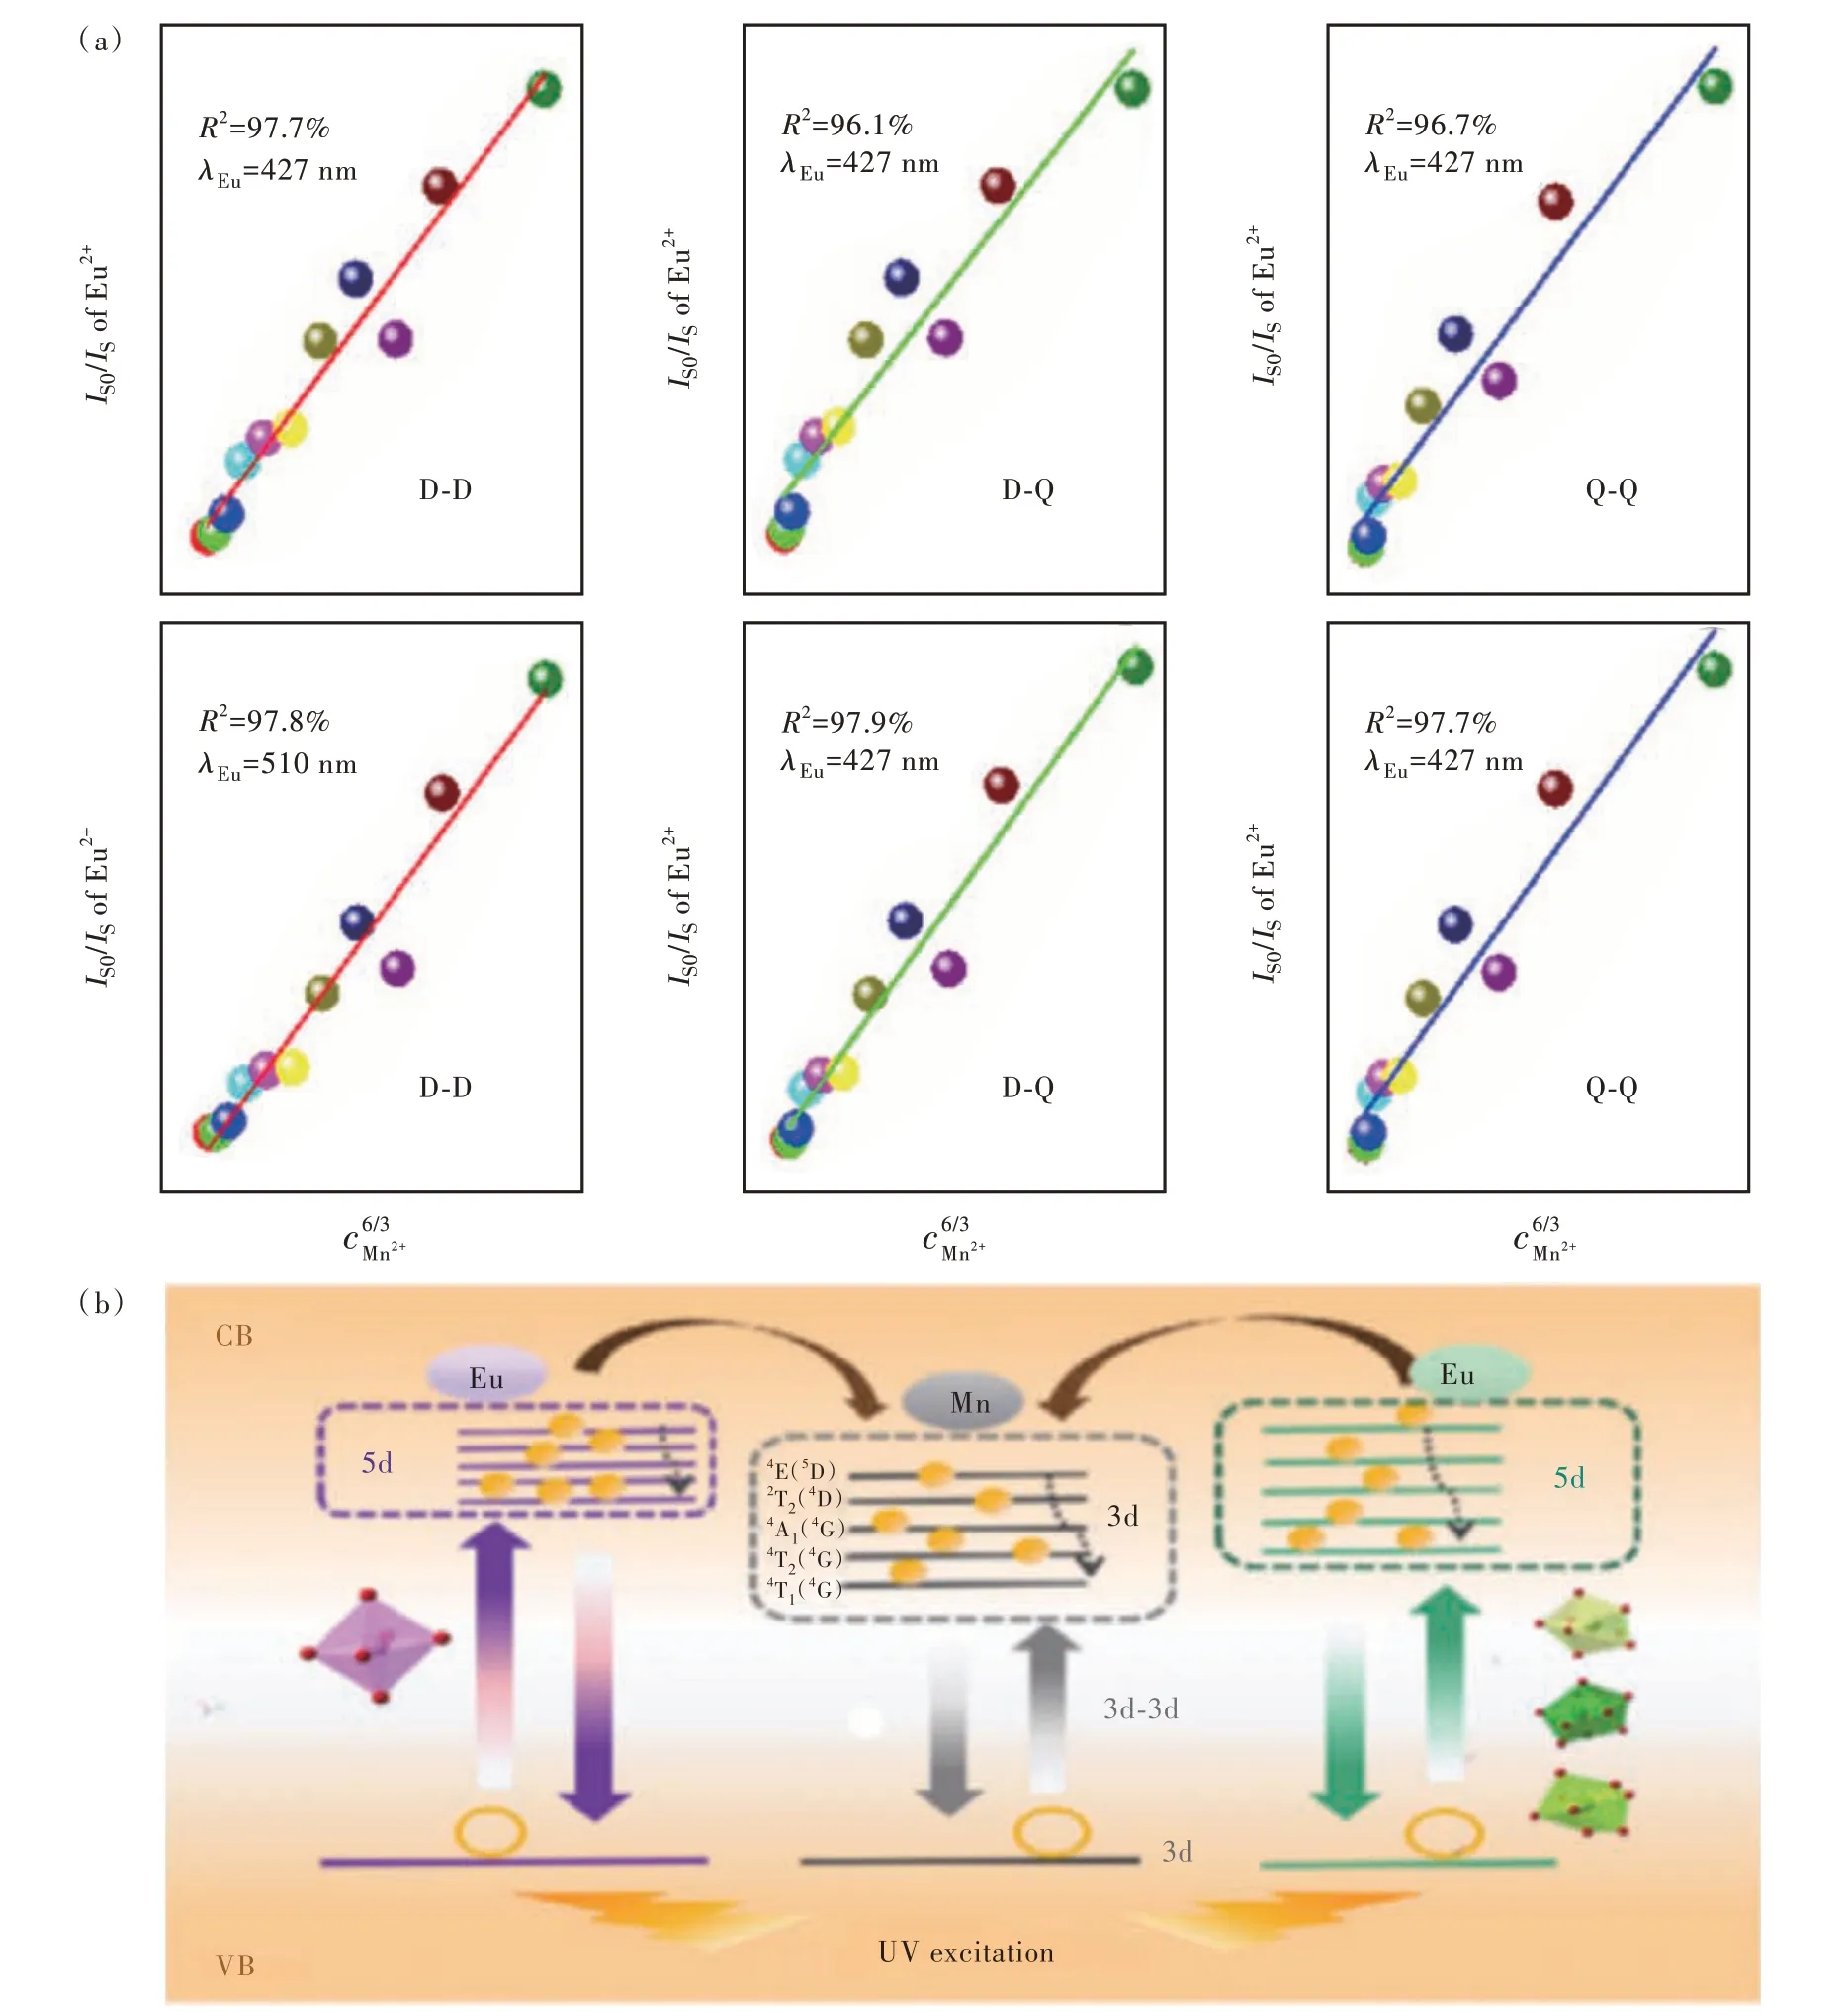
Fig.3 (a)The relationship between IS0/IS and content.(b)Energy transfer process and energy level model of Eu2+ and Mn2+ in CLCP.
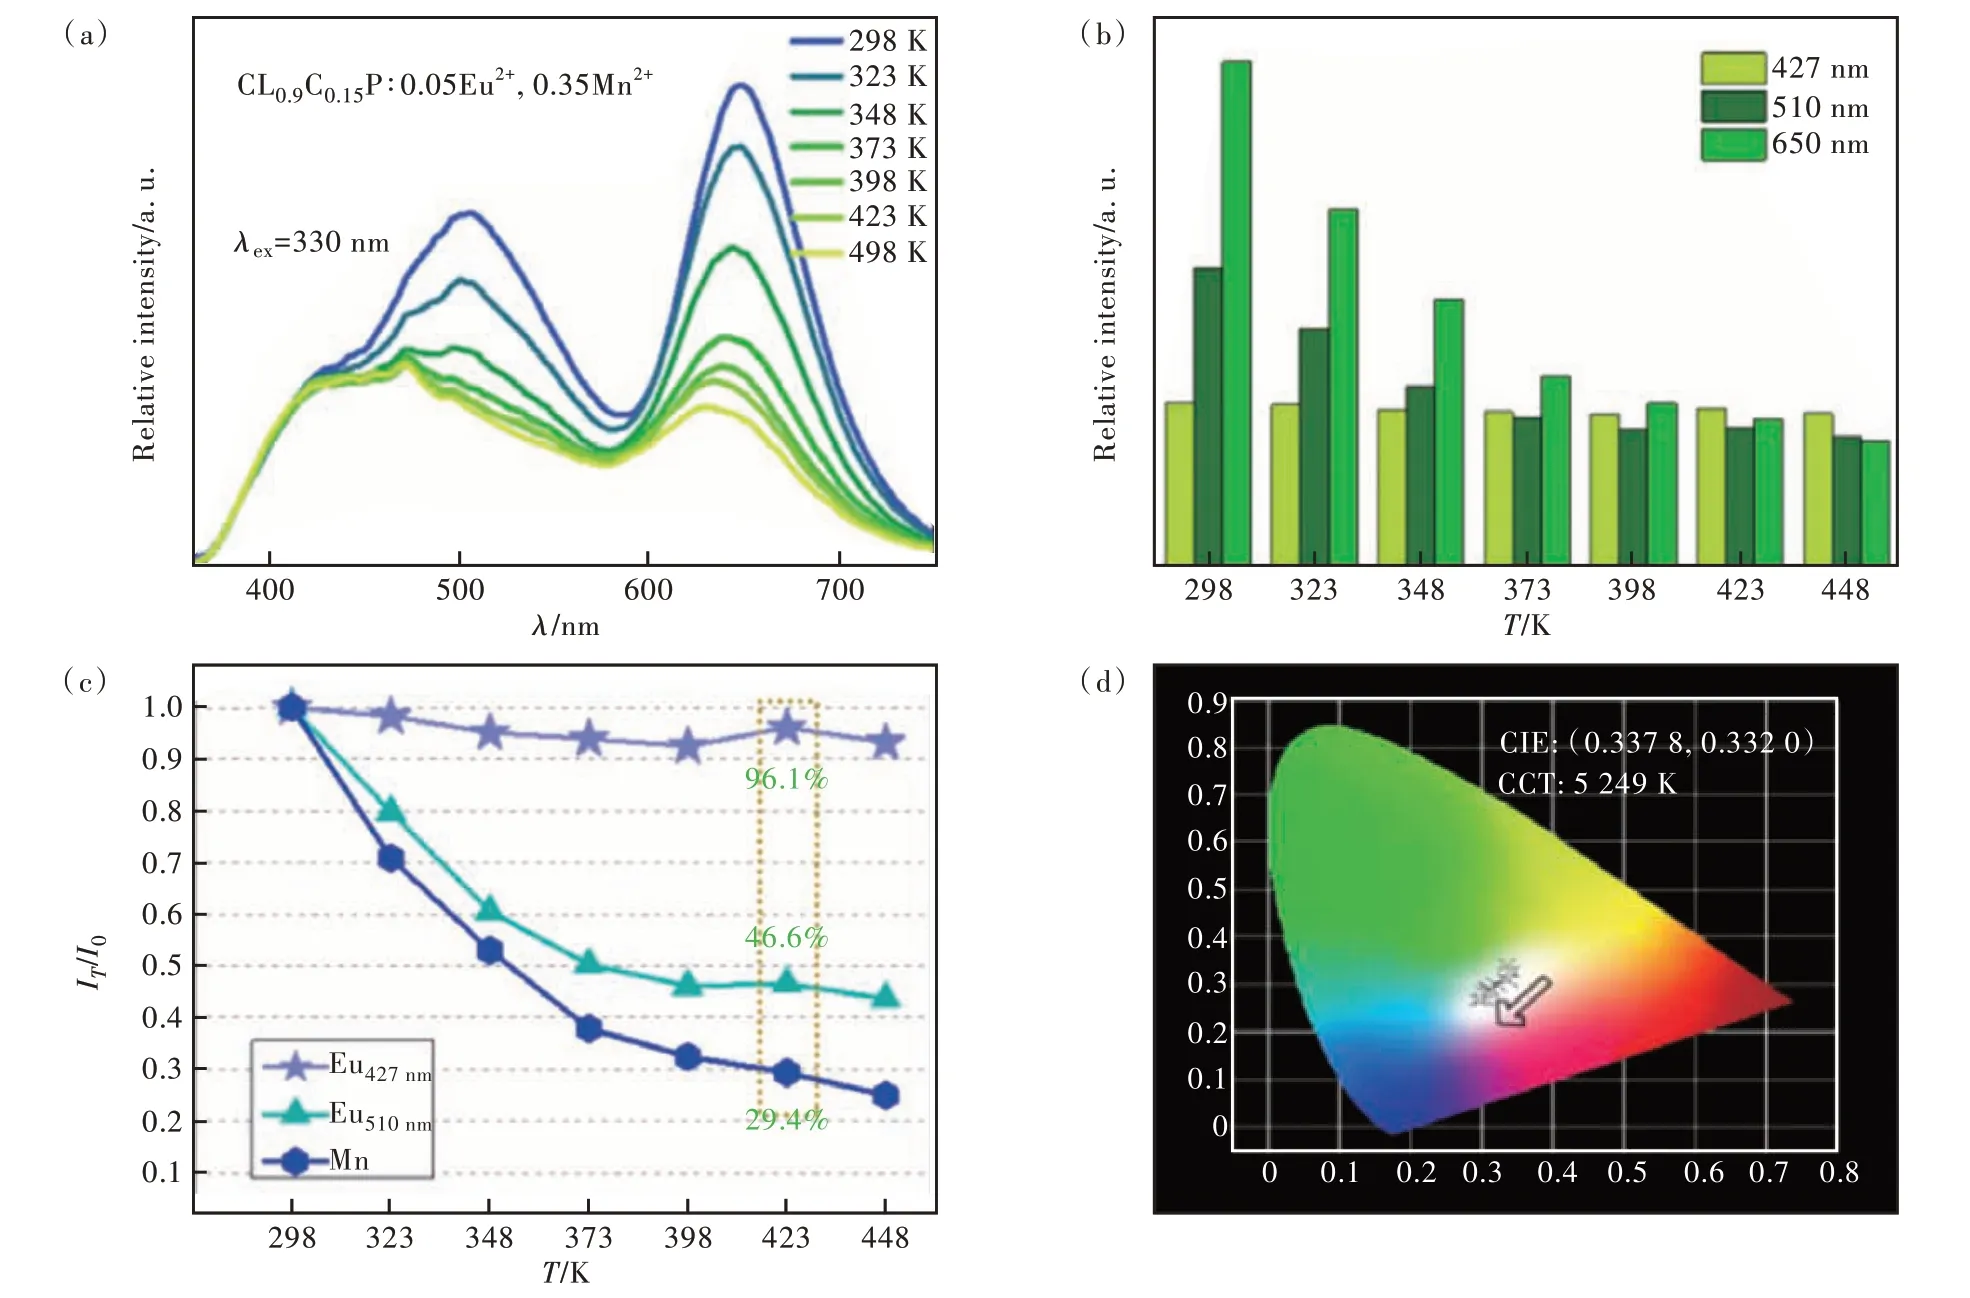
Fig.4 (a)Temperature properties of CLCP∶0.05Eu2+,0.35Mn2+. (b)Emission intensity as a function of temperature. (c)The ratio(IT/I0) at each temperature. (d)Color coordinates with temperature.
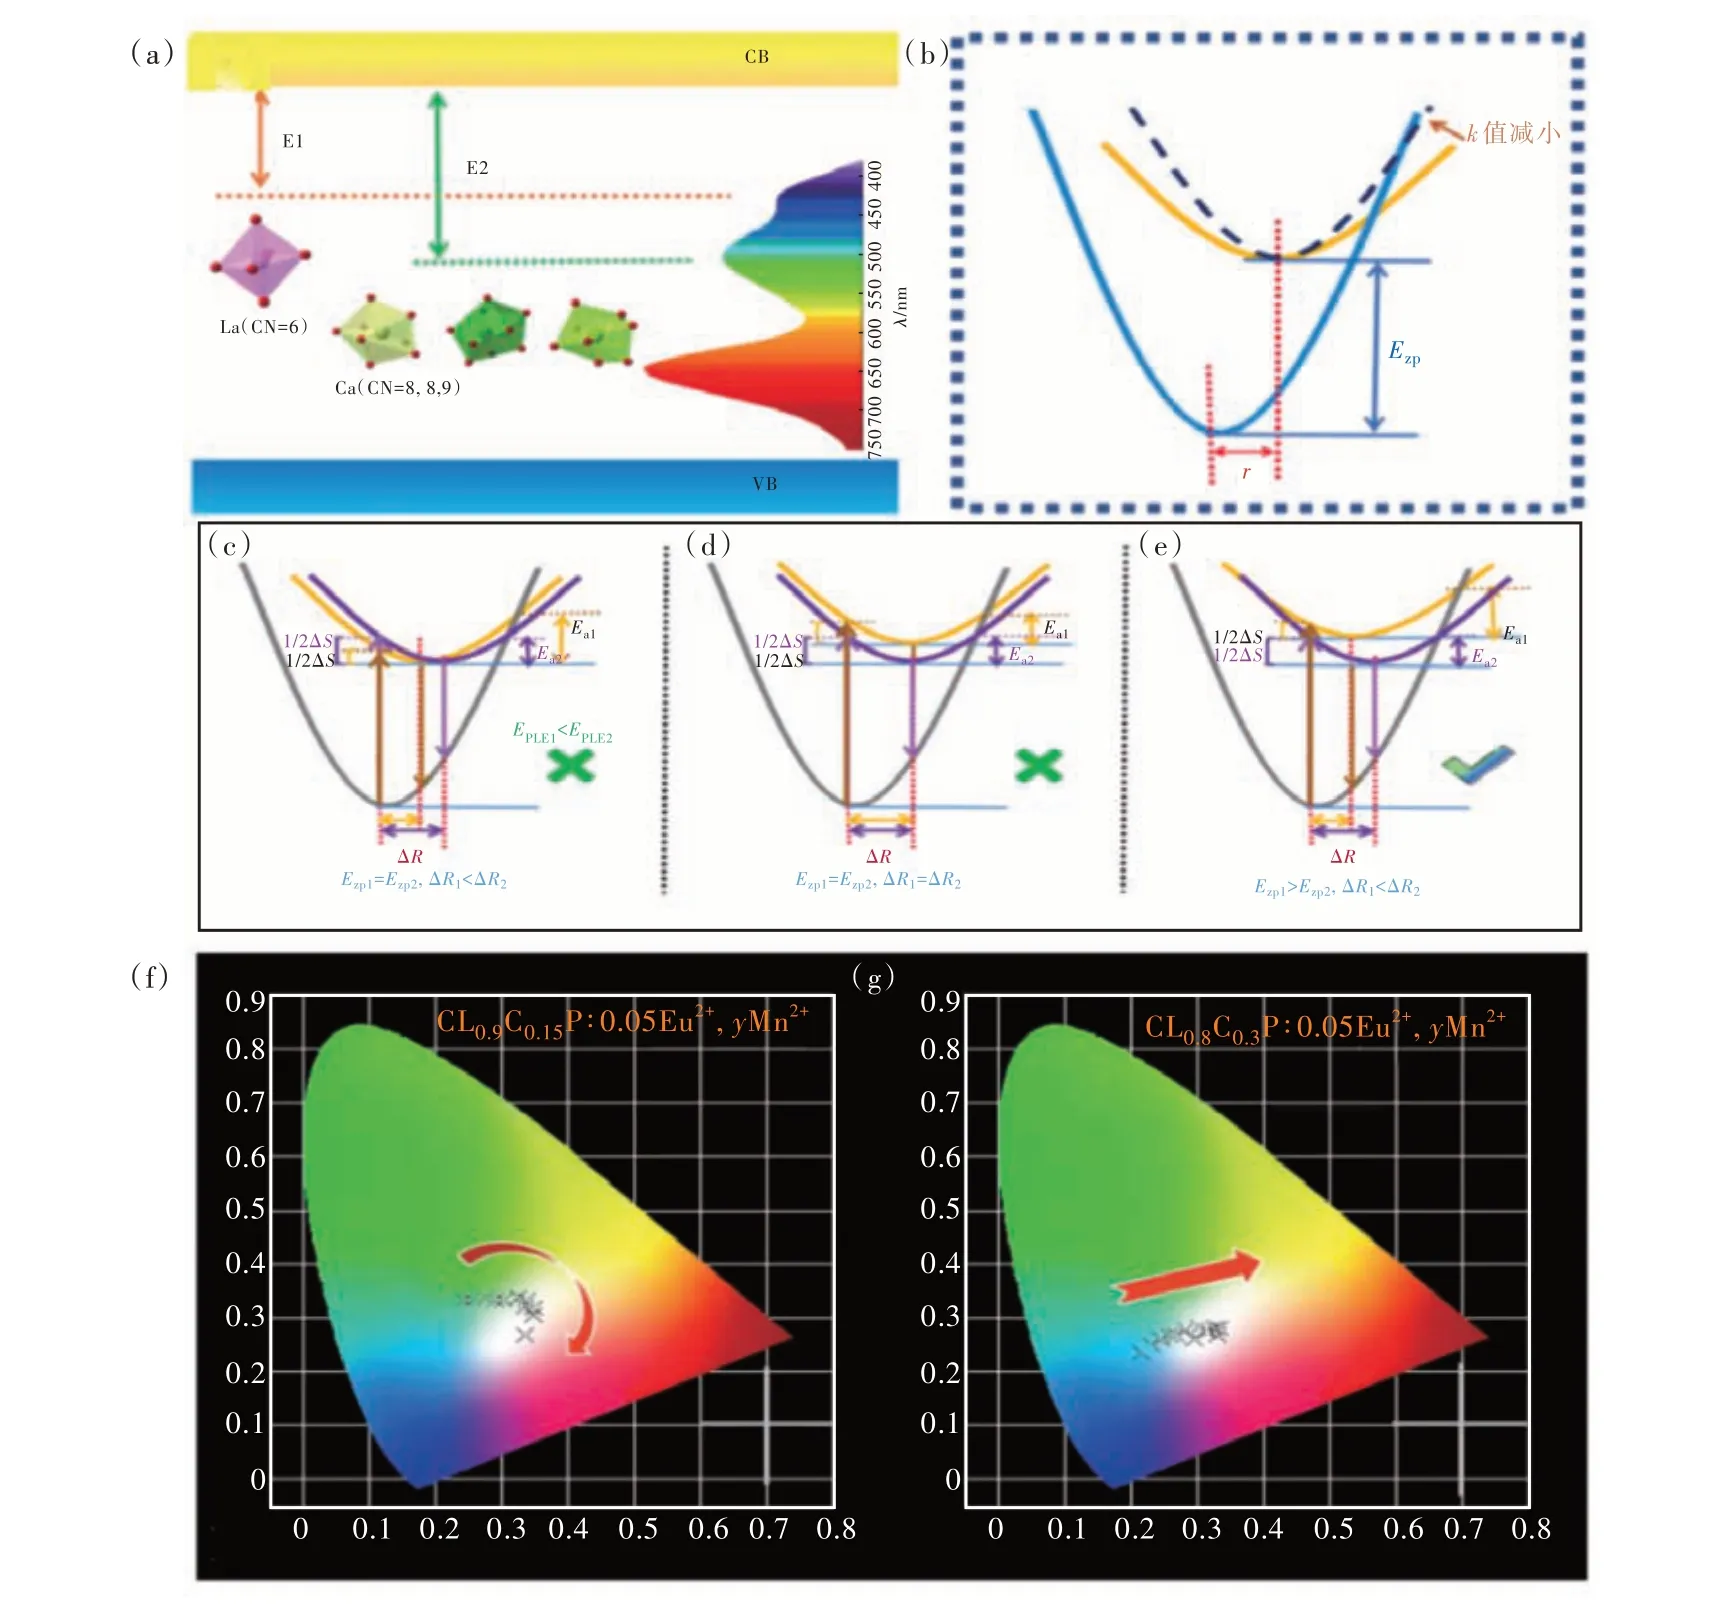
Fig.5 (a)Schematic diagram of the 5d energy level in the forbidden band. (b)Schematic diagram of configuration. The model diagram only decreases ΔR under different circumstances(c); only Ezp enlarges(d);Ezp increases, ΔR decreases(e).CIE of C9L0.9C0.15P∶0.05Eu2+,yMn2+(f) and C9L0.8C0.3P∶0.05Eu2+,yMn2+(g).
ISandIS0are the luminous intensities of the sensitizer Eu2+incorporated with the activator Mn2+and the unincorporated activator Mn2+, respectively. The energy transfer efficiency of Eu2+→Mn2+in C9L0.9C0.15P∶0.05Eu2+,yMn2+is calculated as shown in Tab. S3.The concentration of Eu2+is fixed, the energy transfer efficiency of Eu2+→Mn2+increases with the concentration of Mn2+increasing, and whenx= 0.6, the energy transfer efficiencies reach the maximum 91.9% and 94.1%, respectively. In general, the energy transfer between ions mainly has two mechanisms: exchange interaction and multipolar interaction[17]. The judgment of what is dominant between the two is based on the magnitude of the critical distance(RC). When the critical distance is less than 0.5 nm, the exchange interaction dominates. Conversely, when the critical distance is greater than 0.5 nm, the multipolar interactions predominate[18].The distance between the activator and the sensitizer will gradually decrease with the increase of the concentration of the activator, and when the concentration reaches a certain value, there will be a significant concentration quenching. In order to study the energy transfer mechanism between Eu2+and Mn2+,the critical distance was calculated by equation(4)[19]:
whereχCis the sum of the concentrations of sensitizer and activator,Vrepresents the volume of unit cells, andNis the number of cation lattices that can be replaced by doped ions. For CLCP∶0.05Eu2+,yMn2+, the unit cell volume isV= 3.572 nm3. The quenching concentration of the activator Mn2+is 0.3. The critical distance calculated by the formula is 1.759 nm, which is significantly greater than the maximum critical distance of 0.5 nm[20-21]. Therefore,the energy transfer mechanism is the multipolar interaction.
To further identify the energy transfer mechanism, the formula (5)[22]can be obtained based on Dexter's energy transfer theory[23]and Reisfeld's approximation[24]:
ηS0andηrepresent the luminescent efficiency of the sensitizer Eu2+ion when it is not introduced and after introduction,Cis the sum of the concentration of sensitizer and activator,Ln2+represents Mn2+, and when thenvalues are 6, 8 and 10, they correspond to dipole-dipole, dipole-quadrupole and quadrupolequadrupole interactions, respectively. Usually, the quantum efficiency ratio required in the formula in the actual test is difficult to obtain, hence the ratio of peaks and strengths (IS0/IS) in the emission spectra can be approximated to obtain the equation[25-26]:
ISandIS0indicate the luminous intensity of Eu2+ions with or without Mn2+, respectively. Fig. 3(a) shows the results obtained after fitting, respectively,ntakes 6, 8, 10, which corresponds to the dipoledipole, dipole-quadrupole and quadrupole-quadrupole interactions, respectively. Obviously, the energy transfer mechanism is a dipole-dipole interaction.
In CLCP, the energy level model between the two ions is shown in Fig. 3(b), the outermost electrons of the Eu2+ion are sensitive to the crystal field environment, and the 5d energy levels in different environments show different degrees of cleavage, resulting in emission wavelengths of different sizes.Similarly, the 3d energy level of Mn2+ions will also be affected by the crystal field and the energy level will split, and the energy levels after splitting are4E(4D),2T2(4D),4A1(4G),4T2(4G) and4T1(4G).Eu2+in different grids can simultaneously transfer energy to the 3d level of Mn2+. And changing the matrix does not affect the luminescence of Mn2+ions,and still shows broadband red light emission.
3.3 Temperature Properties and Color Coordinates
Considering that the temperature of phosphors rises when applied to LEDs, we selected the most optimal temperature properties of the sample material wheny= 0.35. The material gradually warmed up from 298 K to 448 K, and in order to make the data as accurate as possible, the test was carried out after 3 minutes at each test temperature point, and the results obtained were shown in Fig. 4(a). It is clear from Fig. 4(b) that the three emission peaks are clearly different. Among them, the emission intensity of Mn2+ions at 650 nm decreased the fastest, and the emission intensity of Eu2+ions at 510 nm decreased at the second rate. The emission at 427 nm,which also belongs to Eu2+, has little change in intensity during the warming process. The ratio of the intensity measured at each temperature to the initial intensity is calculated and shown in Fig. 4(c).Among them, for LED chips, 423 K is usually the highest temperature when it is operating. The intensity of the three emission peaks at this time is 96.1%, 46.6% and 29.4% from shortwave to longwave relative to 298 K. As the temperature increases, the emission intensities change, and the corresponding color coordinates also change. As can be seen from Fig. 4(d), the color coordinates of the sample gradually shift from the low color temperature part to the high color temperature part during the heating process, but remain in the white light range.
Through the test results, it was found that the same matrix was also Eu2+, but showed different temperature quenching behavior at different cells, which we explored. From numerous literatures, temperature quenching usually consists of two mechanisms,one called thermal ionization and the other thermal activation. Thermal ionization refers to the fact that electrons at the 5d excited state energy level are directly reached by the valence band by the action of heat, and electron transfer occurs without returning to the ground state by transition, hence thermal quenching occurs . Thermal activation is when electrons at the 5d excited state level intensify thermal vibration during heating, cross the barrier, and return to the ground state in the form of radiation-free transitions[27]. For the sample studied herein, as shown in Fig. 5(a), when the Eu2+ions are in different lattices, their 5d energy levels are positioned differently relative to the bottom of the conduction band. Eu2+ions in coordination 6 have higher energy emission than Eu2+in coordination 7, 8, 9, and their 5d energy levels are closer to the bottom of the conduction band. If the thermal quenching effect is due to thermal ionization, then the shortwave emission Eu2+should be more prone to thermal quenching due to its closer distance to the bottom of the valence band. In practice, the measured data is quite the opposite. Therefore, we consider that the thermal quenching effect of the sample occurs due to the phenomenon of thermal activation. Fig. 5(b) is a schematic diagram of the configuration diagram, and the relationship can be better understood by using the configuration diagram. The relevant parameters are indicated in the figure. WhereRis the displacement between the central axis of the ground state and the excited state parabola,Ezpis the energy difference between the ground state and the lowest point of the excited state parabola,kis the mechanical constant,and whenkincreases, the parabola narrows.
Blasse has summarized that in a configuration diagram, whenkvalues are the same, three parameters will affect the thermal stability. The three parameters areR,Ezp,hν[28]. Changing any of these quantities, increasingEzpor decreasingRwill increase the barrier at which the radiation-free process occurs, reducing the occurrence of the radiation-free process, thereby showing high thermal stability. In order to clarify the difference between the two emission peaks, using these parameters, several possible scenarios are made under the premise of satisfying the wavelength matching, as shown in Fig. 5(c)-(e). Some of the spectra-relevant data obtained from the actual experiment are listed in Tab. 1 for comparison with Fig. 5(c)-(e) to rule out errors.Data other thanEain the table can be obtained from Fig. S1, for which the activation energy(Ea) at different locations can be calculated using the Arrhenius equation as follows[29-30]:
among them,I0andIare the luminous intensities obtained at the temperature of 298 K and other test temperatures, respectively;Ais a constant that relates only to the matrix;kis the Boltzmann constant,which has a magnitude of 8.617×10⁻⁵eV/K;Tis the thermodynamic temperature. When 1/kTis used as the abscissa and ln(I0/I) is the ordinate, the obtained data are fitted to a straight line, and the slope of the straight line obtained after fitting can be obtained by taking the absolute value. The calculatedEais 0.105 eV and 0.083 eV, corresponding to shortwave emission and longwave transmission, respectively. It shows that the emission peak at 427 nm has better thermal stability, which is the same as the experimental result.
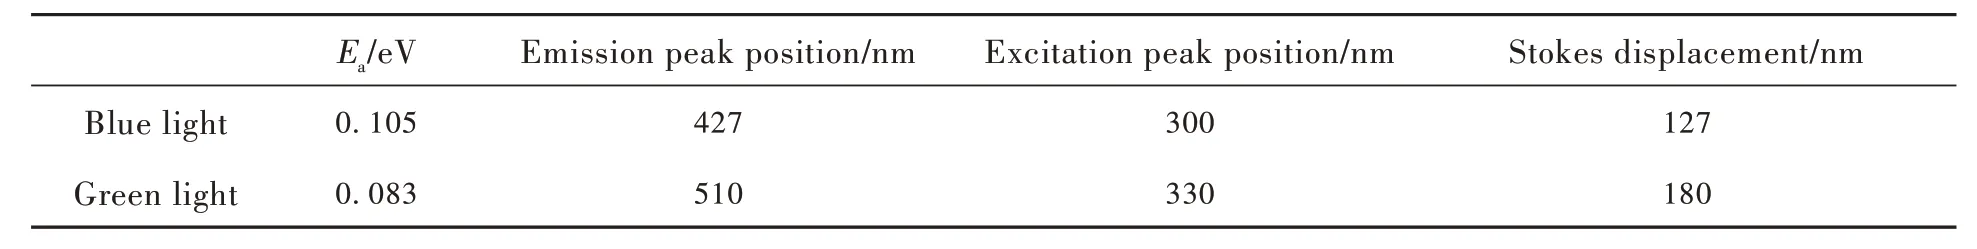
Tab.1 The spectral data
Since the corresponding luminous centers of the two emission peaks are in the same matrix, the default mechanical constantkis the same, that is,the curve of the parabola is the same. As can be seen from Fig. 5(c)-(e), when only ΔRdecreases,it can conform to the fact that blue light has better temperature stability in the experiment, but the corresponding excitation wavelength is not consistent with the actual situation, so this possibility is excluded. When onlyEzpincreases, Stokes displacement does not change, that is, ΔS1=ΔS2, this possibility is also excluded. Only whenEzpincreases andRdecreases can all data be satisfied. To verify the correctness of the hypothetical model, the changes in ΔRas well asEzpare discussed in the data obtained from experiments. From Fig. 5(c)-(e), it can be seen that the magnitude ofEzpdepends on the position of the lowest point of the parabola corresponding to the excited state, that is, the equilibrium state. In numerical relationships, |Ezp|≈|EPLE|-1/2|ΔS|. The blue and green light obtained by using the data in the table correspond to the values of 28 375 and 24 955, respectively. The results show thatEzp1greater thanEzp2, which is consistent with the statement ofEzpin the constructed model.
The offset (ΔR) between the two lowest points of the ground state and the excited state of the two parabolas is related to the degree of rigidity of the crystal lattice. The highly rigid structure corresponds to a small offset. Georgeet ɑl. used the Debye temperature(θD) to represent the rigidity of the lattice, according to the equation[31-32]:
whereAiis the atomic weight of the atom,ћis Planck's constant, andkBis the Boltzmann constant. As can be seen from the formula, the Debye temperature is inversely proportional to the atomic displacement parameter(Uiso). Since the data of the two lattice oxygens are the same, the final result is not affected,and the correspondingUisoof Ca1, Ca2, Ca3 and La is 0.018 1, 0.025 2, 0.024 1 and 0.012 2, respectively. The average atomic shift at the six-coordination site (the light-emitting center corresponding to blue light) is the smallest. A smallerUisocorresponds to a higher Debye temperature, which in turn has a smaller ΔR. This result is the same as the ΔR1<ΔR2 obtained by the model in Fig. 5(e).From the above discussion, it can be concluded that the different temperature quenching behavior of the two emission peaks is caused by difference in local structure at the two lattices.
In order to prove that the difference in temperature quenching behavior, which does not affect the use of white LEDs, the CIE color coordinates of C9L0.9C0.15P∶0.05Eu2+,yMn2+under 330 nm excitation(the corresponding position has been shown in Fig. 5(f) and (g)) and the corresponding color temperature value are calculated in Tab. S4. As can be seen from the figure, as Mn2+gradually increases, the color coordinate position gradually moves from the high color temperature area to the low color temperature area. And when the concentration of Mn2+reaches 0.3, the ultra-wideband white light emission partially covered by full visible light is realized. Especially wheny= 0.35, the color coordinate(0.337, 0.332) of the sample is very close to that of standard white light(0.330, 0.330)and the color temperature(5 239 K) is similar to that of sunlight.
4 Conclusions
In this work, C9L0.9C0.15P∶0.05Eu2+,yMn2+and C9L0.8C0.3P∶0.05Eu2+,yMn2+were synthesized by high temperature solid state method. The use of XRD matching and refinement methods has shown that the introduction of Mn2+does not change the structure of materials. In the emission spectrum,the emission peak intensity of Eu2+and Mn2+still decreased and increased with the increase of Mn2+concentration, indicating that the energy transfer between Eu2+, Mn2+was not affected by the improvement of the matrix. And this claim is proved by the change of life span. According to Dexter's energy transfer theory and Reisfeld's approximation, the energy transfer mechanism between them is obtained.Among them, there is a dipole-dipole interaction between blue light emitted Eu2+and Mn2+, and the energy transfer mechanism between green light emitted Eu2+and Mn2+is dipole-fourth-order interaction to achieve full visible light coverage. After testing the thermal stability of the sample, it was found that the two different color emission peaks of Eu2+show different temperature quenching behavior. Using the bitmap model, it was concluded that the difference is caused by the difference of the local structure of the two sites, which is proved by the refined data. On the contrary, it can be seen from the CIE color coordinate diagram that when the matrix is C9L0.9C0.15P and C9L0.8C0.3P, the change from cyan light or green light to white light can be realized by energy transfer. When the concentration of Eu2+is 0.05, the concentration of Mn2+is 0.35 and the matrix is C9L0.9C0.15P, the color coordinate(0.337,0.332) of the sample is very close to that of standard white light(0.330, 0.330) and the color temperature(5 239 K) is similar to that of sunlight. In addition, the spectral coverage can be covered from 380 nm to 750 nm, so it still has the potential for development in the field of lighting.
Supplementary Information and Response Letter are available for this paper at: http://cjl.lightpublishing.cn/thesisDetails#10.37188/CJL.20230208.
猜你喜欢
昆明理工大学学报·社科版(2023年2期)2023-05-08
昆明理工大学学报·社科版(2023年2期)2023-05-08
Chinese Physics B(2022年10期)2022-10-26
大观(2022年7期)2022-08-18
中国测试(2021年4期)2021-07-16
甘肃社会科学(2021年3期)2021-06-02
校园英语·上旬(2019年4期)2019-05-15
———理学院
西安航空学院学报(2018年1期)2018-02-05
人间(2015年11期)2016-01-09