
Redshift Dependence of the Low-energy Spectral Index of Gamma-Ray Bursts Revisited
2024-01-16 12:18XiaoLiZhangYongFengHuangandZeChengZou
Xiao-Li Zhang, Yong-Feng Huang, and Ze-Cheng Zou
1 Department of Physics, Nanjing University, Nanjing 210023, China 2 School of Astronomy and Space Science, Nanjing University, Nanjing 210023, China; hyf@nju.edu.cn 3 Key Laboratory of Modern Astronomy and Astrophysics (Nanjing University), Ministry of Education, Nanjing 210023, China 4 Xinjiang Astronomical Observatory, Chinese Academy of Sciences, Urumqi 830011, China Received 2023 June 12; revised 2023 July 23; accepted 2023 August 4; published 2023 October 25
Abstract A negative correlation was found to exist between the low-energy spectral index and the redshift of gamma-ray bursts(GRBs)by Amati et al.It was later confirmed by Geng&Huang and Gruber et al.,but the correlation was also found to be quite dispersive when the sample size was significantly expanded.In this study, we have established two even larger samples of GRBs to further examine the correlation.One of our samples consists of 316 GRBs detected by the Swift satellite,and the other one consists of 80 GRBs detected by the Fermi satellite.It is found that there is no correlation between the two parameters for the Swift sample,but there does exist a weak negative correlation for the Fermi sample.The correlation becomes even more significant when the spectral index at the peak flux is considered.It is argued that the absence of the correlation in the Swift sample may be due to the fact that Swift has a very narrow energy response so that it could not measure the low-energy spectral index accurately enough.Further studies based on even larger GRB samples are solicited.
Key words: (stars:) gamma-ray burst: general – methods: statistical – catalogs
1.Introduction
Gamma-ray bursts (GRBs) are the most violent stellar explosions.They were initially discovered in 1967(Klebesadel et al.1973) by the Vela Satellites.Up to now, they have been intensively studied for more than forty years since more and more GRBs are discovered(Qin et al.2021;Yuan et al.2022a;Liu et al.2022).Generally, GRBs are believed to be triggered by the death of massive stars or by the merger of binary compact stars.The empirical correlation between different parameters of GRBs is one of the present interesting objects.For instance, the correlation between Ep(the peak energy)and Eiso(the equivalent isotropic energy), i.e., the so-called Amati relation is investigated by Amati et al.(2002, 2009), Virgili et al.(2012), Azzam & Alothman (2013), Geng & Huang(2013) and Demianski et al.(2017).The correlation between Ep(the peak energy) and Lp(the peak luminosity), i.e., the socalled Yonetoku relation is investigated by Yonetoku et al.(2004), Ghirlanda et al.(2005) and Zhang et al.(2012).Yonetoku et al.(2010)and Tsutsui et al.(2013)have discussed both relations.Furthermore, Wang et al.(2020) has even discussed other more empirical correlations beyond the above relations.
The redshift (z) is an important parameter of GRBs.Many people have studied the relation between z and other parameters.For example, Zhang et al.(2014a) investigated the correlations between z and Liso, Eiso, Ep,rest, Ep,obs(Ep,obs=Ep,rest/(1+z)) (also see Sakamoto et al.2011;Ukwatta et al.2012).Especially, they found a positive correlation between z and Lisofor the Swift GRBs.Wei &Gao(2003)and Zitouni et al.(2014)studied the z–Eisorelation and the z–Lisorelation.Moreover,the relation between z and Lphas also been investigated by many researchers (Lloyd-Ronning et al.2002; Goldstein 2012; Salvaterra et al.2012;Zhang et al.2014b; Zitouni et al.2018).
The low-energy spectral index, α, is also an important parameter that characterizes the prompt emission of GRBs.Geng et al.(2018) have tried to derive the value of α through numerical simulations by considering the synchrotron emission mechanism.Especially, the correlation between α and Ephas been studied by many researchers(Gruber et al.2014;Li et al.2019; Duan & Wang 2020; Li 2022).Tang et al.(2019) also investigated the correlation between α and Eiso.

The structure of this article is organized as follows.A detailed description of the selection of the data sample is provided in Section 2.The correlation between the low-energy spectral index and the redshift, and some other relations between various parameter pairs, are explored in Section 3.Finally, our conclusions and discussion are presented in Section 4.
2.Sample
GRBs detected by Swift and Fermi are used in this study.Two conditions are applied in selecting the appropriate GRBs.First, the redshift of the burst should be available.Second, the spectrum should be well defined.The time-averaged spectra of GRBs are usually fitted with three kinds of functions: a single power-law function, a cutoff power-law function, and the socalled Band Function (Band et al.1993).Most of the GRBs spectra can be well fitted by the Band function, which is expressed as
where E is the photon energy.There are four parameters in this equation: the scaling factor (A), the low- and high-energy spectral indices (α and β, respectively), and the peak photon energy(Ep).In our notation,α and β are positive by using their absolute values.We have collected all the spectrum parameters of those Swift and Fermi GRBs with the redshift measured.
Fermi has a very wide energy band, i.e., 8–35,000 keV.So,Fermi GRBs are usually best fitted by the Band function,which is represented by the lower-energy spectral index (α) and the high-energy spectral index (β).On the other hand, the Swift/BAT detector has a very narrow energy response of 15–150 keV so that Swift GRBs are generally best fitted by a single power-law function or by a cutoff power-law function.In these cases, the derived power-law index could be regarded as a useful representation of the low-energy spectral index(α),since it is measured in the soft γ-ray range.Note that for the Swift GRBs, the β parameter is completely unavailable.
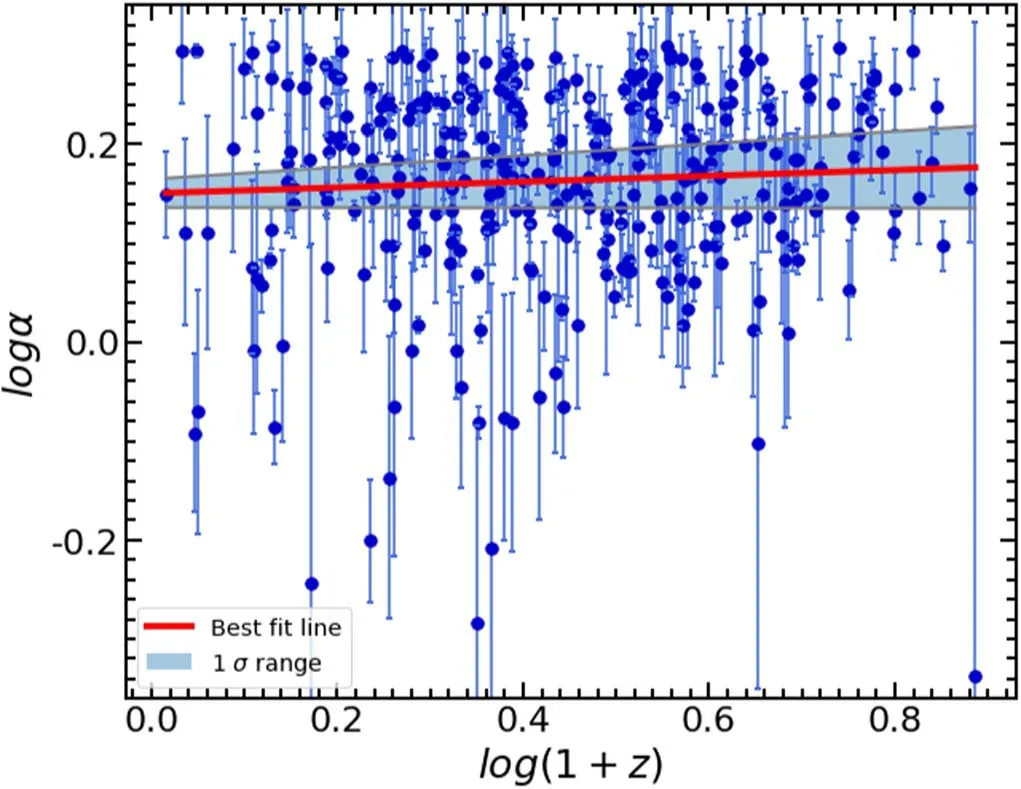
Figure 1.Swift sample on the plane.Here α is the lowenergy spectral index and z is the redshift.The solid line is the best fit result and the shaded region shows the corresponding 1σ range.
For the Swift GRBs, the relevant data are acquired by inquiring on the NASA Swift website.5https://swift.gsfc.nasa.gov/archive/As a result, a total number of 316 GRBs are included in our Swift sample, all of which have the necessary redshift and spectrum data.The time span of these GRBs ranges from 2005 January 26, to 2023 January 16.
For the Fermi GRBs, the data are collected mainly by consulting NASA’s HEASARC(the High Energy Astrophysics Science Archive Research Center) database.6https://heasarc.gsfc.nasa.gov/db-perl/W3Browse/As a useful supplement,24 bursts were taken from Jochen Greiner’s online GRB catalog.7https://www.mpe.mpg.de/~jcg/grbgen.htmlFinally,our Fermi sample consists of 80 GRBs.The time span of these Fermi GRBs ranges from 2008 September 5 to 2018 July 20.
3.Correlations

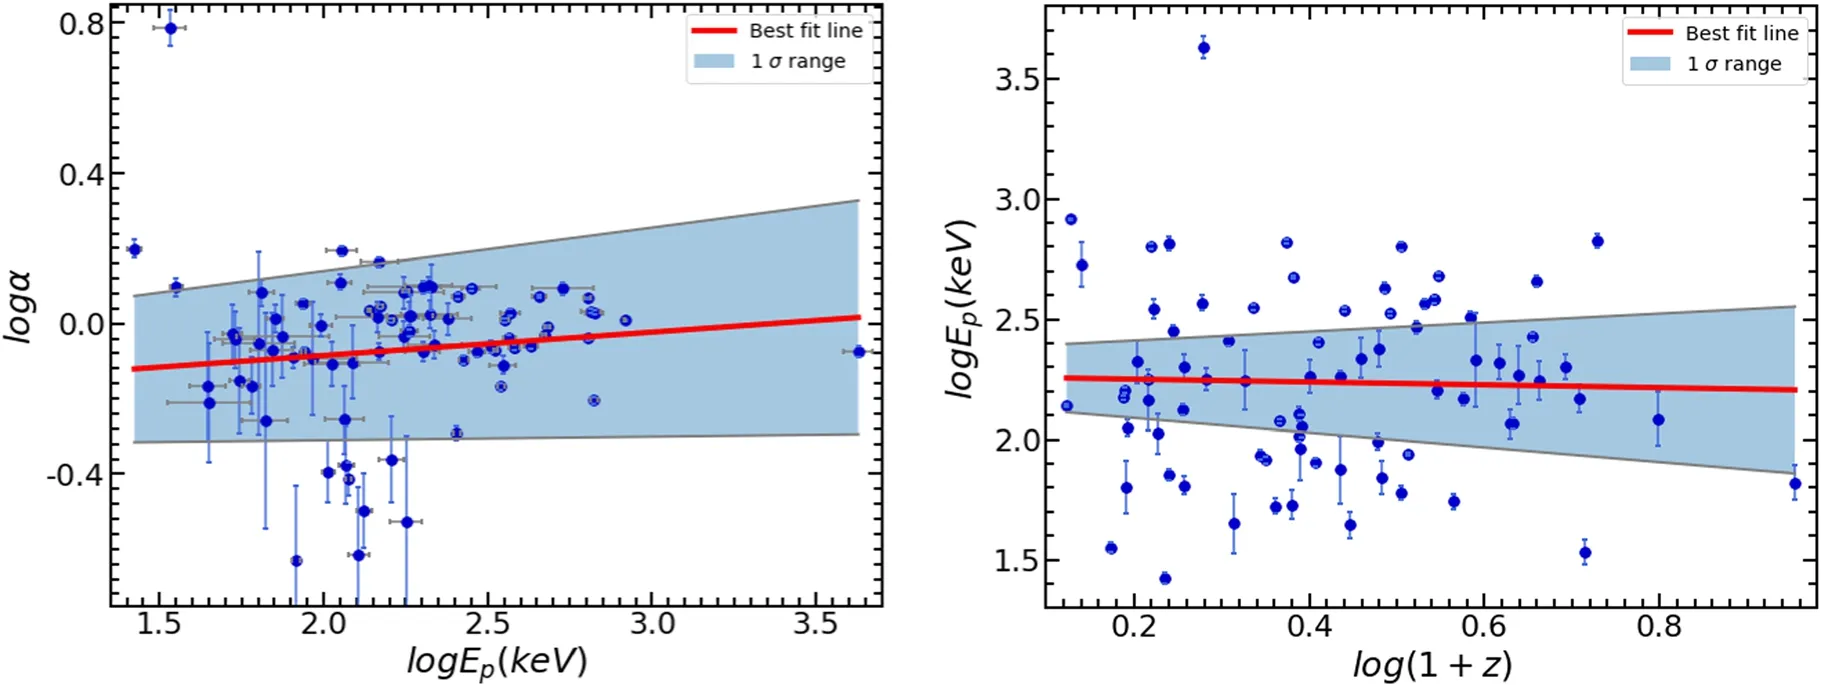
Figure 3.α vs.Ep(left panel)and Ep vs.z(right panel)for the Fermi GRBs.The solid lines correspond to the best fit results to the data points and the shaded regions show the corresponding 1σ ranges.Note that in the left panel,the isolated data point(GRB 120712A)on the top is not included in the linear fit since it is an obvious outlier.

The Fermi GRBs have well-measured Epdata.So, in Figure 3, we plot them on the α −Epplane and the Ep−z plane.We see that there is no obvious correlation either between α and Ep, or between Epand z.The results are also somewhat different from those of previous studies.For example, Geng & Huang (2013) argued that Epand z are positively correlated.Note that GRB 120 712A is again an obvious outlier in this figure and is not included in the fitting procedure.
Since the peak time of the flux is an important stage of a GRB, we have also investigated the features of the peak flux parameters.For this purpose, we could only adopt the Fermi GRB sample, since peak flux parameters are not available for many Swift GRBs.Here, the low-energy spectral index at the peak flux of the burst is denoted as αpeak.Correspondingly,the high-energy spectral index and peak photon energy at the peak flux are denoted as βpeakand Epeak, respectively.
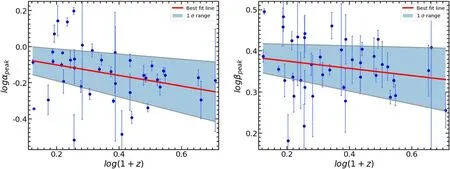
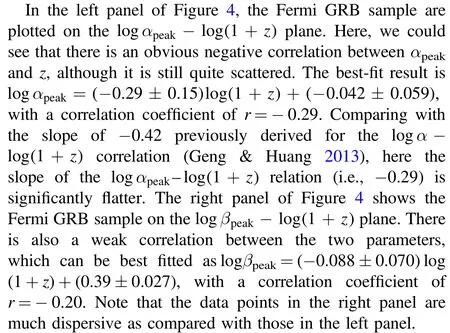
Figure 4.The peak flux spectral indices plotted against the redshift for the Fermi GRB sample.The left panel shows the low-energy spectral index at the peak flux moment(αpeak)vs.the redshift.The right panel shows the corresponding high-energy spectral index(βpeak)vs.the redshift.The solid lines correspond to the best fit results to the data points and the shaded regions show the corresponding 1σ ranges.
Figures 2 and 4 show that there is a weak correlation between the low-energy spectral index and the redshift.Especially, the α–z relation is much less significant than the αpeak–z relation.A natural speculation is that α and αpeakshould be positively connected, then the above two relations should be largely similar.The reason that leads to such a difference thus deserves to be examined.Figure 5 plots α against αpeakfor the Fermi sample.The solid line shows the case when α equals αpeak.We see that α and αpeakare not strictly connected, which could explain their different dependence on the redshift.It reflects the fact that the γ-ray spectrum is highly variable during a GRB.
Figure 6 illustrates the relations between αpeak, Epeak, and z.There is a weak correlation between Epeakand z, which reads
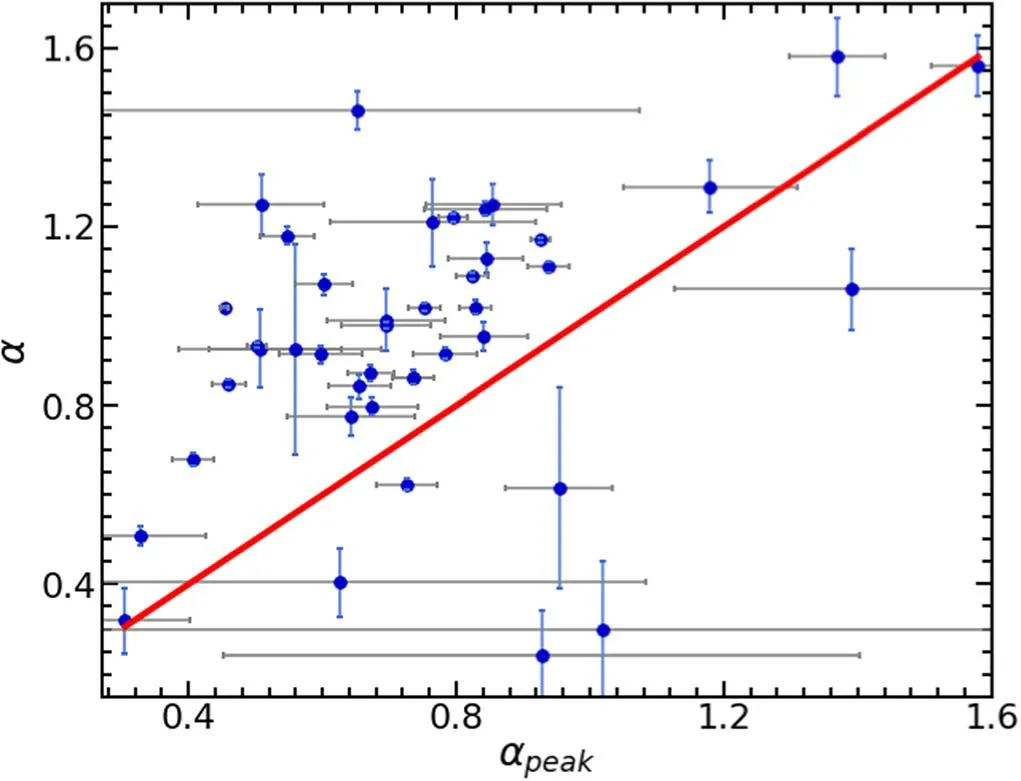
Figure 5.αpeak plotted vs.α for the Fermi GRB sample.The solid line corresponds to the case of α=αpeak.
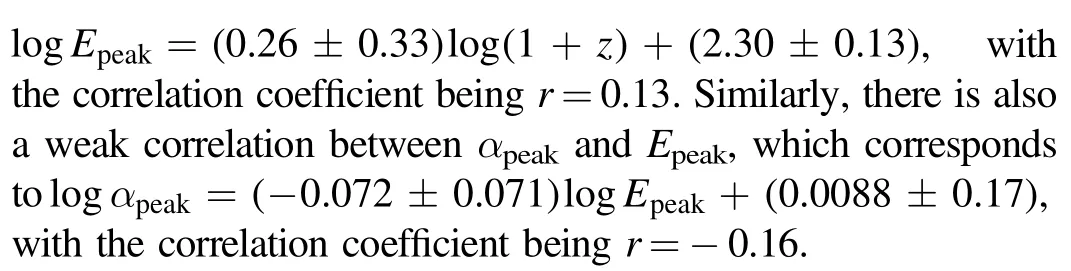
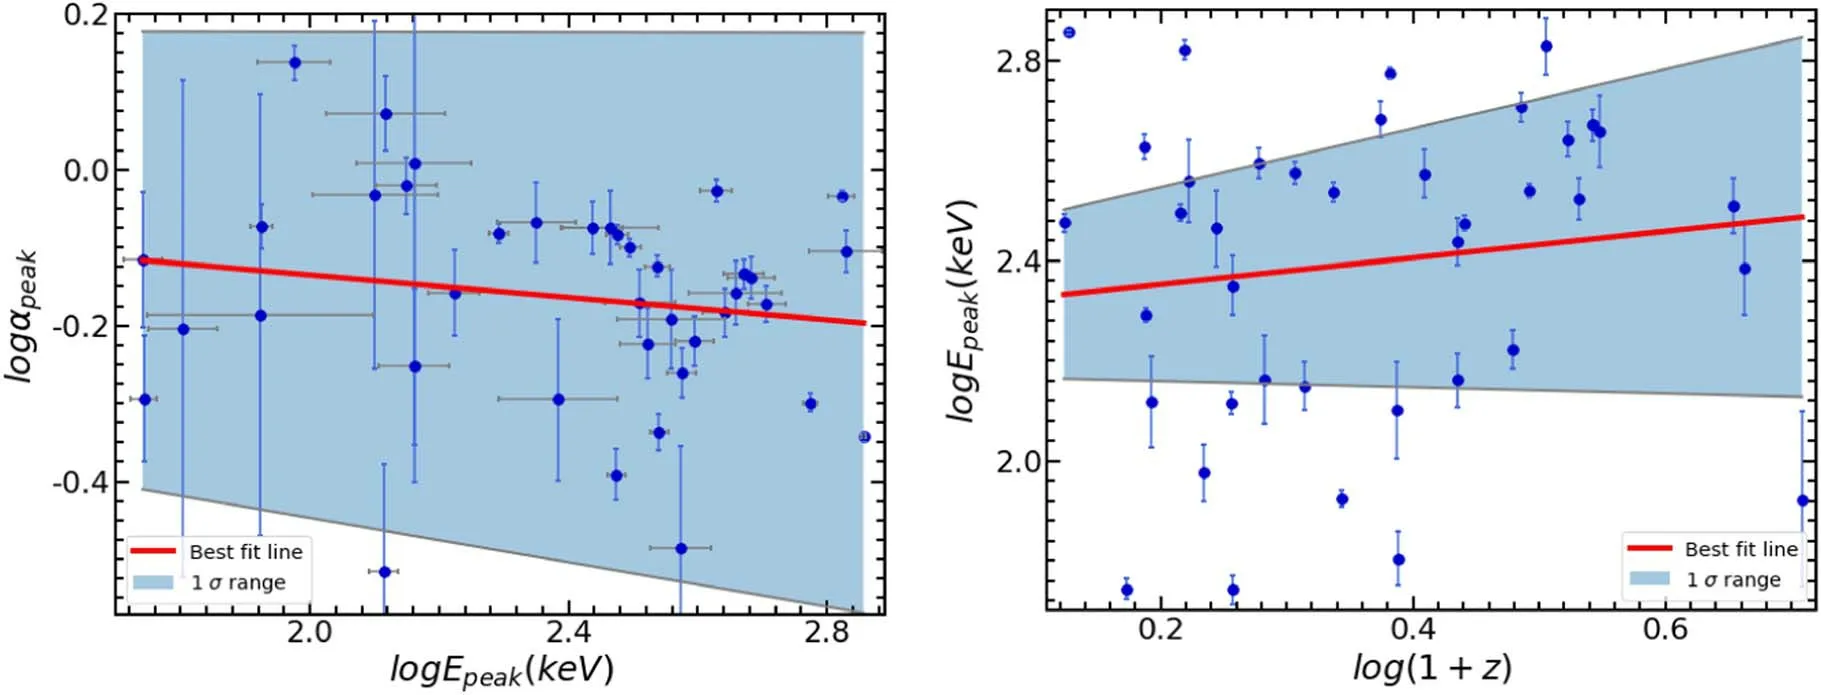
Figure 6.αpeak plotted vs.Epeak(left panel),and Epeak plotted vs.z(right panel)for the Fermi GRB sample.The solid lines correspond to the best fit results and the shaded regions show the corresponding 1σ ranges.
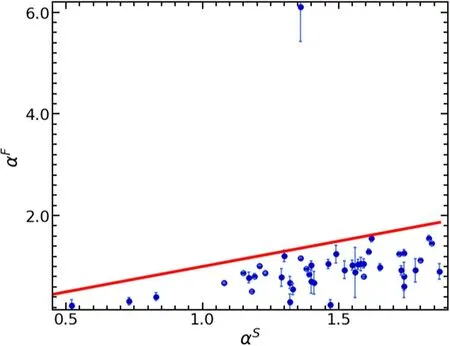
Figure 7.The low-energy spectral index measured by Fermi (αF), plotted vs.the spectral index measured by Swift (αS).Note that only overlapping GRBs between the Fermi sample and the Swift sample are shown here.The solid line corresponds to the case of αF=αS.
Swift/BAT has a relatively narrow passband, i.e.,15–150 keV.Therefore, the measured spectral index should correspond to the low-energy spectral index of the Band function.Some GRBs are simultaneously detected by Swift and Fermi satellites.It is then interesting to know whether the spectral index measured by Swift is consistent with that measured by Fermi.In Figure 7, we have screened out all the overlapping GRBs between the Swift sample and Fermi sample, and compared their spectral indices.Here, αSis the spectral index measured by Swift, while αFis the low-energy spectral index measured by Fermi.We see that αSand αFare not equal for each event.The former is systematically larger than the latter.Also, the data points are quite scattered.For these overlapping GRBs,we have also compared their αSwith their low-energy spectral index at the peak flux as measured by Fermi(αFpeak).The results are shown in Figure 8.Similarly,we see that αSagain is generally larger thanαFpeak.Figures 7 and 8 clearly show that different detectors could generate very different results for the spectrum of even the same GRB,which indicates that acquiring the spectra of GRBs is still a very difficult task.The different α −z correlations of different GRB samples could thus be caused by the systematic distortion in measuring the spectral indices.
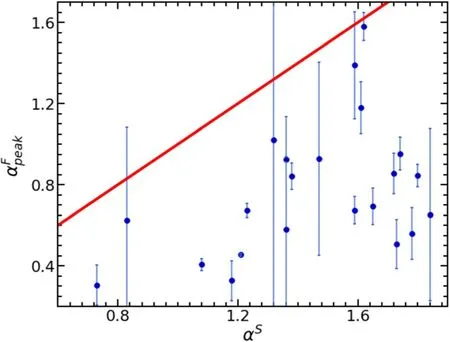
Figure 8.The low-energy spectral index at the peak flux measured by Fermi(αFpeak), plotted vs.the spectral index measured by Swift (αS).Note that only overlapping GRBs between the Fermi sample and the Swift sample are shown here.The solid line corresponds to the case of
4.Discussion and Conclusions
In this study, we use the Swift GRBs and Fermi GRBs to explore the possible correlation between the low-energy spectral index and the redshift.For the Swift GRB sample, it is found that there is no correlation between α and z (see Figure 1).On the other hand, there is a weak correlation between α and z for the Fermi GRB sample(see Figure 2).The correlation is even more obvious when the peak flux spectrum is considered, i.e., when αpeakis plotted versus z (Figure 4).The different features of the two samples may be caused by the different energy responses of the two detectors.The energy band of Fermi is very wide(8–35,000 keV),which ensures that it can present a much better description of the spectra of the detected GRBs.However, the Swift/BAT has a very narrow energy response(15–150 keV).As a result,the spectra of Swift GRBs are usually best fitted by a single power-law function or by a cutoff power-law function.In these cases, the power-law spectral index may significantly deviate from the true lowenergy spectral index.This conjecture was confirmed when the spectra of the overlapping GRBs of the two samples were scrutinized.It is found that when a GRB is simultaneously detected by both Fermi and Swift, then the spectral index reported by Swift is usually quite different from the low-energy spectral index (α) reported by Fermi (Figures 7 and 8).It reflects the difficulty in spectral observations of GRBs.
Acknowledgments
This study was supported by the National Natural Science Foundation of China (grant Nos.12233002, 12041306,12147103, and U1938201), by the National SKA Program of China (No.2020SKA0120300), by the National Key R&D Program of China (2021YFA0718500), and by the Youth Innovations and Talents Project of Shandong Provincial Colleges and Universities (grant No.201909118).
ORCID iDs
 Research in Astronomy and Astrophysics2023年12期
- Research in Astronomy and Astrophysics的其它文章
- Large-scale Dynamics of Line-driven Winds with the Re-radiation Effect
- A Study of Elemental Abundance Pattern of the r-II Star HD 222925
- Preliminary Study of Photometric Redshifts Based on the Wide Field Survey Telescope
- Solar Observation with the Fourier Transform Spectrometer.II.Preliminary Results of Solar Spectrum near the CO 4.66μm and MgI 12.32μm
- Density Functional Theory Calculations on the Interstellar Formation of Biomolecules
- Detection Capability Evaluation of Lunar Mineralogical Spectrometer:Results from Ground Experimental Data