
Correcting the Contamination of Second-order Spectra: Improving Hα Measurements in Reverberation Mapping Campaigns
2024-01-16 12:10WenZheXiKaiXingLuHaiChengFengShaShaLiJinMingBaiRuiLeiZhouHongTaoLiuandJianGuoWang
Wen-Zhe Xi, Kai-Xing Lu,Hai-Cheng Feng, Sha-ShaLi,Jin-Ming Bai, Rui-Lei Zhou,Hong-Tao Liu,andJian-Guo Wang
1 Yunnan Observatories, Chinese Academy of Sciences, Kunming 650011, China; hcfeng@ynao.ac.cn 2 University of Chinese Academy of Sciences, Beijing 100049, China 3 Key Laboratory for the Structure and Evolution of Celestial Objects, Chinese Academy of Sciences, Kunming 650011, China; lukx@ynao.ac.cn 4 CAS Key Laboratory of FAST, National FAST, National Astronomical Observatories, Chinese Academy of Sciences, Beijing 100101, China Received 2023 May 1; revised 2023 September 14; accepted 2023 October 7; published 2023 November 27
Abstract Long-term spectroscopic monitoring campaigns on active galactic nuclei(AGNs)provide a wealth of information about its interior structure and kinematics.However,a number of the observations suffer from the contamination of second-order spectra (SOS) which will introduce some undesirable uncertainties at the red side of the spectra.In this paper,we test the effect of SOS and propose a method to correct it in the time domain spectroscopic data using the simultaneously observed comparison stars.Based on the reverberation mapping (RM) data of NGC 5548 in 2019, one of the most intensively monitored AGNs by the Lijiang 2.4 m telescope, we find that the scientific object,comparison star,and spectrophotometric standard star can jointly introduce up to ∼30%SOS for Grism 14.This irregular but smooth SOS significantly affects the flux density and profile of the emission line, while having little effect on the light curve.After applying our method to each spectrum,we find that the SOS can be corrected effectively.The deviation between corrected and intrinsic spectra is ∼2%, and the impact of SOS on time lag is very minor.This method makes it possible to obtain the Hα RM measurements from archival data provided that the spectral shape of the AGN under investigation does not have a large change.
Key words: techniques: spectroscopic – methods: data analysis – galaxies: individual (NGC 5548) – (galaxies:)quasars: emission lines
1.Introduction
Active galactic nuclei (AGNs), one of the most luminous objects in the universe, are powered by gas accretion onto supermassive black holes (SMBHs).Broad emission lines are the most prominent feature of AGNs providing important information to study the physical properties of SMBH and its surroundings.In the context of the unified model (Antonucci 1993), the broad emission lines originate from the broad line region (BLR) located at thousands gravitational radii away from the central SMBH, and are broadened by the Doppler motions of clouds in BLR under the strong gravitational field of SMBH.According to the photoionization model, broad emission lines are driven by the central ionizing source.Analyzing the delayed response [or time lag (τ)] of the broad emission lines to the continuum variations will provide information on the scale and structure of BLR, and the mass of SMBH can be derived by
wherefBLRis a virial factor determined by the geometry and kinematics of the BLR gas,RBLRis the responsivity weighted radius of the BLR which is derived by=τ×c(c is the speed of light), and v is a measurement of velocity of clouds,e.g.,FWHM(vFWHM)or the“line dispersion”(σline; see Peterson et al.2004, and references therein).This way is called reverberation mapping (RM; Blandford & McKee 1982;Peterson 1993), more details about the parameters are well introduced by Du et al.(2014).
As the number of RM experiments increased, it is gradually found thatRBLRusually showed tight correlation with continuum luminosity (L) whereRBLRand L are usually measured from Hβ emission line and monochromatic luminosity at 5100 Å (Kaspi et al.2000; Denney et al.2010; Bentz et al.2013), respectively.Consequently, the mass of SMBH can be estimated using single-epoch spectrum which is convenient to large spectral surveys such as the Sloan Digital Sky Survey(SDSS; e.g.,Shen et al.2014).For high quality RM data, it is possible to reconstruct the kinematics and geometry of BLR via velocity-resolved timelag (De Rosa et al.2018; Feng et al.2021a; Li et al.2022;Villafaña et al.2022)because the velocity and lag of a cloud are determined by its position in BLR.While RM technique is simple and widely used in the literature, it based on two fundamental assumptions that BLR clouds are photoionized by the central ionizing source and dominated by gravity of the central SMBH (Peterson 1993), which needs to be certified by observational evidence.The photoionization model also predicts a stratified radial structure of the BLR due to ionization energy and optical depth,indicating that we can compare the lags and velocities of different emission lines to valid the two assumptions (e.g.,τ∝vF2WHMrelationship; Fausnaugh et al.2017).Multi-line RM is therefore an alternative avenue for the study of ionization and virialization properties in BLR.
So far, about 100 AGNs have been successfully measured the mass of SMBHs by the RM method(e.g.,Bentz et al.2010;Hu et al.2021),but most of them focused on Hβ,leading to an Hβ basedrelationship.This makes it difficult to investigate the multi-line properties.Moreover, Hβ emission line will be failed in some cases such as type 1.8/1.9 AGNs(Osterbrock 1981) or infrared spectra of some high redshift sources.Hα is the strongest optical emission line at low z and it is less blended with the optical Fe II resulting in a higher signalto-noise ratio(S/N)and more reliable profile measurements.In some AGNs with the weak broad emission feature, Hα is usually the only detectable optical broad line (e.g., type 1.9 AGNs), suggesting that it is important to investigate the properties of Hα emitting regions.Unfortunately, less than 20 AGNs have been reported Hα RM results (e.g., Bentz et al.2010), and only several of them have velocity-resolved measurements (Bentz et al.2010; Feng et al.2021a).Thus, it is necessary for new spectroscopic monitoring programs to expand the Hα RM sample.It is not easy to achieve this goal in short term because RM observations are very time consuming.Considering the fact that most of previous reverberation experiments focused on the local(z<0.3)AGNs,it is possible to observe Hα in some sources (e.g., SEAMBH project; Du et al.2014).We might utilize these data to obtain the Hα lags,and even analyze the velocity-resolved lags.
Since previous observation strategies are primarily designed to optimize for Hβ, Hα might suffer from some observational effects.For example, the telluric absorption at wavelength larger than 6800 Å,which would significantly contaminate Hα emission line,were often ignored.Furthermore,most Hβ-based observations usually adopted relatively bluer spectrographs(e.g., Lu et al.2019), which might cause the second-order spectrum (here after SOS) to superimpose around Hα wavelength.The telluric absorption can be corrected by theoretical telluric absorption spectra (Kausch et al.2015) or supplementary observations of a telluric standard star, though both methods can be affected by changes in the weather conditions.The contamination of SOS is usually solved via a dichroic filter which can divide red and blue lights into separate channels (e.g., Oke & Gunn 1982), or an order-blocking filter which can block the UV/blue photons(e.g.,Feng et al.2020).However, previous Hβ-based RM campaigns rarely adopted either of the two observation schemes.If we can precisely obtain the atmospheric profiles in real time, both telluric absorption and SOS will be accurately corrected.Although most observatories do not provide the information,we can still correct Hα data in this way when there are simultaneously observed comparison stars.As the object and comparison star are under the same weather conditions (e.g., airmass, seeing,clouds, etc.).In fact, there were indeed some previous RM campaigns that used comparison stars for flux calibration(e.g.,Maoz et al.1990;Kaspi et al.2000;Du et al.2014;Feng et al.2021b; Hu et al.2021).Thereby, it is possible to extract Hα RM results from archival data.It has been proved that the telluric absorption can be well corrected by a comparison star(Feng et al.2020; Lu et al.2021), while the SOS still requires effort.
Starting in 2012 October,a large RM project(Du et al.2014)was carried out on the 2.4 m telescope located at Lijiang,aimed at increasing the RM number of AGNs with high Eddington ratio.The project has monitored ∼50 AGNs and most of them also observed Hα emission line.The varying degrees of contamination by SOS in these spectral data motivated us to investigate this effect.
The paper is organized as follows.In Section 2, we present the correction method of SOS.Application to NGC 5548 is presented in Section 3.Discussion is in Section 4, and we summarize results in Section 5.
2.Method
Flux calibration strategy based on a comparison star is commonly used for spectroscopy monitoring projects (e.g.,Maoz et al.1990;Kaspi et al.2000;Feng et al.2021a).In some RM campaigns, there are several nearby comparison stars within 1°of targets that are simultaneously observed by multislit (Williams et al.2021) or fibers (Shen et al.2016), while others can only obtain one single comparison star (Du et al.2014; Lu et al.2022).Due to the identical observation conditions of target and comparison star, this approach can achieve high-accuracy relative flux calibration even during poor weather.For most previous Hβ-focused spectra, the flux calibration generally consists of the following steps:
1.The absolute flux calibration of each comparison star was performed using the spectrophotometric standard star.
2.A fiducial spectrum of the comparison star is generated by combining the spectra observed in clear nights.
3.Each comparison spectrum is compared to the fiducial spectrum to derive sensitivity functions which can be directly used to calibrate flux of the target.
However, the above process cannot correct the SOS contributions because the standard star, comparison star, and object all introduce different contamination.
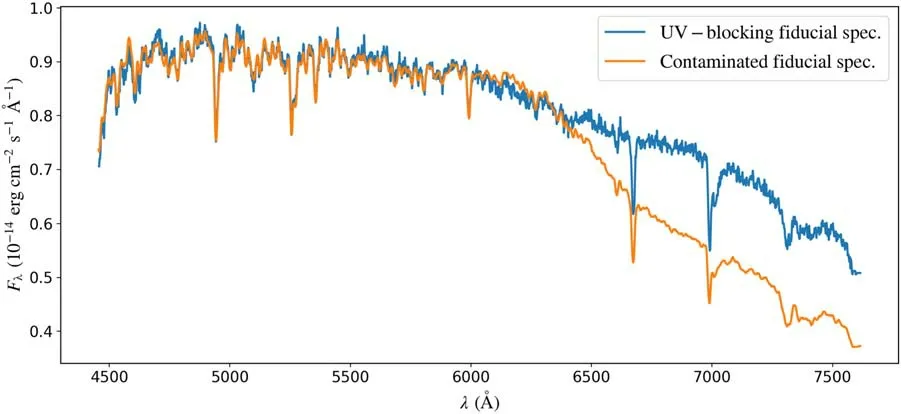
Figure 1.Fiducial spectrum of the comparison star for NGC 5548.The orange line is the contaminated spectrum generated from an 81 days observation with contamination starting from 6300 Å.The blue line is the uncontaminated fiducial spectrum generated from a 7 days observation with a UV-blocking filter.
In order to correct the contamination of SOS, we start with the calibrated flux of object
where Ocouand Ccouare the observed spectra (in counts) of object and comparison star, respectively, Cfidis the fiducial spectrum of comparison star that can be expressed as
where E(λ) is the extinction curve of the observatory, ACand ASare the airmass of comparison star and standard star,respectively, Sintand Scouare the intrinsic and observed spectrum of standard star, respectively.If the spectrum is not affected by the SOS,Cfidis equal to its intrinsic spectrum(Cint).Combining Equations (2) and (3), we can find that the contamination of SOS of object is a mixture of the comparison star, standard star, and itself.Moreover, the atmospheric extinction varies with wavelength and weather, complicating the final SOS even further.Figure 1 shows the fiducial spectra of the comparison star that are produced by the spectra with(orange) and without (blue) SOS, respectively.The wavelengths in all figures are in observed-frame since this facilitates readers to estimate the observed influences of the SOS on other targets.There is a clear irregular shape in the red side of spectrum, and then propagate to the object during the relative flux calibration.We note that this effect only exists in term Cintof Equation(2).Thus,we can avoid the SOS of standard star if we already have Cint, which can be easily obtained with only one observation on a clear night.After that,only Ocouand Ccoustill contribute contamination of SOS in Equation (2).In principle, correcting for this effect requires knowledge of instrument information and exact weather conditions.This would be very complicated and almost impossible to achieve.
A plausible approach is to assume that the spectral shape of AGN is constant during the monitoring period.Although many observations show that there is a bluer-when-bright phenomenon in radio-loud AGNs (e.g., Dai et al.2021; Fang et al.2022; Negi et al.2022), the assumption is still reasonable because (1) the RM projects usually focus on radio-quiet sources, and (2) the spectral index generally varies within a narrow range.Then, we can derive that the ratio of the comparison star and object intrinsic spectra should be constant at any two wavelengths (i.e., λ1and λ2)
Besides,the SOS efficiencies(η)of comparison star and object should be consistent with each other due to the identical weather conditions and instrument, i.e., there SOS can be expressed as
Combining Equations (4), (5), and (6), we can obtain that the ratio of the comparison star SOS to the intrinsic flux density should be proportional to that of the object
This means that the SOS of object can be derived from the comparison star.To measure the SOS of comparison star in each epoch,we decompose the spectrum into first-and secondorder components (i.e., Ccou1and Ccou2) and calculate a sensitivity function using two windows of line-free regions around Hα absorption lineIn principle, if the SOS is smooth, then the flux of continuumsubtracted absorption line should not be contaminated by SOS.However, after rewriting the two components to 1+Csos(λ)/Cint(λ) by dividing Ccou1, the sensitivity test will introduce a fraction of SOS to the calibrated Hα absorption flux
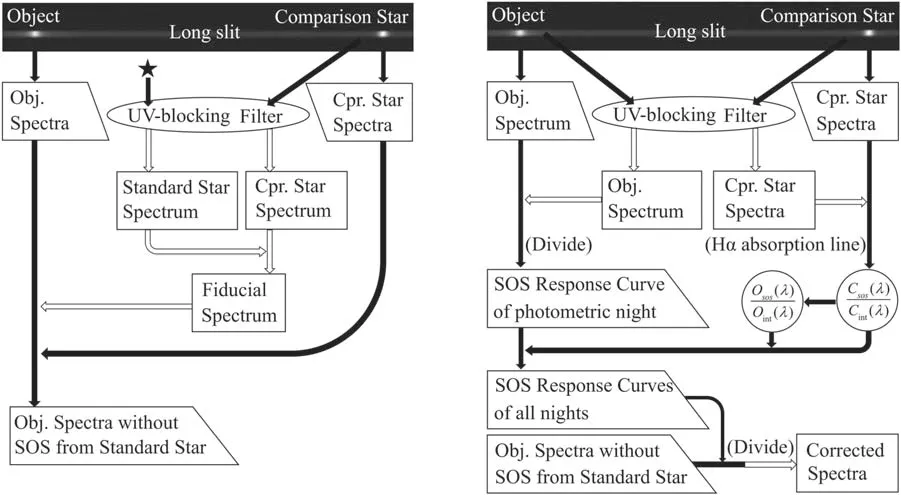
Figure 2.A flowchart for the method.Trapezoidal text boxes and black arrows represent for spectra contaminated by SOS.Oblong text boxes and white arrows represent for spectra without the contamination of SOS.The black five-pointed star is the standard star for absolute flux calibration.
where Fintis the intrinsic flux of Hα absorption line which can be measured from a non-SOS spectrum.Note that this pertains only to the SOS under the assumption of a smooth SOS.Csos(λ)/Cint(λ)represents the ratio of the superimposed SOS of the comparison star,from which we can derive Osos(λ)/Oint(λ)and consequently, obtain the corrected spectra of the scientific object.Figure 2 is a flowchart to illustrate our correction scheme.Although Equations (4) and (7) suggest that the relative change of SOS at different wavelengths should be consistent with each other, this still requires observations to confirm, and we also need to examine the shape of the SOS.
In general, to apply the method to existing time-domain observational data, we need to re-observe the uncontaminated standard, comparison and object on a photometric night.This will yield a reliable fiducial spectrum of the comparison star and one response function that represents the SOS contamination of the object/comparison star pair for each day, taking advantage of the strategy that observing a nearby comparison star simultaneously.
3.Application to NGC 5548
The Yunnan Faint Object Spectrograph and Camera(YFOSC), equipped with a series of grisms, long slits and filters, is a versatile instrument for spectroscopy and photometry mounted on the 2.4 m telescope.Before 2018, the ultraviolet-blocking (UV-blocking) filter that was usually used to block the SOS overlapping on the scientific spectrum was not equipped in YFOSC, so the spectral regions where contaminated by SOS in archive spectra (here after contaminated spectra) were not well considered.For example,NGC 5548 was well monitored by a long-term RM campaign utilizing the Lijiang 2.4 m telescope to probe the BLR evolution.Lu et al.(2022)performed a five-season observation and published the RM results of broad Hγ,Hβ and Helium line,while the broad Hα line was not considered because the Hα region was contaminated by SOS.In this section, we apply above method to eliminate the overlapped SOS from NGC 5548 data observed in 2019.So that we can obtain the intrinsic spectrum, then compare the resulting light curve of broad Hα line before and after eliminating SOS,to estimate the impact of SOS on the time series.
3.1.Observation and Data Reduction
As described in Section 2, constructing the uncontaminated fiducial spectrum is the core step for eliminating the overlapping SOS from the scientific data.During the RM spectroscopic monitoring of NGC 5548 in 2019, we selected a photometric night (JD=2458465), and performed a spectroscopic observation adding a UV-blocking filter to obtain the UV cut-off spectra of NGC 5548 and its comparison star.Because the filter cuts off at approximately 4150 Å,the spectra at wavelength below 8300 Å were not affected by SOS.Then a spectrophotometric standard star (G191-B2B) was also observed with the UV-blocking filter in the nearby sky, which is used to generate the UV-blocking fiducial spectrum.In addition, we carried out six spectroscopic observations after RM observation in the six nights, and obtained extra UV cutoff spectra of NGC 5548 and its comparison star, which are used to check the validity of our designed method.
Following the work of Lu et al.(2022), we reduced the the UV cut-off spectra using standard IRAF version 2.16 routines.The primary routines include bias subtraction, flat-field correction,wavelength calibration,and cosmic-ray elimination.Standard neon and helium lamps were used for wavelength calibration.The one-dimensional was extracted with aperture ofVarying seeing and mis-centering usually leaded to wavelength shifts and we used the [O III] λ5007 line as the wavelength reference with the interpolated cross-correlation function (ICCF).
3.2.Eliminating the Contamination of SOS
From the UV-blocking spectroscopic observation in the photometric night, we generated the UV-blocking fiducial spectrum through the calibration process of spectral flux using the UV cut-off spectra of standard star.Meanwhile, we obtained a contaminated fiducial spectrum from the contaminated spectra observed in 2019 RM campaign.The term“contaminated” means that the spectrum are overlapped by SOS because of the lack of the UV-blocking filter.Figure 1 clearly shows that the spectrum at the regions of wavelength larger than 6300 angstrom are contaminated by SOS.This means that if the scientific spectrum is calibrated by the contaminated fiducial spectrum, we cannot obtain the intrinsic spectrum in the regions overlapped by SOS.In this section,we use the method described in Section 2 to construct the intrinsic spectrum for the contaminated spectra of NGC 5548 observed in observing season of 2019 (Lu et al.2022).
Following the method described in Section 2, we first obtained the contaminated sensitivity function by comparing the observed spectrum of the comparison star in each exposure to the UV-blocking fiducial spectrum.Then this sensitivity function was applied to calibrate the contaminated spectrum of NGC 5548 observed during the nights when we conducted the UV-blocking spectroscopic observations.At the same time,we generated a UV cut-off sensitivity function and used it to calibrate the UV cut-off spectrum of NGC 5548, resulting in the UV-blocking spectrum.This step helped us to eliminate the contamination from the standard star, and the UV-blocking spectrum contains no SOS at all.To obtain Fcalin Equation(9),we used a compound model consisting of a linear and a Gaussian model to fit the spectra of the comparison star near the Hα absorption band.From Equations(7)to(9),we derived Ososand Csosand computed one response factor for each night which represents the ratio of the night to the photometric night in terms of the response functions of SOS.The response function of the contamination from the object/comparison pair in photometric night was generated by the two calibrated spectra obtained in the last step.Then,together with the factor,the corrected spectra of NGC 5548 in the six days were finally derived.
Panel(a)of Figure 3 shows the spectra of NGC 5548 for one day, with the UV-blocking and corrected spectrum shown in blue and green, respectively.The contaminated spectrum,which was calibrated ignoring SOS, is shown in orange.Panel(b) gives the ∼2% deviations between the corrected spectrum and the UV-blocking spectrum, which demonstrates that the contaminated spectrum is well corrected by our designed method.Results of the five days are presented in Figure 4,where the deviations are also negligible (there were clouds in the Julian date 2458635).These results indicate that our method of processing contaminated data was successful in producing results that were nearly identical to the UV-blocking spectra.Therefore, we proceeded to apply this correction method to the 81 contaminated spectra.
3.3.Comparison
We generated the mean contaminated and corrected spectrum of the 81 spectra and displays them in Figure 5.Panel(a)of Figure 3 also presented the contaminated spectrum and its deviation from the UV-blocking spectrum shown in Panel(c).These figures revealed that the impact of SOS on the absolute spectral flux can be up to 30%.
We generated Hα light curves using both the contaminated and corrected spectra to assess the impact of SOS.Light curves of the continuum(rest-frame 5100 Å)and the Hβ emission line are also presented as references because they are not affected by SOS.However, the contaminated Hα line does not exhibit the typical spectral shape.Therefore, we measured the light curve using integration rather than spectral decomposition.This approach was also employed for the other two light curves for comparison.
To measure the continuum light curve, we calculated the median value between 5090 and 5110 Å.For the Hα emission line, we inspected the mean spectra and confirmed the red,blue, and integral window as 6180–6250 Å, 6880–6850 Å and 6400–6700 Å,respectively.We used the red and blue windows for continuum fitting, and then integrated flux of the emission line in the integral window after subtracting the fitted continuum.As for Hβ, the windows were 4500–4520 Å,5090–5100 Å and 4700–4920 Å,respectively.The light curves were presented in Figure 6.It is evident from the figure that the two Hα light curves exhibit a similar shape,indicating that the impact on time-lag is negligible.
4.Discussion
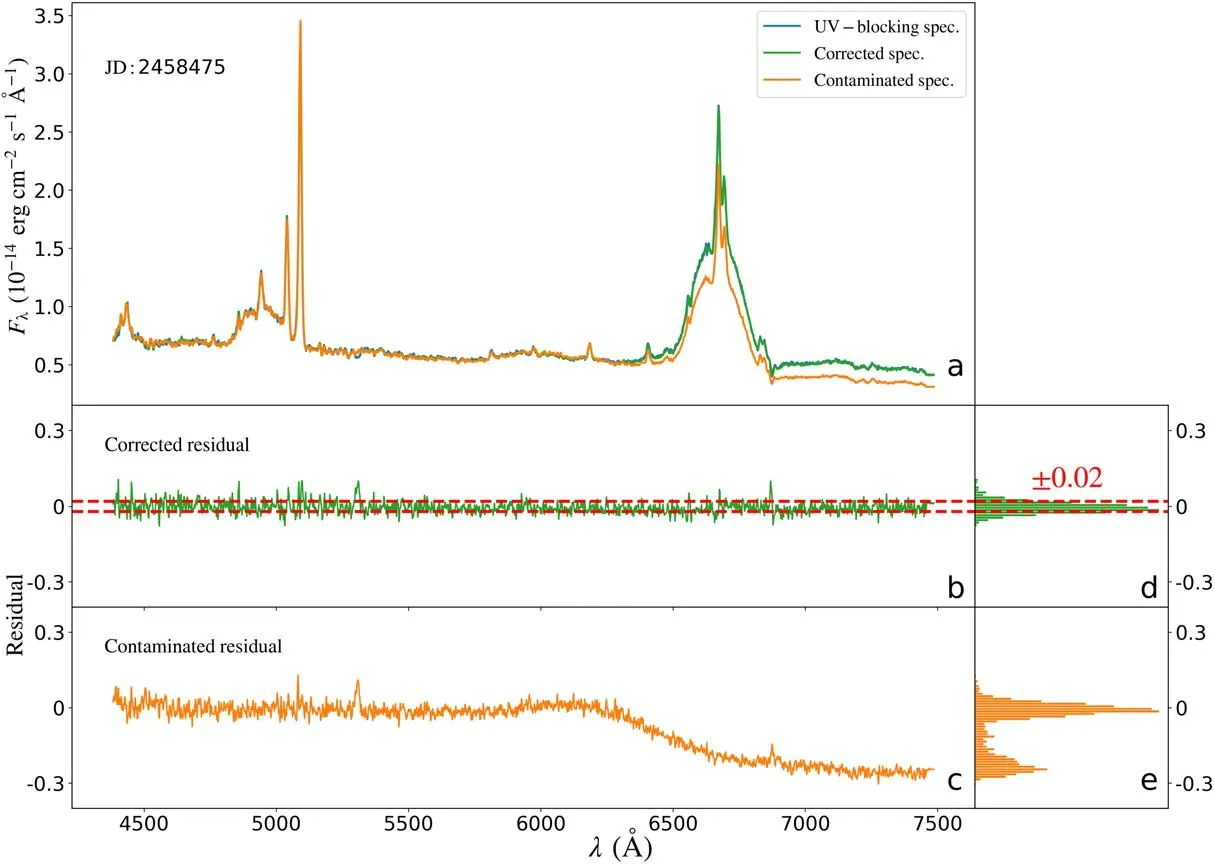
Figure 3.Results of JD 2458475.a.Spectra of NGC 5548 from the UV-blocking observation (blue), contaminated observation (orange) and the correction method(green).b.Residual of contaminated spectra relative to UV-blocking spectra.c.Residual of corrected spectra relative to UV-blocking spectra.d.Histogram of the residual of contaminated spectra.e.Histogram of the residual of corrected spectra.The red dashed lines are 2%and −2%.Note the blue line is the result from the UVblocking data, which almost perfectly coincides with the green line.
In most RM campaigns that do not specifically focus on the Hα line, there are often overlaps between the Hα line and the SOS of the UV/blue band.The practical impact of SOS depends on the relative blueness of the standard star and the object/comparison star pair.Based on our analysis of NGC 5548, we can deduce that the standard star (G191-B2B)was much bluer than the object/comparison star pair,and NGC 5548 was slightly bluer than J1417.As a result, the flux of contaminated spectra with ignored SOS in the flux calibration process was significantly lower than that of the corrected spectra around the Hα band.This was primarily due to the division of a larger sensitivity function generated from the comparison star, and the SOS-effect of the object/comparison star pair tends to reduce the effect caused by the contaminated fiducial spectrum.The overall impact is about 30% and this indicates that Grism14, which was used for monitoring NGC 5548 and most other objects of the LJT (hereafter used to refer to the Lijiang 2.4 m telescope) RM campaign, has a significant impact on absolute flux calibration, as shown in Figure 5.As mentioned above, the factor represents for the systematic bias is mainly caused by G191-B2B and this factor depends on the spectral slopes of the object, comparison star,and standard star.
As demonstrated in Figure 6, the light curve shows less susceptibility to the SOS, except for the integrated absolute flux.First, this could be attributed to the higher sensitivity of the light curves toward relative variations in flux,as compared to nearly proportional changes in absolute flux that have been contaminated by almost the same ratio everyday in Hα band.Second, the partial SOS-effect was eliminated by subtracting the linear-fitting continuum before integrating the emission-line flux.However, the broadness of the Hα integral interval renders the absolute flux highly sensitive to changes in spectral shape caused by SOS in contrast to that of the Hα absorption line of the comparison star, and this impact is relatively small compared with the proportional changes caused by SOS.
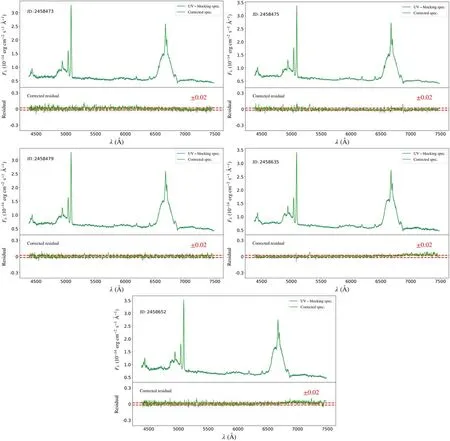
Figure 4.Results of the five days.The green lines are corrected spectra, and the blue lines are contaminated spectra.
The contamination of the object/comparison star pair changes in different observation conditions, leading to a slight variation on the contaminated Hα light curves.This effect will cause the light curve contaminated by SOS to closely resemble the continuum light curve,as the origin of SOS primarily from the continuum in the UV/blue band.The lack of spectral decomposition and host galaxy contamination elimination,which is for the sake of consistency with the contaminated results, makes the continuum light curve not as good as the previous work (Lu et al.2022).But it is sufficient to observe the trend of changes in the Hα light curve caused by the contamination of SOS.Multi-line RM observations indicate that the Hα line is emitted from much larger region than Hβ line (Bentz et al.2010; Feng et al.2021b), and its light curve should be smoother.However, as shown in Figure 6, the opposite was observed with SOS overlapping.The reason for this may be the different presence of components within the integral range.It is evident that the correction consistently decreases the normalized flux when the light curve is trending downward,and conversely,increases it when trending upward.This implies that the correction method slightly shifts the light curve to the left.

Figure 5.Mean spectra of NGC 5548.The orange line is the mean spectrum of the contaminated spectra and the blue line is of the corrected spectra.
The basically proportional variation caused by SOS on absolute flux of the Hα line is approximately 30%.Further more, the emission line width and spectral shape significantly impact RM measurements,such as the determination of SMBH masses and the velocity-resolved time-lags.We can see that our method corrected the line profile significantly.Correcting for the spectral shape enables exploration of the structure of the Hα-emitting BLR by velocity-resolved time-lags.Therefore,further research on Hα RM measurements using this correction method will be conducted in the next paper.
The corrected spectra only has a deviation of about 2%compared to the UV-blocking spectra obtained from an orderblocking filter.We anticipate that we can have even less deviation by correcting the telluric absorption of the comparison star using the method proposed by Lu et al.(2021).It is worth mentioning that when we apply this method to specific archival data, a minority of AGNs might undergo a significant variation in spectral shape rendering the basic assumption of the method, namely, that the spectral shape remains constant,no longer valid.Therefore,we suggest quantifying the variation if there has been a long elapsed time since the archival observations.By applying this method to contaminated data,we can carry out expensive RM experiments without consuming too much telescope time, as theoretically only one day of optimal weather conditions is required for each object.We plan to apply this method to archival RM data,especially that of the LJT, which has a potential to increase the current Hα RM measurements.
5.Summary
In this paper, we present a method to correct the contamination of SOS using a simultaneously observed comparison star.To derive corrected spectra from SOScontaminated data, we implemented a two-step procedure.First,we eliminate the SOS of the spectrophotometric standard star by generating an uncontaminated fiducial spectrum.This fiducial spectrum is then utilized to calculate the sensitivity function of object and comparison star.Second, we eliminate the SOS of the object/comparison pair using the absorption feature of the Hα line of the comparison star.
We tested this method on NGC 5548 by obtaining additional seven spectra with a UV-blocking filter.An uncontaminated fiducial spectrum and a response function of SOS were derived from observations made in a photometric night.The rest six UV-blocking spectroscopic observations were used to obtain uncontaminated UV-blocking spectra,along with the corrected ones, to verify the validity of this correction method, resulting in an approximately 2% deviation.
This method was applied to RM spectra obtained during the 2019 observation season, resulting in 81 corrected spectra,together with 81 contaminated spectra which were calibrated ignoring the contamination of SOS.The corrected spectra were compared to the contaminated spectra to assess the influence of SOS.The major impact of SOS is manifested in the following aspects.
1.For absolute flux near Hα, the contaminated spectra is about 30% lower than the UV-blocking spectra.
2.The spectral shape changes significantly making line width and velocity-resolved time-lag measurements unreliable for further investigation if we directly use the contaminated spectra.
3.The contaminated Hα light curve is less smooth than Hβ and the timing of changes in the corrected Hα light curve has advanced very slightly.
Our application of the method can successfully correct the spectral shape, as evidenced by comparing the UV-blocking results.

Figure 6.Light Curves of NGC 5548.From top to bottom: 1.F5100 light curve.2.Hα light curve using corrected spectra.3.Hα light curve using contaminated spectra.4.Hβ light curve.5.Normalized Hα light curves.
Acknowledgments
We express our sincere gratitude to the reviewer for the meticulous reading and constructive comments.This work is funded by the National Key R&D Program of China with No.2021YFA1600404,the National Natural Science Foundation of China (NSFC; grant Nos.11991051, 12303022, 12373018,12203096, 12103041, and 12073068), Yunnan Fundamental Research Projects (grant Nos.202301AT070339 and 202301AT070358), Yunnan Postdoctoral Foundation Funding Project, the Yunnan Province Foundation (202001AT070069),the Youth Innovation Promotion Association of the Chinese Academy of Sciences (2022058),the Topnotch Young Talents Program of Yunnan Province, Special Research Assistant Funding Project of Chinese Academy of Sciences, and the science research grants from the China Manned Space Project with No.CMS-CSST-2021-A06.We acknowledge the staff of the Lijiang Station of Yunnan Observatories for their enthusiasm and for operating the LJT so efficiently and professionally.Funding for the telescope has been provided by the Chinese Academy of Sciences and the People’s Government of Yunnan Province.
ORCID iDs
 Research in Astronomy and Astrophysics2023年12期
- Research in Astronomy and Astrophysics的其它文章
- Large-scale Dynamics of Line-driven Winds with the Re-radiation Effect
- A Study of Elemental Abundance Pattern of the r-II Star HD 222925
- Preliminary Study of Photometric Redshifts Based on the Wide Field Survey Telescope
- Solar Observation with the Fourier Transform Spectrometer.II.Preliminary Results of Solar Spectrum near the CO 4.66μm and MgI 12.32μm
- Density Functional Theory Calculations on the Interstellar Formation of Biomolecules
- Detection Capability Evaluation of Lunar Mineralogical Spectrometer:Results from Ground Experimental Data