Understanding the Predication Mechanism of Deep Learning through Error Propagation among Parameters in Strong Lensing Case
Xilong Fan, Peizheng Wang, Jin Li, and Nan Yang
1 School of Physics and Technology, Wuhan University, Wuhan 430072, China 2 School of Software Technology, Zhejiang University, Ningbo 315048, China 3 Department of Physics, Chongqing University, Chongqing 401331, China; cqujinli1983@cqu.edu.cn 4 Department of Electronical Information Science and Technology, Xingtai University, Xingtai 054001, China; cqunanyang@hotmail.com Received 2023 August 5; accepted 2023 September 13; published 2023 November 28
Abstract The error propagation among estimated parameters reflects the correlation among the parameters.We study the capability of machine learning of “learning” the correlation of estimated parameters.We show that machine learning can recover the relation between the uncertainties of different parameters, especially, as predicted by the error propagation formula.Gravitational lensing can be used to probe both astrophysics and cosmology.As a practical application, we show that the machine learning is able to intelligently find the error propagation among the gravitational lens parameters(effective lens mass ML and Einstein radius θE)in accordance with the theoretical formula for the singular isothermal ellipse(SIE)lens model.The relation of errors of lens mass and Einstein radius,(e.g., the ratio of standard deviations predicted by the deep convolution neural network are consistent with the error propagation formula of the SIE lens model.As a proof-of-principle test, a toy model of linear relation with Gaussian noise is presented.We found that the predictions obtained by machine learning indeed indicate the information about the law of error propagation and the distribution of noise.Error propagation plays a crucial role in identifying the physical relation among parameters, rather than a coincidence relation,therefore we anticipate our case study on the error propagation of machine learning predictions could extend to other physical systems on searching the correlation among parameters.
Key words: gravitational lensing: strong – methods: data analysis – Galaxy: fundamental parameters
1.Introduction
Since 1979(Walsh et al.1979),gravitational lensing effects have been used as a practical approach in numerous researches of astrophysics and cosmology (e.g., see recent reviews Oguri 2019;Liao et al.2022).As an important role in astronomical research, gravitational lens can generate the multiple images of galaxies,quasars and supernovae,Einstein cross and Einstein ring and so on, which contain very important information about luminous objects (Blandford &Narayan 1992; Jullo et al.2010; Oguri & Marshall 2010;Kneib & Natarajan 2011; Atek et al.2018; Kelly et al.2018;Spiniello et al.2018).Furthermore, gravitational lensing effects also play an important role in the study of cosmology.By using the gravitational lens,astronomers and cosmologists can determine the distribution of baryonic matter and dark matter in galaxies and clusters of galaxies more precisely,and then determine some important parameters of cosmology(Frieman et al.1994; Helbig & Kayser 1996; Vegetti et al.2012; Hezaveh et al.2016).
Although many of the lensing systems have been found through the traditional searches (e.g., Collett 2015), with the rapidly increasing data sets, the enhancement of automated methods to discover lens candidates and estimate the relationship among the parameters become highly necessary(Hezaveh et al.2017).Besides searching candidate,modeling is executed by running maximum likelihood algorithms that were computationally expensive (e.g., Diego et al.2005; Bradač et al.2009; Metcalf & Petkova 2014), and the traditional parameter estimation methods are time consuming(Lefor et al.2013).Convolutional neural networks (CNNs), known as a class of deep learning networks, can be trained to identify characteristics of specific images.Recently, CNNs have been used to study lens modeling as a more efficient parametric method(Hezaveh et al.2017;Morningstar et al.2018;Schuldt et al.2021).Furthermore, the authors of Hezaveh et al.(2017)have extended the work to estimate the uncertainties in parameters with neural networks (Perreault Levasseur et al.2017), which was produced by using dropout techniques that evaluate the deep neural network from a Bayesian perspective(Gal & Ghahramani 2015; Hortúa et al.2020).Some latest related works (Park et al.2021; Wagner-Carena et al.2021)have demonstrated Neural Networks can be used as a powerful tool for uncertainties inference.The main purpose of their work is to improve the prediction accuracy: by eliminating some unrepresentative prior deviations of the training set, the deviation of the predicted results of the testing data set will not be affected by the deviations.
Whether the uncertainties of estimated parameter by the Network reflects the a correlation among the parameters plays an important role in understanding the predication mechanism.Being different from the above works on estimation error, in this paper we focus on the relation of errors of prediction results by machine learning.Namely,we test whether the error relation can reflect the correlation among the predicted objects through the prediction errors from deep neural networks(DNNs).We compare the estimation results of the effective lens mass (which cannot be observed directly from the lens image) and Einstein radius (which can be approximately measured from the lens image) to find the error propagation among the parameters prediction of machine learning, then to find the potential relationship between the two parameters.To our knowledge, the current work is the first one, which shows that machine learning can recover the relation between the uncertainties of different parameters,especially,as predicted by the error propagation formula.In fact, the correlation of the uncertainty in each parameter can be learned by general Neural Networks automatically,which will be demonstrated by means of machine learning on a linear relation toy model and strong lens data in Section 2.The detailed information about simulation and results in two models (toy model and lens model)is discussed in Section 3.Summary is drawn in Section 4 with some additional discussion.
2.Error Propagation Among Parameters
Traditionally, given the known physical relation of parameters or an analytic likelihood function, the relation of uncertainties of parameter estimation is presented by the error propagation formula,the Fisher matrix approach,or a Bayesian posterior distribution of multi-parameters.The error propagation formula is quite common and most simple approach when one cannot directly measure some parameters.By using a particular relation of two parameters, the differentiation law and the Taylor expansion,one can derive the error propagation formula of two parameters on their standard deviation σ:
The effective lens mass ML(see definition in Equation(6))in a strong lens system is an example.In traditional estimation approach,people could directly measure the θEand estimate the lens mass MLbased on a lens model.The errors of ML(e.g.,the standard deviationσML) is calculated through the error propagation law with the error of θE(σθE).While, the Neural Networks do not need this known relation to get,since in the supervised-training step one can directly design any label.Then the Neural Networks could directly show the results of σ2(y)and σ2(x).Note that,when individual label relates to individual parameter, the relation of parameters is not indicated in the training process.We highlight the difference of the error propagation approach and the Neural Networks approach in Figure 1.
We will demonstrate the error propagation of Neural Networks in two cases: a linear relation toy model with Multi-layer Perceptron based networks in Section 2.1 and the lens model with convolution-based networks in Section 2.2.Here we summary the main results using the symbols in Table 1.Taking the lens model into consideration, the relation ofandfrom two Networks do not have clear relation,since the Network is not trained with information on the data noise distribution and we do not know the systematical error of the Network itself.So it is not trivial to check if the relation of(or)derived from a Network following the error propagation law.In fact, if the predication error is only from the Network itself(e.g.,the label value is exactly equal to the data value), therelation does not follow the error propagation law assuming Gaussian noise.On the other hand,if the data noise is dominated,therelation follows the error propagation law(see details in Figure 7).This consistency is a puzzle for us,since one did not label the θE–MLrelation in the training process but only separately label the true parameters of θEand ML.
2.1.Toy Model
We design a linear relation with Gaussian noise n as follows:
where d is an arbitrary value and n is a Gaussian noise n ∼N(0,σ), X is an input datum with three labels Yi,is the predicted value of Yi, and Niis the prediction error from the neural network.For each X, we assign a label set {Y1, Y2, Y3}, which is in values {d, d2, d3}.By this type labels, we not only try to check if the Network could overcome the Gaussian noise n and predict the true value{d,d2,d3}from X,but also to investigate the relation of errors of predicationThe predicted valuegiven by the neural network can be regarded as a function of the testing variable X, which is determined by an un-known predication mechanism of the neural network.Therefore the properties of predication errors{N1, N2, N3}, e.g., the distribution of them, are unclear.
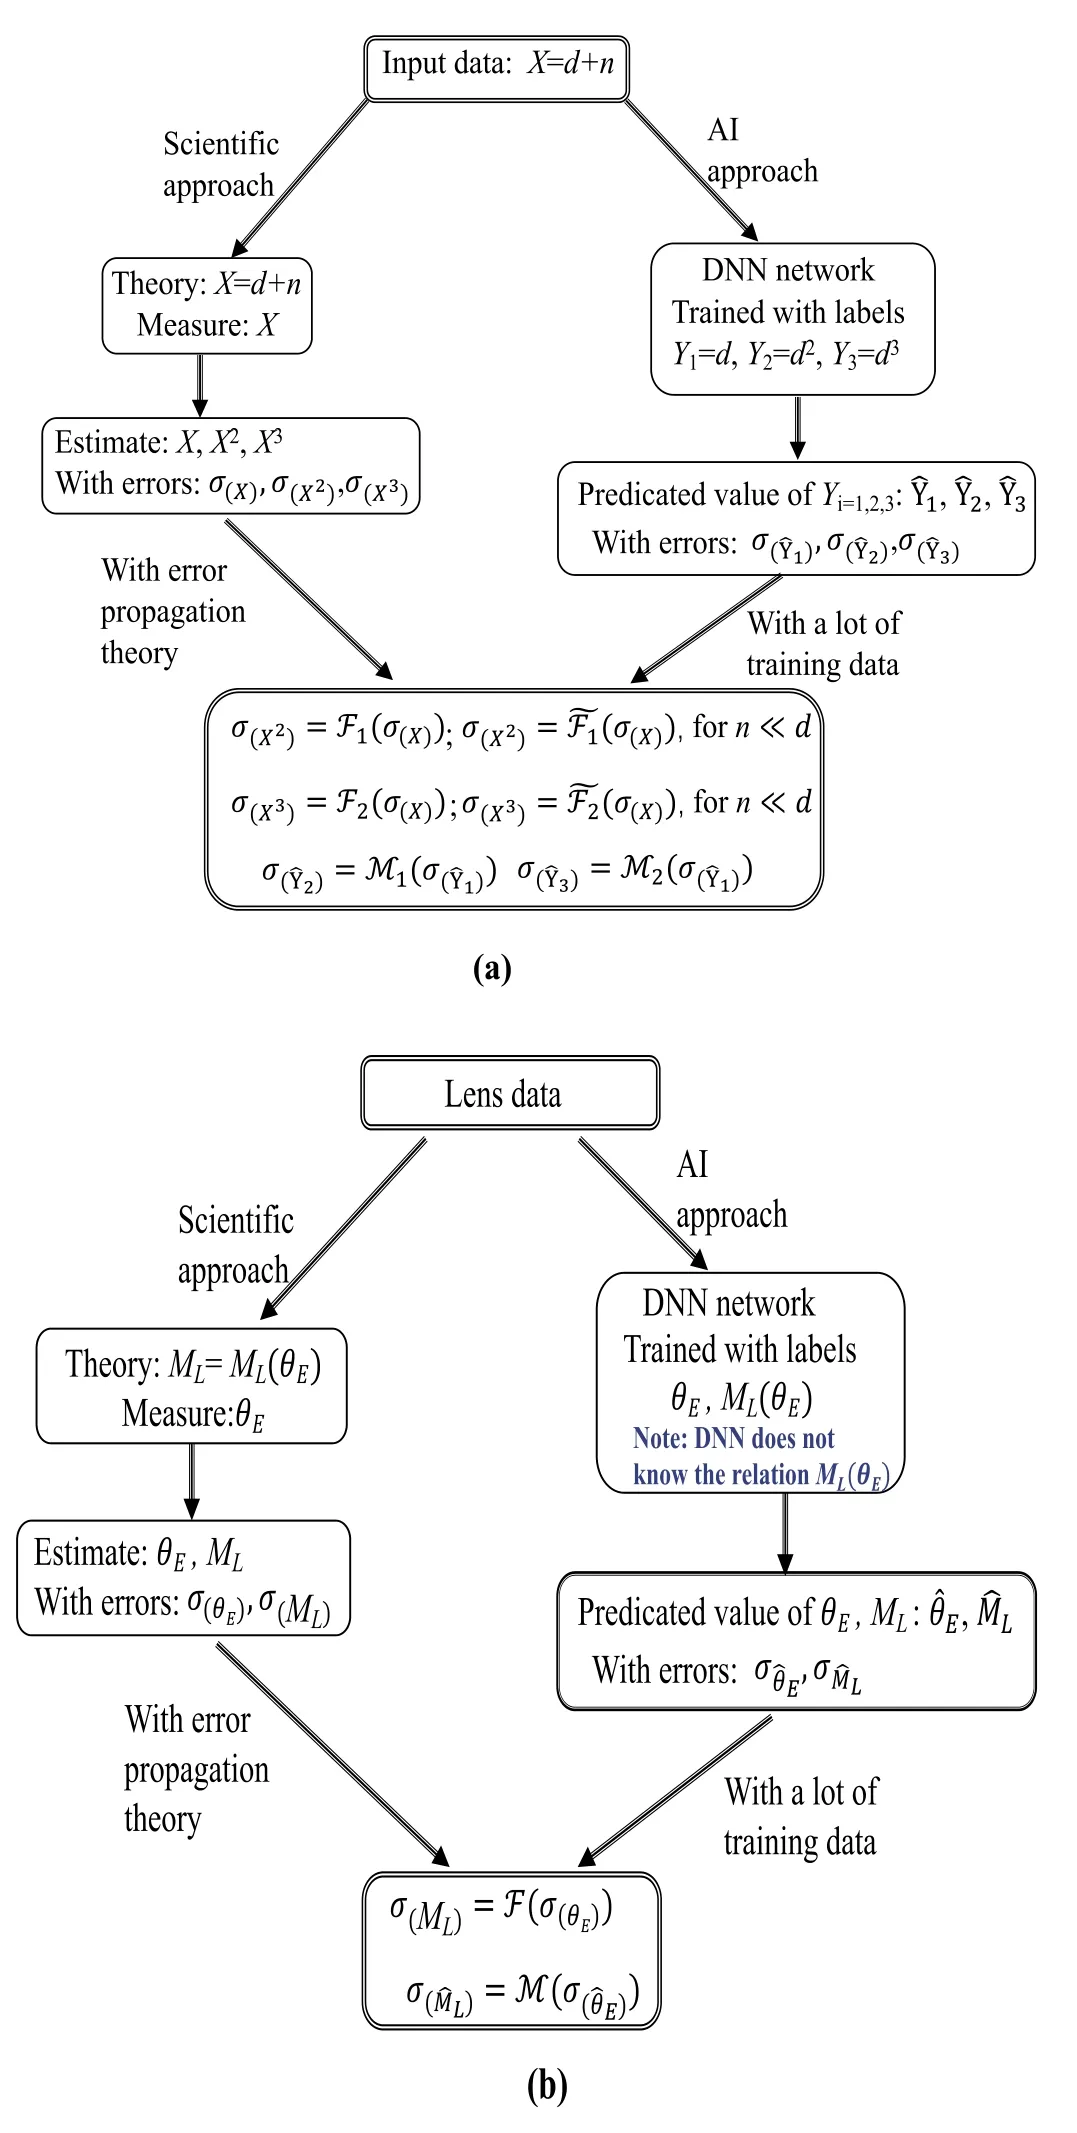
Figure 1.Schematic diagram of two approaches for toy model(a) and lens model(b).In AI approach, labels for the lens case are produced by a relation,but the relation itself is not presented to the network in training progress.We found and for the toy model, and M ~F for the lens model (see detail results in Section 2).
However, we could directly compare the predication results(labeled as a function M among them in below)with the well-defined error propagation relations of{X,X2, X3} (labeled as a functionF in below).
For the toy model,we can get the relation of errors of{X,X2,X3} through the definition of standard deviation by the error propagation law:
where σ(n)=σ is the standard deviation of the Gaussian noise n andwhich allows us to use the covariance (Cov) properties of any variable with zero mean,
At low noise limit e.g., σ《d, we have:
It is worth to check if the noise n could affect the relation of errorsfrom the networks:
2.2.The Lens Model
For the lens system X=d+n, the data X is an observed image (e.g., see the first supernova lens image in Kelly et al.2015).The image could be reconstructed by a lens model d,while the noise n is more complex than a Gaussian noise.We adopt an SIE lens model, which is described by five parameters: the values of Einstein radius θE, the complex ellipticity(εx,εy)and the position of lens center(x,y).For both training and testing data, those parameters are drawn from the uniform distribution shown in Table 2 with different random seeds.The network could directly predicate those five parameters {θE, εx, εy, x, y}.For the lens model, the effective lens mass ML(the mass enclosed inside the Einstein radius) is related to the Einstein radius θE(Schneider et al.1992):
where Dl, Dsare the angular diameter distance of lens and source respectively, Dlsis the angular diameter distance between lens and source.Traditionally, those distances are inferred by redshifts of lens and source through a cosmology model (see a recent review in Oguri 2019).Therefore, the model for the Network could also be described by parameters{ML, εx, εy, x, y}, if we can measure the redshift of the source and lens by emission lines.
Unlike Einstein radius, lens mass is a strongly model dependent parameter and could not be observed by telescope directly.However for machine learning approach, all the parameters could be predicted from the input directly.Shown in the toy model case, deep learning is able to extract deep information from input and predict any designated source parameters.We attempt to check whether it can also learn the association among parameters indicated in the propagation of uncertainty of predictions for the lens model.Here we take θEand MLinto concern (Equation (6)), and the predicted errors ratio by the theoretical error propagation formula is:
Since we only try to recover the relation of errors of two parameters (MLand θE), here we do not infer the redshifts of lens and source,but simply assuming Dl,Dsand Dlsare known constant as did in Hezaveh et al.(2017),e.g.,fixed zs=0.5 and zl=0.2 (see more details in Section 3.2).The parameters {εx,εy, x, y} are not fixed for the training and testing processes to make sure that all results could be used as an astrophysical application in our next work.It should be also noted that:although we generate the labels of MLand θEfor the training data sets with the SIE lens model, the prediction processes of DNN are not informed of any relationship of these parameters.
Similarly to error relation ofandin the toy model, the error relation ofandis the target of this section.Therefore we could also design three label sets: {θE, εx, εy, x,y},{ML,εx,εy,x,y},and{ML,θE,εx,εy,x,y},for one observed image X.For the same data X,three networks shown in Table 2 are adopted to predicate the common parameters {εx, εy, x, y},and(i)Network VGG16(θE)for{θE,εx,εy,x,y}also gives the predictionwith the predication error; (ii) Network VGG16(ML)for{ML,εx,εy,x,y}also gives the predictionwith the predication error;(iii) Network VGG16(θE, ML)for {ML, θE, εx, εy, x, y} also gives the predictionandwith the predication errorsand.Predication errors(i=θE, ML; j=A, B, C) are caused by lens data noise and unknown network prediction mechanism, therefore we do not know the statistical properties ofand
2.3.Neural Networks

For the lens model: Besides the AlexNet used in Hezaveh et al.(2017), we adopt the VGG16 network (Simonyan &Zisserman 2014) to predict the lens parameters.VGG16 network is a common deep learning structure and sometimes outperforms AlexNet on computer vision tasks.We adjust the final layer to the fully connected layer to regress the parameters in VGG16.The structure of our VGG16 network is shown in Figure 2.
In training process, we choose averaged MSE and ReLU as the loss function and activation function respectively,initialize all the weights using the imagenet’s pre-trained model,optimize the network by the ADAM algorithm, set the batch size to be 50,and adjust the learning rate to be 10−4for the first 104epoch and to be 10−6for another 104epoch.The training process lasts several hours for Alexnet and twenty hours for VGG16 with GPU RTX 2080 Ti single card.

Table 1 Symbol Description
Note.Error relations from Networks are compared with the error propagation formulas.Network A and B are designed for one parameter in error propagation formulas,while Network C is for all parameters in error propagation formulas.All the errors are listed in the corresponding columns.In the network approach neither information on noise nor the relation form of parameters are provided to Networks.For the toy model,predication errors of Network C(Equation(5))in the no-noise data(n=0)case do not follow the error propagation formula at low noise limit(Equation(4)),while for the noise data(n ≠0)cases,relations of errors from Network A, B and C are all consistent with the error propagation formula (Equation (3)).For the lens model, only the relationσθ CEˆ–σM C
Lˆ by Network C is consistent with the predication of the error propagation formula based on the SIE lens model (Equation (8)).Symbols with hat represent the results from Networks.
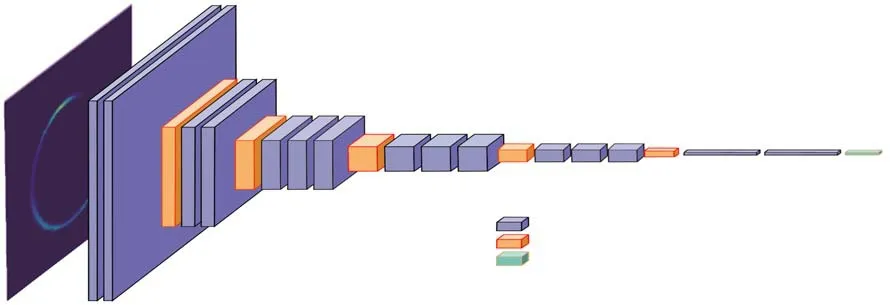
Figure 2.The structure of the VGG16 used in this work.

Table 2 The Standard Deviation of the Parameter Predictions for the Test Datasets in GREAT3 and Galaxy Zoo
3.Simulation and Results
3.1.The Toy Model


The results of noise caseM~ F indicate that the network“knows” the distribution of noise n and the relation of label numbers{Y1,Y2,Y3},although there is no information on n in the labels and the relation itself is also not included in the labels.Although we do not know the predication mechanism of the neural network for parameters predication but only the structure of the networks, it seems that the neural network could guarantee the association among parameters.This performance of the neural network could further implies as the neural network is capable to learn the relationship among parameters.Those properties of the Network are more interesting when it is applying for more sophisticated physics models, e.g., the gravitational lens model.

Figure 3.Predictions of the Network and comparisons of the function M(red points),F (blue lines)and(green lines).The function M are shown by the standard deviation of predictions,which are evaluated in 20 bins of d.The upper-panel and middle-panel are for no noise n=0 case,and lower-panel is for noise case.For function M defined in Equation(5),three networks are adopted:M(C )is forby Network C;M(A and B1)is forby Network A andby Network B1, while M(A and B2) is forby Network A andby Network B2.
3.2.The SIE Lens Model
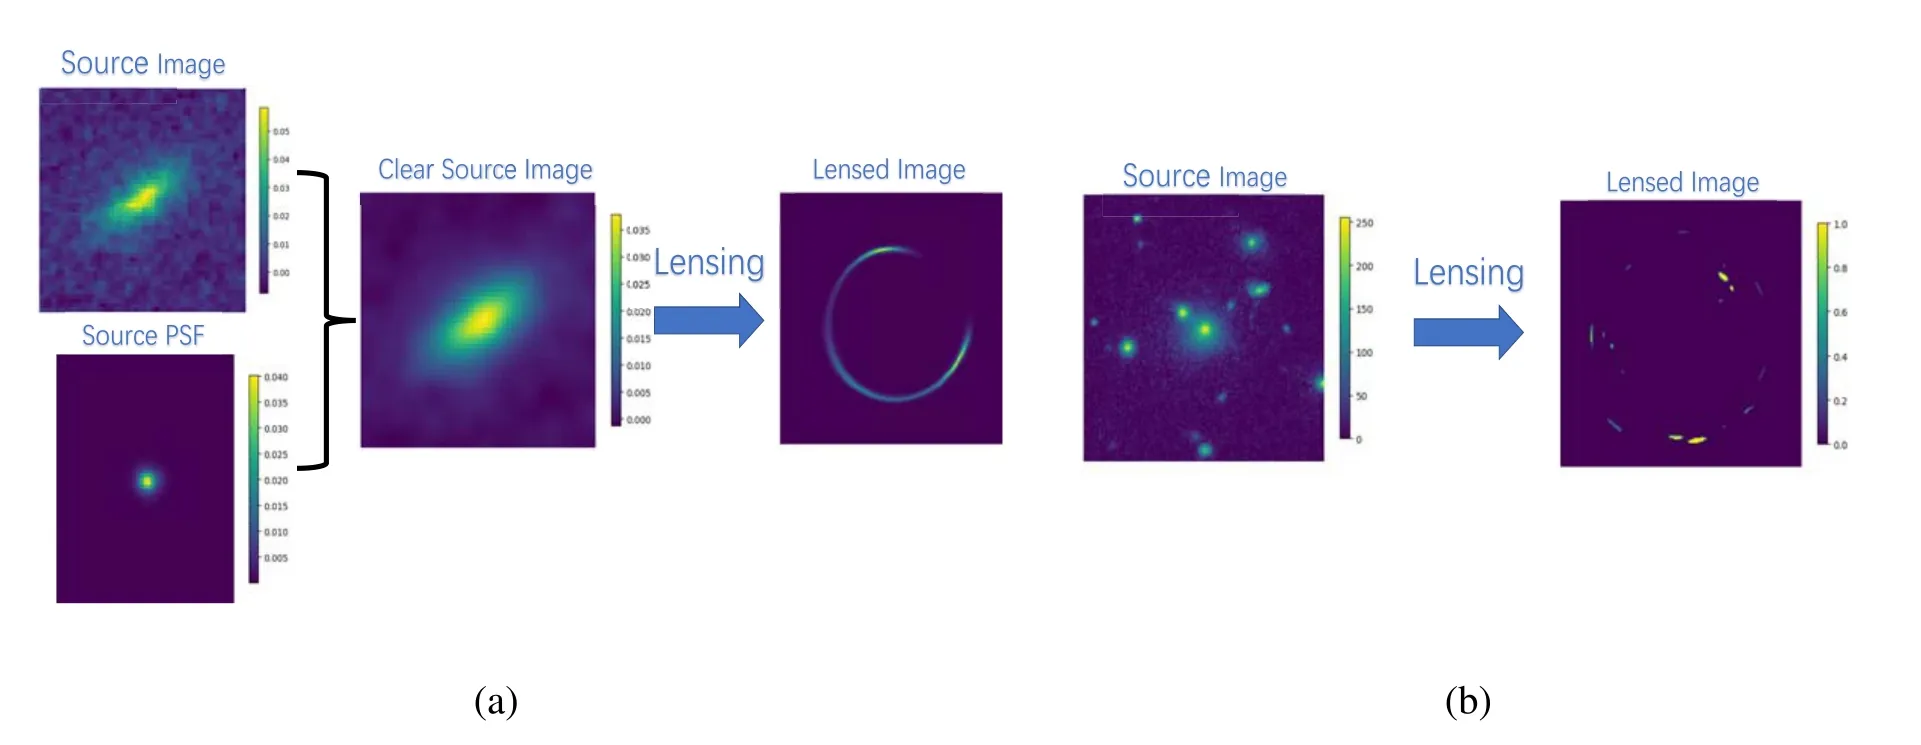
Figure 4.(a) One simulated training data set in GREAT3 data group; (b) One simulated test data set in Galaxy zoo data group.
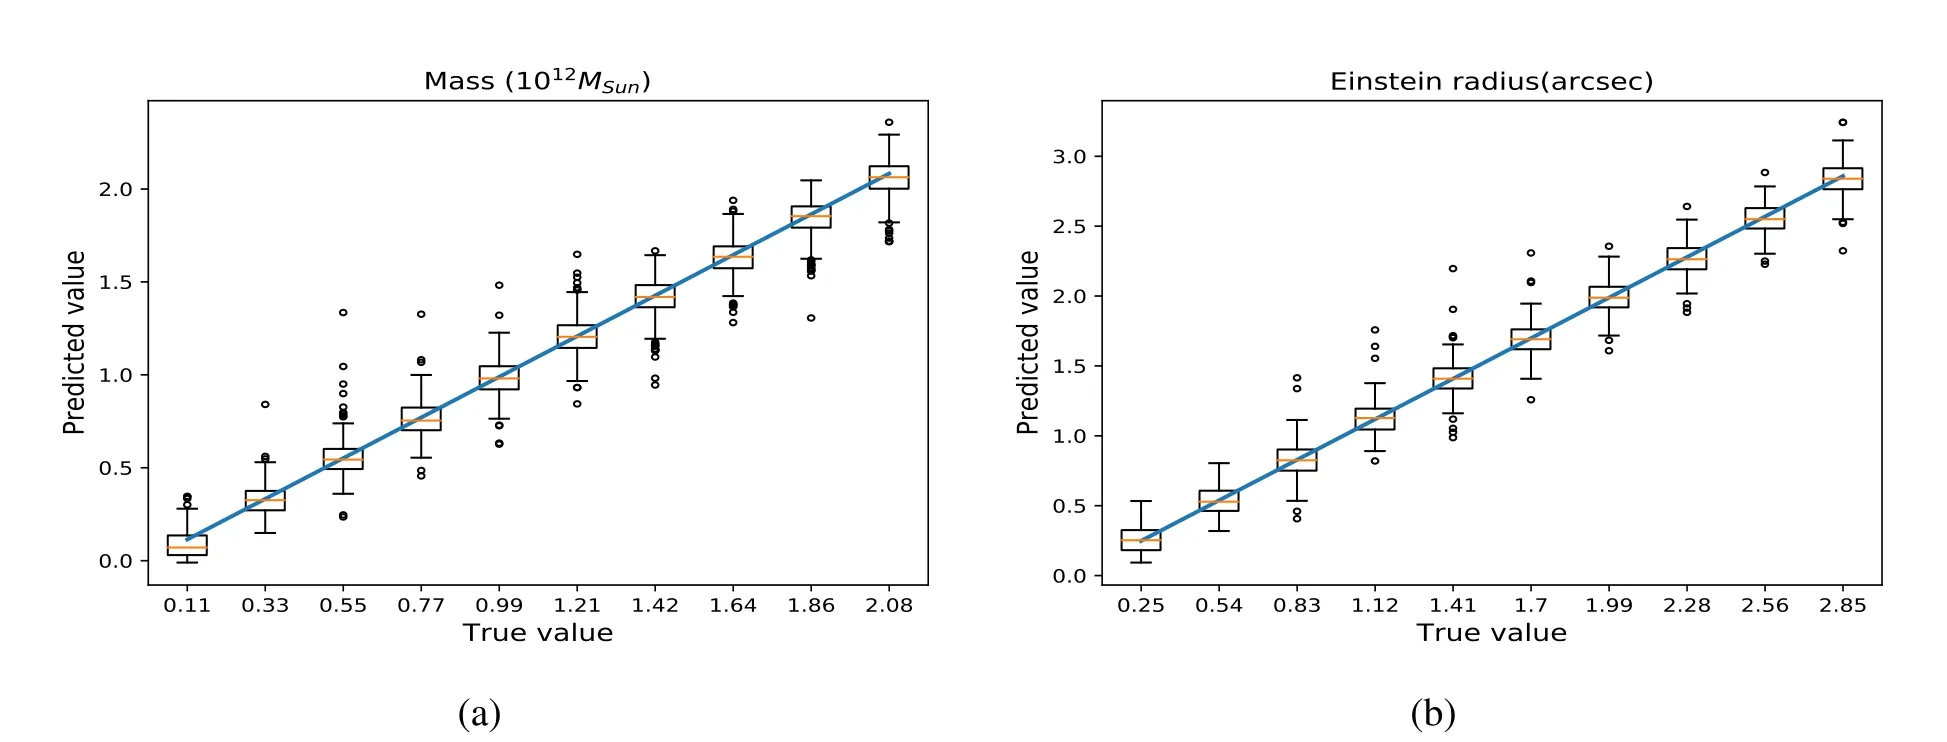
Figure 5.Results for the GREAT3 data.The estimated values are shown on the y axis, while the x axis represents the segment of the point.(a) Comparison of estimated lens masses with their true values by VGG16(ML)network.(b)Comparison of estimated lens Einstein radius with their true values by VGG16(θE)network.
Following Hezaveh et al.(2017), we consider the singular isothermal ellipse (SIE) lens model (Equation (6)) and fix the redshift of lens zl=0.5,the redshift of source zs=2 and adopt 737 cosmology model (i.e.,h=0.7, Ωm=0.3, ΩΛ=0.7)(Planck Collaboration et al.2016).The values of Einstein’s radius θE,the complex ellipticity(εx,εy)and the position of lens center (x, y) for both training and testing data are drawn from the uniform distribution shown in Table 2.We simulated the lensed images for training and testing based on source images from COSMOS−23.5, COSMOS−25.2 in GREAT3 data.To test the generalization of networks trained by the images with high quality from GREAT3,we also use data from Galaxy Zoo as source image to produce another test data set.With the VGG16 and AlexNet trained by GREAT3 data (two million samples in total),we estimate the parameters{θE,εx,εy,x,y}of other branches of GREAT3 data (ten thousand samples in total), labeled such as VGG16(θE) and Alexnet(θE) in Table 2,respectively.More details on data,training,testing,robustness,accuracy of individual parameter estimation and error propagation can be found in the following content.
The source images for training data are from COSMOS−23.5 and COSMOS−25.2.All source images are first convolved by the point-spread function (PSF) supported in GREAT3 data to improve image quality.These images are used to produce two million lensed images with parameters shown in Table 2.Each lensed image undergoes the following operations before being fed into the network to avoid overfitting.First, add random Gaussian noise to the lensed image.The root mean square value of the noise is randomly selected from a uniform distribution, and its value is 1%–10%of the signal.Then, we use a factor of 501,000 to convert the image to a photon count, and use these values as the λ to generate a Poisson realization map, effectively adding Poisson noise to the image.We use the 400,000 images including simulated hot pixel and cosmic rays provided by Hezaveh et al.(2017) to make the network insensitive to pixel artifacts and cosmic rays.Then we use a random root mean square Gaussian filter to convolve the image to simulate the blurring effect of the PSF that reveals the factors of atmosphere and the telescope itself.Finally,randomly translate on the image for augmenting the data.The total training data samples are two million in total and in which ten thousand data sets are used for validation.Each training data sample is fed into the neural network with different data augmentation operations.
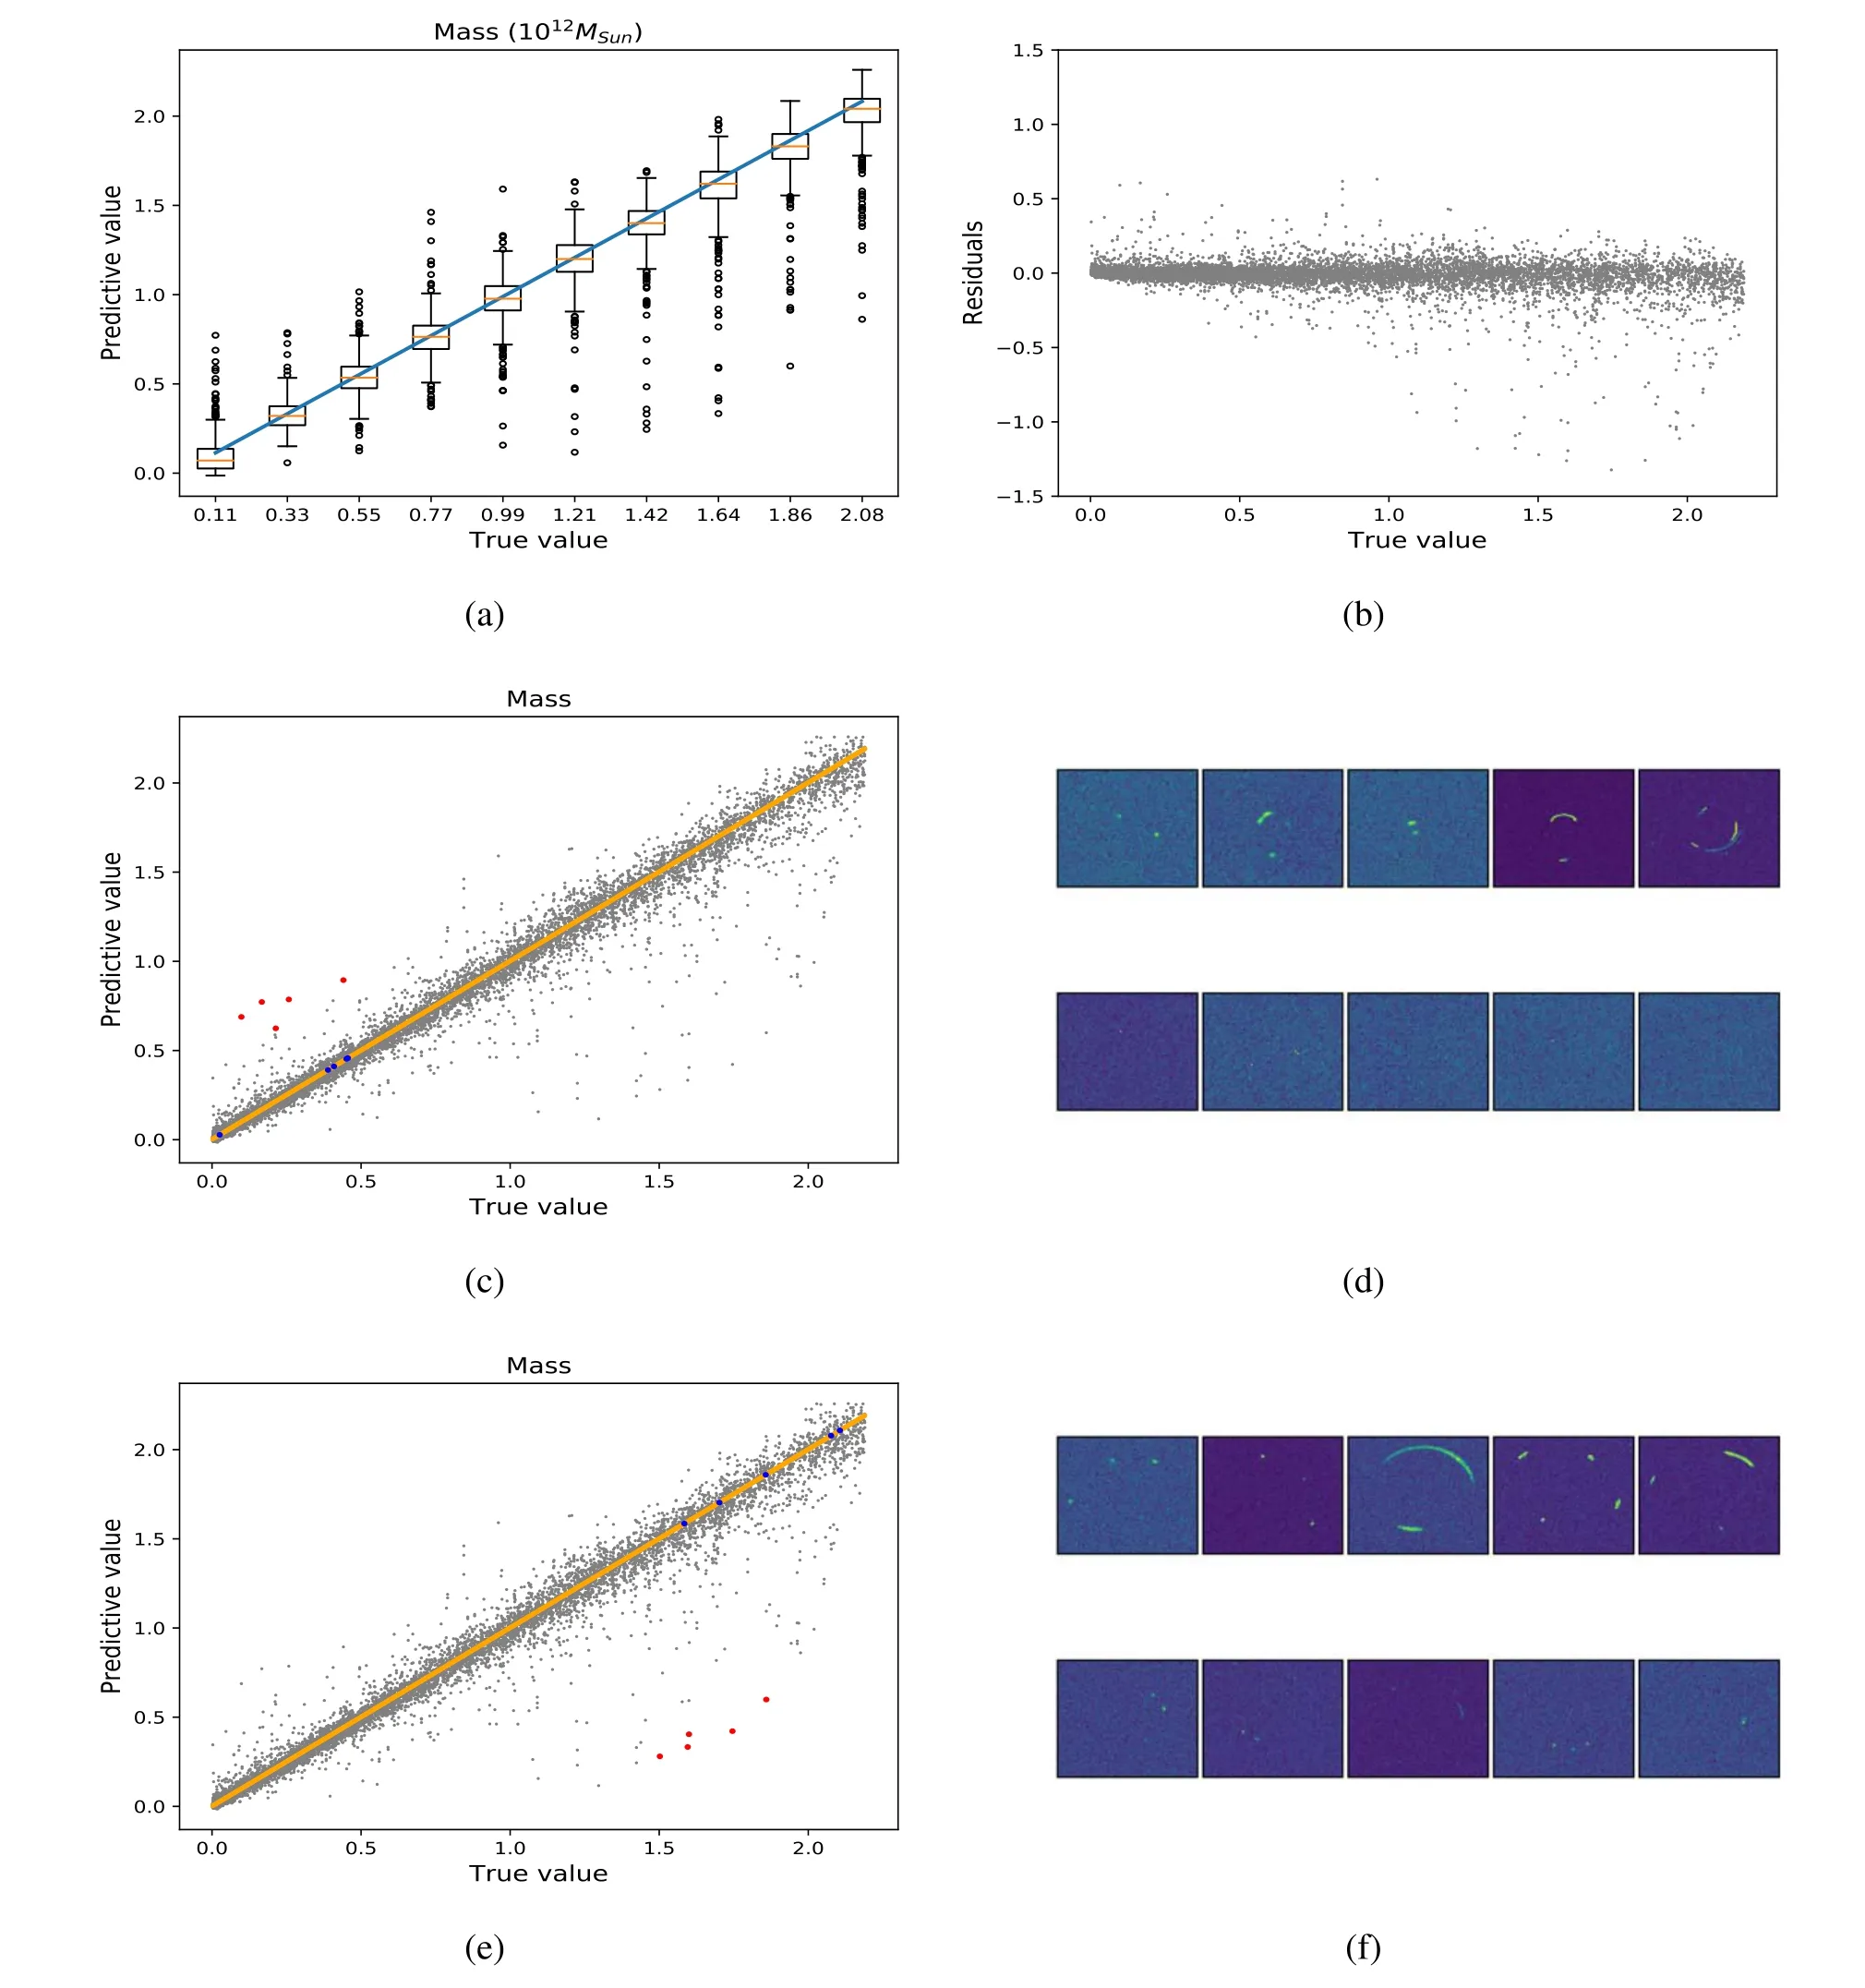
Figure 6.Results for the Galaxy zoo data by VGG16(ML).The reason for the predicted value of large mass being less than the real value.(a) The box plot of the estimated lens masses compared to the true value.(b)The residuals plot of lens mass prediction.(c)The comparison of estimated lens masses with their true values,in which the red dots are the poor estimation samples corresponding the images in the second row of(d),the blue dots are perfectly estimated samples corresponding the images in the first row of(d).(e)The comparison of estimated lens masses with their true values,in which the red dots are the poor estimation samples corresponding the images in the second row of (f), the blue dots are perfectly estimated samples corresponding the images in the first row of (f).
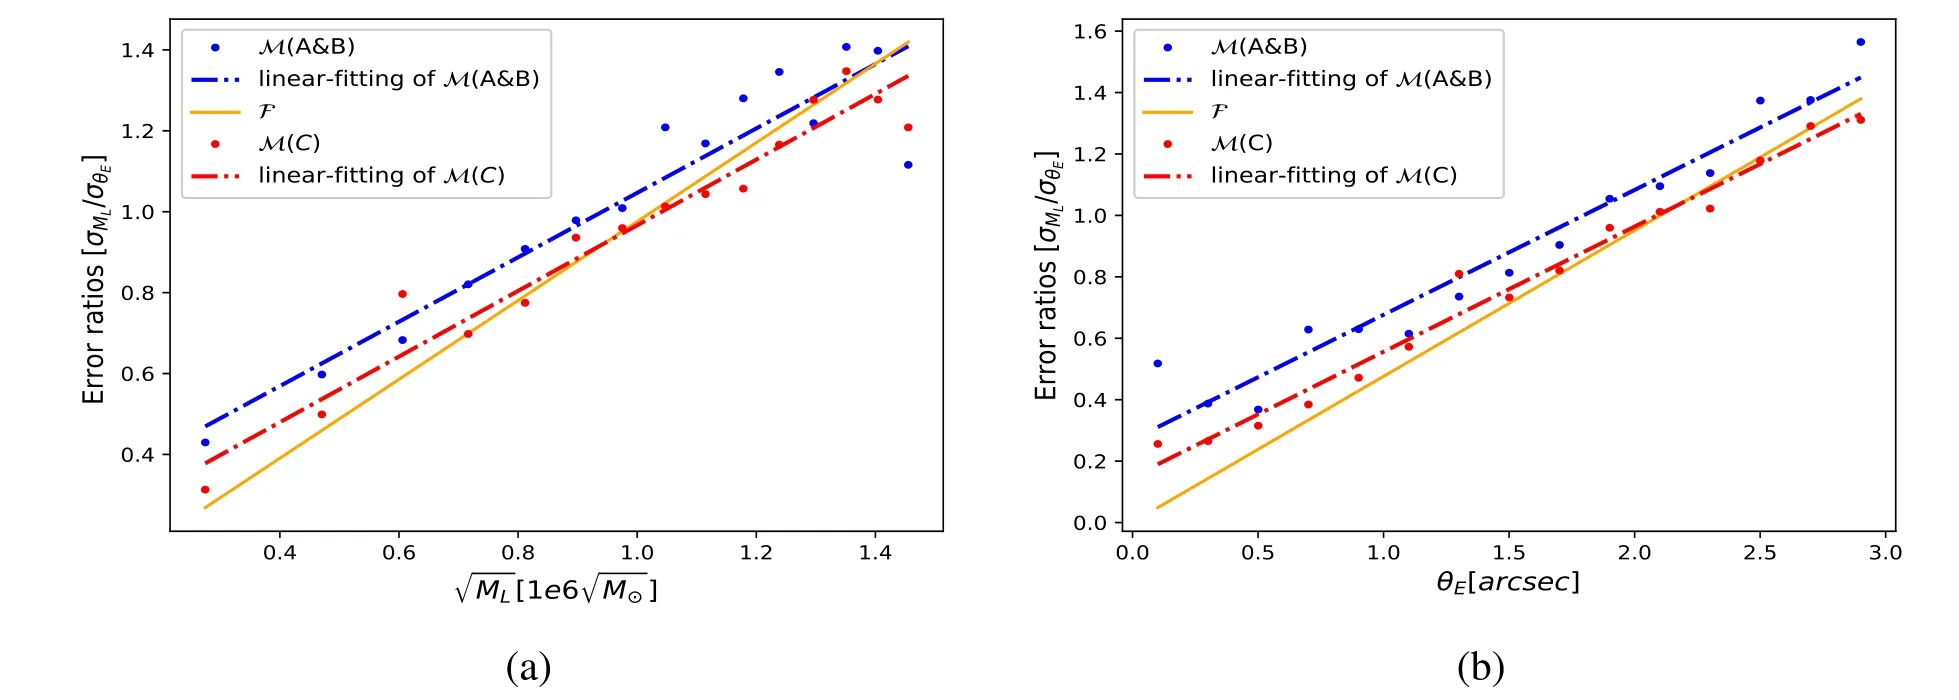
Figure 7.(a)The comparison of theoretical and predicted correlation between and (b)The comparison of theoretical and predicted correlation between θE and The blue dots (M(A and B)) represent the predicted values of VGG16(θE) and VGG16(ML), the yellow line (F) represents the result from the theoretical error propagation formula (Equation (7)) and the red line (linear-fitting of M(C)) represents the linear-fitting of the red dots from the predicted values of VGG16 (θE, ML).
We use other branch of GREAT3 data(1.8 million samples)as source images to produce our test data set (ten thousand samples in total).To test the generalization of networks trained by the high quality of image from GREAT3,we use data from Galaxy Zoo(61 thousand samples)as source image to produce another test data set(ten thousand samples in total).The data in the Galaxy Zoo are coming from the Sloan Digital Sky Survey(SDSS).There may be multiple galaxies and a higher noise level comparing to the GREAT3 data.One training image from GREAT3 and one test image from Galaxy Zoo are illuminated in Figures 4(a) and (b), respectively.
To understand the robustness of networks, we use the VGG16(ML) and Alexnet(ML), which are trained by the GREAT3 data sets with higher image quality, to predict lens mass MLof test data sets in the Galaxy Zoo data group.
Shown in Table 2,the standard deviations of the parameters estimated by VGG16 are all slightly better than Alexnet.It should be noted that in Hezaveh et al.(2017)the errors of their Alexnet networks seem to be much better than ours.The reason is that the test data sets in Hezaveh et al.(2017) are unknown for us, we get corresponding results only considering the network (AlexNet) with their trained weights.The standard deviation of {εx, εy, x, y} from VGG16(ML) are comparable to the results from VGG16(θE).
To check if the predication also depends on the parameter value, we compare the estimated lens massesby VGG16(ML) and Einstein’s radiusby VGG16(θE) with their true values with box plot for the VGG16 trained by GREAT3 data(Figure 5).We divide the interval into 10 segments with equal width,and draw its box plot for each segment.For the box plot of the Einstein’s radius, every bin has the same data approximately.But for the box plot of the lens mass, there are more data in the bins with small mass,because the mass is proportional to the square of the Einstein’s radius.Shown in Figure 5,the mean value of predicted massby VGG16(ML)recover better the true value ML, although there are more outliers than the Einstein’s radiusby VGG16(θE).For massive galaxies more outliers are in smaller prediction value comparing with the true value, while for less massive galaxies more outliers are in larger predicted value.
The results from the Galaxy Zoo data are shown in Figure 6.The value of MLand the residuals of lens mass predicted by VGG16(ML) are shown in Figures 6(a) and (b), respectively.Although the average value of predicated parameters represent the true value quite well,there are more outliers resulting larger standard deviations for both networks (see Table 2).This is partly because the data sets in the Galaxy Zoo data group are sources with irregular shapes and have very noisy background as the image shown in Figure 4(b).It can be seen that the reason for clustering to the average value is that the noise of the image is too large to contain useful information(see the image data of outliers in Figures 6(d),(f)corresponding to the outliers in Figures 6(c), (e)).In order to minimize the overall loss,neural networks tend to output the average value of the sample.The detailed comparison of estimated lens masses with their true values is figured out in Figure 6, which indicates the predicted value of small mass tends to be greater than the real value, while the predicted value of large mass is less than the real value (also see the residuals plot in Figure 6(b)).This tendency is also found for {εx, εy, x, y}.
The standard deviation of all parameters predicated by VGG16 or Alexnet in three sets of labels for all test samples are shown in Table 2.In order to investigate the relation among the prediction errors of θEand ML, the ratio of the standard deviation ofandby VGG16 networks A,B,C(test data set in 15 segments) as a function of the center value of MLis shown in Figure 7.The results show that
It can be found that the error propagation by VGG16(θE,ML)is roughly consistent with the error propagation formula (the yellow line represent Equation (7)F in Figure 7):M~ F as shown in the toy model case.Again, network C seems to“know” the noise distribution since the errors follows the theoretical error propagation formula.However,the ratio of the errors ofandderived from networks A and B does not follow the theoretical error propagation formula, which is not the case in the toy model.The plausible reason for the difference between the toy model and lens model is that Equation (7) does not consider the non-Gaussian noise effects of input data.
This result enlightens us that as long as the accuracy of parameter estimation by the network is guaranteed, even if we do not know the physical relation between the parameters of input data, the relation will be reflected through the corresponding error of deep learning estimation.This feature of deep learning is valuable for further investigation on the parameter correlation with unknown theoretical model in advance.For example, if the lens mass is measured by gravitational wave Hou et al.(2020), one could combine the lens mass estimation from gravitational wave, Einstein radius estimation from optical lens image and the redshifts z from emission lines to investigate ML–θE–z relation.
4.Discussion and Summary
Unlike the traditional parameter estimation, the parameter estimation by machine learning almost completely depends on the information in samples.Assuming the SIE lens model, the Einstein radius θEand effective lens mass MLare estimated by the convolutional neural network,and the capability of network acquiring the correlation information between parameters from the data is tested through the estimation errors.In this process,the Networks produce the relation of errors as the traditional error propagation law based on known θE–MLrelation.Such a correlation of estimated parameters provides a self-consistent result, so it is very important for further study on parameter estimation by machine learning.
In order to ensure the reliability of the above results, the accuracy of parameter estimation by the network also needs to be guaranteed.The convolutional neural network AlexNet is an effective approach of predicating parameters of the lens model(Hezaveh et al.2017).Through applying the typical convolutional neural network VGG on the parameter estimation of the gravitational lens, the great performance on abstraction of features has been shown in our simulated lens data (results are shown in Table 2 and Figures 5 and 6).Meanwhile, the robustness of such a network could also be guaranteed to a certain extent.From the results of Galaxy Zoo test data sets,it is found that for the signal submerged in noise,neural networks tend to output the average of the training set to minimize the MSE.We also test the non-normal loss(MAE)as the loss function after the normal generative process, and the performance of the error propagation is similar as shown in the MSE case.Further study could also test more advanced networks on the performance of parameter estimation, such as ResNet (He et al.2015), DenseNet (Huang et al.2016), ViT(Dosovitskiy et al.2021), so as to get a more accurate error propagation corelation among parameters.

Acknowledgments
We thank Kai Liao for helpful discussions.This work was supported by the National Natural Science Foundation of China(grant No.11922303), the Natural Science Foundation of Chongqing (grant No.CSTB2023NSCQ-MSX0103), the Key Research Program of Xingtai 2020ZC005, and the Fundamental Research Funds for the Central Universities (grant No.2042022kf1182).
 Research in Astronomy and Astrophysics2023年12期
- Research in Astronomy and Astrophysics的其它文章
- Large-scale Dynamics of Line-driven Winds with the Re-radiation Effect
- A Study of Elemental Abundance Pattern of the r-II Star HD 222925
- Preliminary Study of Photometric Redshifts Based on the Wide Field Survey Telescope
- Solar Observation with the Fourier Transform Spectrometer.II.Preliminary Results of Solar Spectrum near the CO 4.66μm and MgI 12.32μm
- Density Functional Theory Calculations on the Interstellar Formation of Biomolecules
- Detection Capability Evaluation of Lunar Mineralogical Spectrometer:Results from Ground Experimental Data
