
Performances of fissured red sandstone after thermal treatment with constant-amplitude and low-cycle impacts
2024-02-29 14:49YongjunChenTuingYinRnjithXiingLiQingLiDengdengZhung
Yongjun Chen ,Tuing Yin ,P.G.Rnjith ,Xiing Li ,Qing Li ,Dengdeng Zhung,c
a School of Resources and Safety Engineering,Central South University,Changsha,410083,China
b Department of Civil Engineering,Monash University,Melbourne,3800,Australia
c Oulu Mining School,University of Oulu,Oulu,FI-90014,Finland
Keywords:Red sandstone Temperature Fissure Constant-amplitude and low-cycle (CALC)impact Fatigue failure Response surface method (RSM)
ABSTRACT In the engineering practices,it is increasingly common to encounter fractured rocks perturbed by temperatures and frequent dynamic loads.In this paper,the dynamic behaviors and fracture characteristics of red sandstone considering temperatures(25 °C,200 °C,400 °C,600 °C,and 800 °C)and fissure angles (0°,30°,60°,and 90°) were evaluated under constant-amplitude and low-cycle (CALC) impacts actuated by a modified split Hopkinson pressure bar (SHPB) system.Subsequently,fracture morphology and second-order statistics within the grey-level co-occurrence matrix (GLCM) were examined using scanning electron microscopy (SEM).Meanwhile,the deep analysis and discussion of the mechanical response were conducted through the synchronous thermal analyzer (STA) test,numerical simulations,one-dimensional stress wave theory,and material structure.The multiple regression models between response variables and interactive effects of independent variables were established using the response surface method (RSM).The results demonstrate the fatigue strength and life diminish as temperatures rise and increase with increasing fissure angles,while the strain rate exhibits an inverse behavior.Furthermore,the peak stress intensification and strain rate softening observed during CALC impact exhibit greater prominence at increased fissure angles.The failure is dominated by tensile damage with concise evolution paths and intergranular cracks as well as the compressor-crushed zone which may affect the failure mode after 400 °C.The second-order statistics of GLCM in SEM images exhibit a considerable dependence on the temperatures.Also,thermal damage dominated by thermal properties controls the material structure and wave impedance and eventually affects the incident wave intensity.The tensile wave reflected from the fissure surface is the inherent mechanism responsible for the angle effect exhibited by the fatigue strength and life.Ultimately,the peak stress intensification and strain rate softening during impact are determined by both the material structure and compaction governed by thermal damage and tensile wave.
1.Introduction
The assessment of rock strength characteristics based on the classical mechanics and conventional rock mechanics tests has always been highly expected in the stability of engineering rock masses and structures.Such calculation and testing methods usually assume that the material is a homogeneous continuum and ignore the inherent flaws in the material at a specific scale.To date,the mechanical behavior of intact materials under static and dynamic loadings is well understood,and the ability to control the strength of conventional materials has improved significantly.Nevertheless,as the safety of energy and underground space emerges as a major challenge in the 21st century,concerns arise about the conventional calculation and test methods of strength employed to ensure the safety factor for deep high-temperature rock engineering.
In most cases,rock mass failure arises from disturbed loads surpassing the structural design strength;however,fatigue disturbances often cause the rock mass to fail at strength below the design threshold.Similarly,extensive engineering practices reveal that long-term service deterioration in engineering rock masses primarily stems from not just design strength flaws but fatigue and fracture.Such fatigue disturbances usually derive from recurrent influences such as pile driving,fluid injection and extraction,rockburst,frequent drilling and blasting during excavation,vehicular traffic,and earthquake (Haimson,1978;Fleming et al.,2009;Haibo et al.,2011;Wang et al.,2013;Wu et al.,2013;Roberts et al.,2015;Fan et al.,2016;Li et al.,2017;Voznesenskii et al.,2017;Chen et al.,2019;Zhang,2021;Zhao et al.,2021;Xu et al.,2022).After careful consideration,extensive research and reports have been conducted on the mechanical properties of intact rocks under cyclic loading (Cerfontaine and Collin,2018).In terms of low strain rate cyclic loading,the published studies have shown that fatigue life,deformation characteristics and damage patterns of rock under uniaxial and triaxial conditions are mainly controlled by stress amplitude,cyclic period and loading frequency,and to some extent,lithological characteristics sometimes play an important role(Singh,1989;Bagde and Petroˇs,2005;Fuenkajorn and Phueakphum,2010;Erarslan and Williams,2012;Ma et al.,2013;Momeni et al.,2015;Taheri et al.,2016;Vaneghi et al.,2018,2020).
The advancement of testing technology has facilitated a comprehensive understanding of the mechanical properties and fracture behavior of engineering rock masses under dynamic loading.However,research on low-cycle loading with high strain rates remains insufficient in this domain.The cumulative deterioration to rock masses induced by the stress wave loads from frequent blasting and seismic events can frequently be monitored in underground engineering activities(Liu and He,2012).So far,the testing of dynamic properties of rocks still relies heavily on the split Hopkinson pressure bar (SHPB) apparatus,which has now been improved to evaluate the effects of environmental parameters such as perimeter pressure,axial pressure,and temperature(Bieniawski,1968;Lundberg,1976;Bischoff and Perry,1991;Li et al.,2005,2008;Zhao et al.,2019).Through extensive cyclic impact experiments and theoretical analysis of intact rock-like materials conducted by the SHPB testing device,it is reported that the evolution of P-wave velocity,elastic modulus,fatigue life and resistance to deformation is significantly influenced by the incident stress amplitude,loading frequency,axial stress,and lithology (Lai and Sun,2010;Jin et al.,2012;Wang et al.,2013;Wu et al.,2014;Luo et al.,2016;Zhou et al.,2018;Si et al.,2020).The growth and evolution of cracks are likely to be accountable for a series of fatigue behaviors demonstrated by the rock under cyclic impact (Tavares and King,2002;Li et al.,2018a,b,c).
On the other hand,engineering rock masses are often corroded by thermal stresses in nuclear waste disposal,volcanic events,underground coal gasification,underground chambers,deep drilling,mine construction,tunnel fires,and geothermal development(Burdine,1963;Homand-Etienne and Houpert,1989;HAMMONS,2004;Fridolf et al.,2013;Zhang and Zhao,2014;Liu and Xu,2015;Gautam et al.,2018;Rathnaweera et al.,2018).Such engineering issues have received considerable scholarly attention recently,and a series of tests on the dynamic and static mechanical behavior of defective rocks under the influence of high temperatures was executed.Extensive research has shown that hightemperature effects strongly govern both dynamic and static mechanical characteristics as well as failure behavior of rocks(Li et al.,2020;Yin et al.,2021a).In general,the macro-mechanical parameters such as elastic modulus,density,wave velocity,cohesion and strength of rock materials have deteriorated to different degrees while the thermal treatment temperature exceeds 400°C.Existing investigations have recognized the critical role played by internal micro-defects in degenerative activities (Freire-Lista et al.,2016),and acoustic emission (Dunand-Châtellet and Moumni,2012;Fan et al.,2017;Xu and Zhang,2018;Wang et al.,2022),computed tomography(CT)(Cheon and Park,2016;Minde et al.,2018;Vicente et al.,2018) and magnetic resonance imaging (MRI) (Li et al.,2018a,b,c,2021) have all monitored traces of micro-defects.Nevertheless,when the temperature is between 100 and 400°C,the rocks often exhibit strengthening rather than weakening(Yavuz et al.,2010),surveys such as that conducted by Wong et al.(2020)have indicated it can be attributed to the porosity,mineral morphology,water content,as well as thermal expansion of the rocks.
It is worth noting that the damage and fatigue behavior of materials under temperature and cyclic loading is a widely discussed topic in the field of new materials (Heidari-Rarani et al.,2014;Rigotti et al.,2021),and has recently started to receive growing attention in the area of rock engineering as well.Previous reports from Kendrick et al.(2013) suggested that high temperatures and cyclic stress loading can induce a reduction in rock strength and confirmed that volcanic rocks may be weakened by repeated expansion and tightening of the volcanic edifice.However,the deterioration of rock mechanical properties owing to the temperature and cyclic loading is not limited to this.Chen et al.(2012) reported that 400°C can be a threshold temperature that delineates the dependent mode of rock fatigue strength and found a linear relationship between the damage parameters and fatigue life.Recent evidence suggests that the effect of temperature on the fatigue behavior of rock materials is likely to be manifested by controlling the microscopic defects in the minerals,and real-time observations at the microscopic scale also show that high temperatures alter the strength of mineral grain boundaries within the rock,thereby affecting the mode of fatigue crack propagation(Wang et al.,2021).Accordingly,some intrinsic models considering temperature and cyclic stress perturbations have been introduced to describe the cumulative damage properties of rocks.These models include the strength criterion based on the principle of minimum energy dissipation and damage variables incorporating temperature and cyclic stress(Xia et al.,2015),damage constitutive model based on extended Weibull distribution statistical theory(Zhou et al.,2017) and damage evolution model based on freezethaw fatigue load coupled damage variables (Wang et al.,2021).Concerning the energy evolution during the damage of rocks induced by temperature and cyclic loading,Zhao et al.(2022)experimentally performed increasing amplitude cyclic loading on granite specimens at 25°C-600°C.The results demonstrate that the stress hardening existed during the heating and cyclic loading.The energy evolution characteristics of the granite change from nonlinear to linear as the temperature exceeded 200°C.
Although cyclic loading at the high strain rate has hitherto received scant attention from scholars compared to low strain rate loading,much less information is available on the effects of low cyclic loading at the high strain rates.However,similar hardening phenomena were found in black mica granite subjected to cyclic SHPB impact testing after thermal treatment at 200°C.Besides,the results show that the lowest damage threshold and axial cleavage pattern occurred at 600°C(Wang et al.,2018).Investigations from Wang et al.(2019)experimentally demonstrated that the dynamic strength and resistance to deformation of granite gradually deteriorate with increasing impact number.According to the assessment of the relationship between temperature and energy dissipation characteristics,impact number and failure mode of coal rocks based on the SHPB test reported by Shu et al.(2019),it is clear that the higher the temperature,the lower the absorbed energy and impact number,and the more drastic the fragmentation.
It is readily noticed that the above studies focus mainly on the testing and analysis of intact rocks,whereas the encountered rock masses are usually fragmented in engineering practice (Fig.1).Natural processes like rock formation,tectonics,and weathering can create structural surfaces such as joints,faults,laminae,unloading fissures,and weathering fissures in rocks.Artificial activities like mining,blasting,excavation,unloading,and hydraulic fracturing can also result in the formation of structural surfaces in the rock(Gentier et al.,2000).Although the structural surfaces have weakened the rock integrity and mechanical performance to some extent,the engineering rock masses with defects are also exposed to frequent dynamic and thermal stress perturbations.It poses numerous potential risks to engineering activities and increases the cost of prevention,monitoring,and treatment in budgets.In recent years,there has been a growing interest among researchers in studying defective rocks.However,few studies have documented the dynamic behavior of defective rocks under high temperature and cyclic high strain rate loading conditions.

Fig.1.Engineering rock mass containing typical fissures:(a)A pillar bisected by a large angular discontinuity in underground stone mine in the United States (Esterhuizen et al.,2011);(b) Fault f42 exposed in the upstream sidewall (Ding et al.,2019);(c)Typical jointed rock masses collected from Quebec,Canada (Li and Ji,2021);and (d)Fissures encountered in Kaiyang phosphate mining in Guiyang,Guizhou,China.
In this work,the red sandstone is processed into standard samples containing a single fissure at angles of 0°,30°,60°,and 90°,and thermal treatments at 25°C,200°C,400°C,600°C,and 800°C are applied.Subsequently,the geometry,density,wave velocity,mineralogy,and thermal properties of the specimens are measured using electronic vernier calipers,electronic balance,wave velocity meter,X-ray diffractometer (XRD),and synchronous thermal analyzer (STA),respectively.By utilizing a modified SHPB device,we conduct the constant-amplitude and low-cycle (CALC) impact tests on the specimens,and the microscopic features of the fracture surface of the specimens are examined by employing SEM.Finally,the impacts of fissure angles and temperatures on the dynamic and fracture behaviors of CALC treated samples are analyzed.The discussion focuses on thermal properties,thermal stress development,thermal damage,stress wave transfer behavior,and structural features.
2.Methodology
2.1.Material features and sample preparation
A red sandstone (red arkose) from China was selected in this study,which is widely distributed in central and southern China,and is the most representative in Sichuan,Hunan,and Jiangxi provinces (Fig.2).As well,it is very common in engineering rock masses.The preliminary description of the lithology is characterized by a dark red color and a fine-grained structure with high rounding and good sortability.No evidence of bedding,joints,or fissures can be observed.The Mohs hardness ranges from 5 to 6.

Fig.2.Geological profile information of the sample distribution area.
The XRD tests were performed on the specimens to provide an insight into mineral composition.The results plotted in Fig.3a demonstrate that the red sandstone is composed of quartz(43.7%),feldspar (32.4%),calcite (13.8%),chlorite (4.2%),mica (3.9%),and hematite (2%).The red sandstone was machined into cylindrical specimens with a diameter of 50 mm and an aspect ratio of 1:1.The flatness and perpendicularity to the axis of the specimens were maintained within 0.02 mm and 0.001 rad,respectively,all as per the ISRM (Zhou et al.,2012) recommended standard for dynamic compression testing of rock (Zhou et al.,2012).In particular,the quasi-static uniaxial compression curve of the intact standard sample was obtained using INSTRON 1346 as shown in Fig.3b,and the basic physical and mechanical parameters of the red sandstone are also given in Table 1.

Table 1Basic physical and mechanical parameters of the red sandstone.

Fig.3.(a) XRD patterns and mineral composition (Chen et al.,2021);and (b) Stress-strain curve of intact red sandstone under quasi-static uniaxial compression.
Subsequently,a penetration fissure with a length of 15 mm and a width of 1.2 mm,with an error margin of less than 0.02 mm,was precisely machined in the center of the cylindrical specimen(diameter:50 mm,height:50 mm)using the waterjet and diamond wire.The angles between the fissure and the axis are 0°,30°,60°and 90°,and the details can be found in Fig.4.
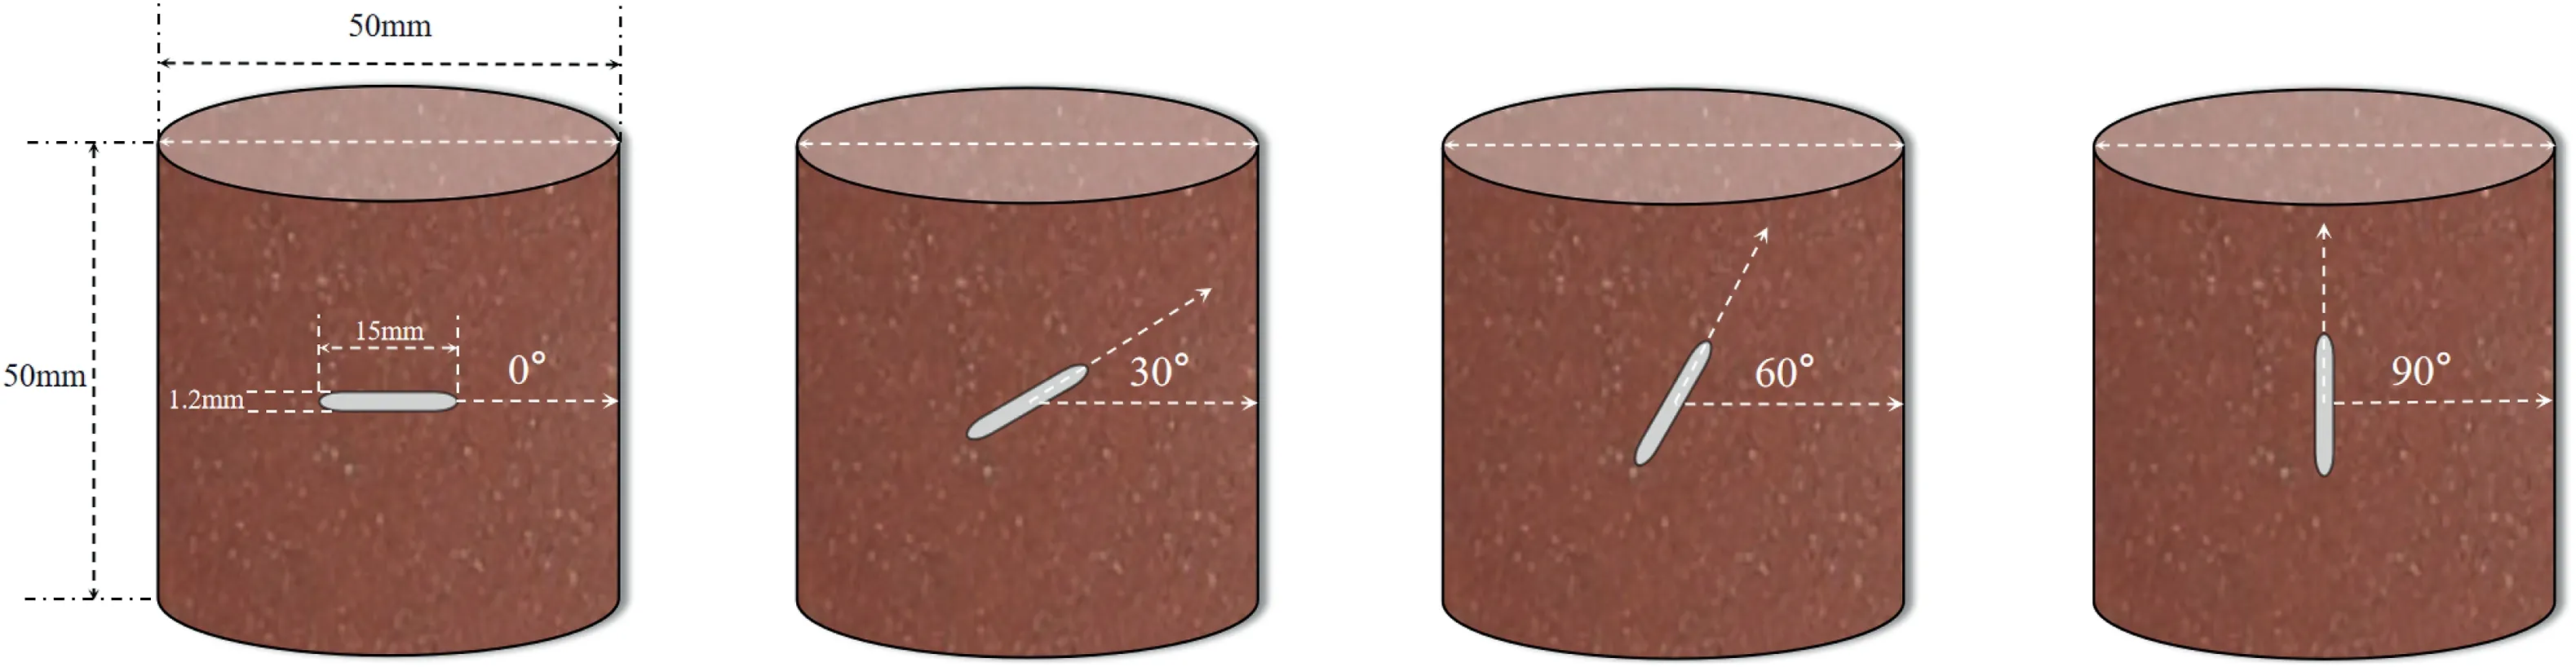
Fig.4.Schematic diagrams of the red sandstone containing single prefabricated fissure.
2.2.Thermal treatment
It was determined that the specimens were divided into five groups for thermal treatment at 25°C,200°C,400°C,600°C,and 800°C to recreate as much as possible the high temperature perturbations in the real engineering environment.All the thermal treatments were carried out in a muffle furnace with an external electronic temperature controller.For the sake of homogenous thermal treatment and avoiding thermal shock,both heating and cooling rates were set at 2°C/min,and then maintained at a constant temperature for 2 h after reaching the defined value,as shown in Fig.5.
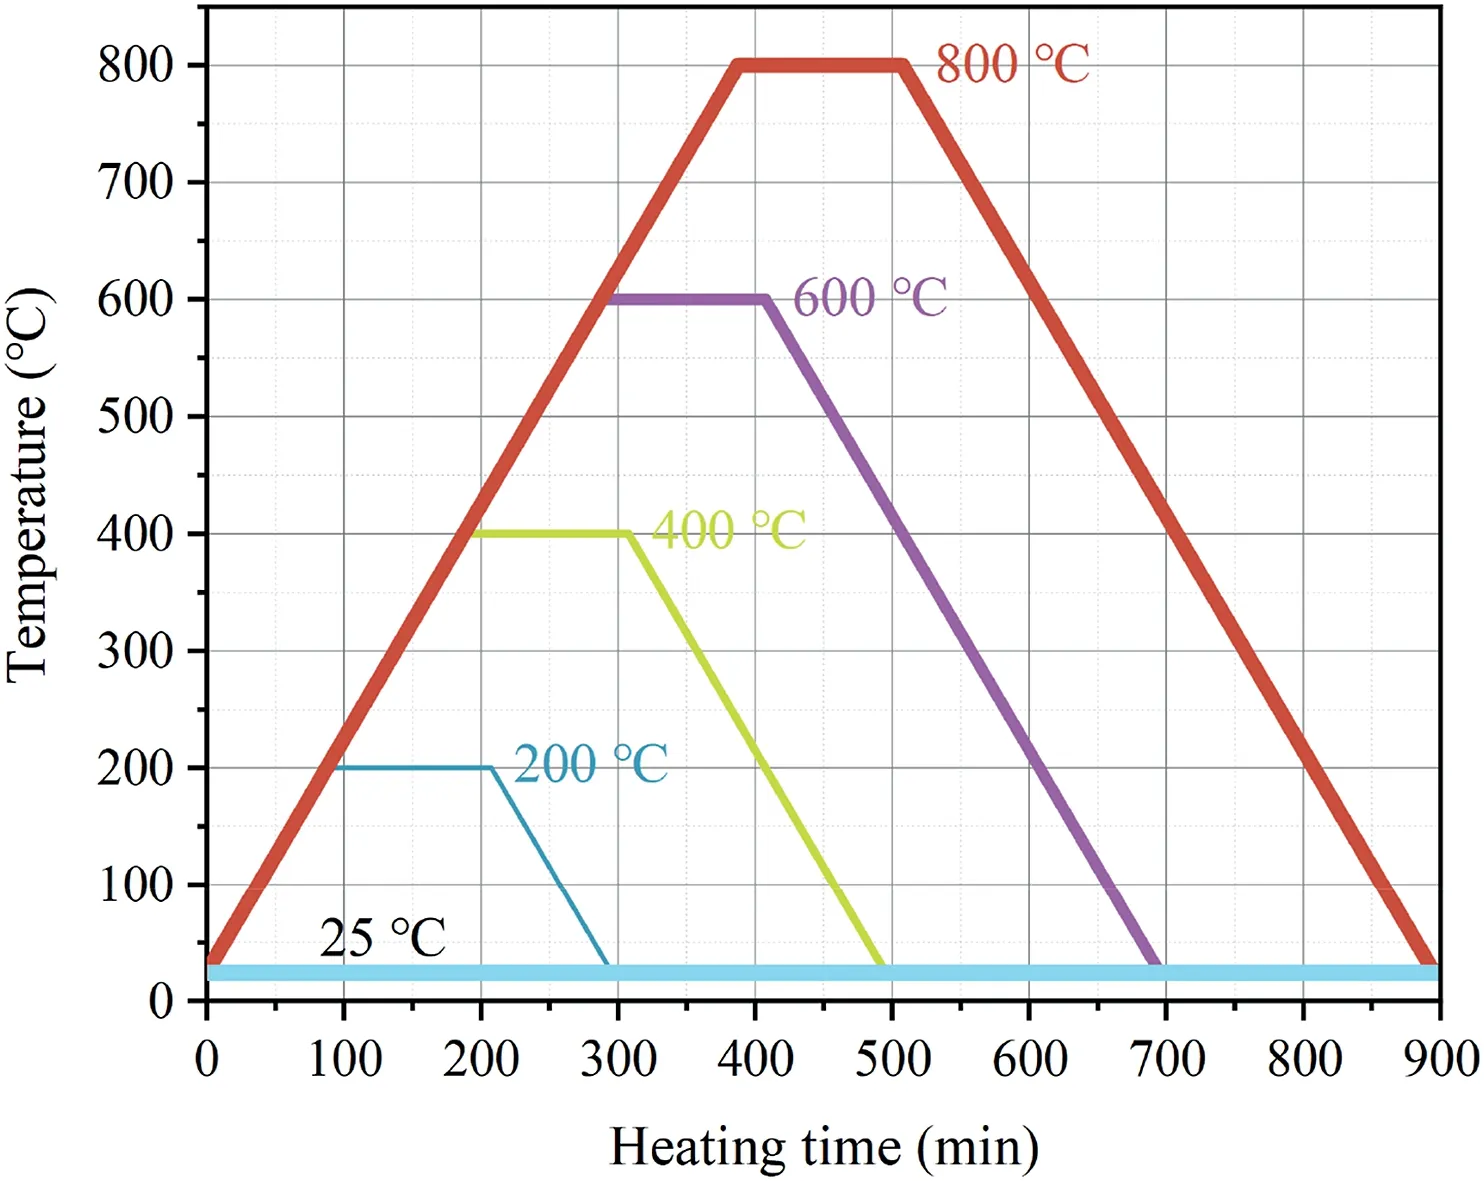
Fig.5.Heating path of the specimen at each temperature level.
2.3.Experimental setup and scheme
As depicted in Fig.6,the experimental setup and procedure are provided.The whole experimental procedure can be divided into three parts:(1)Part I:the size,mass,density,wave velocity,mineral fraction,thermal treatment,and thermal parameters of the specimens are determined using electronic vernier calipers,electronic balance,wave velocity meter,temperature-controlled muffle furnace,XRD,and STA;(2) Part II: the SHPB system for testing the CALC impact mechanical parameters of the specimens;and(3)Part III: SEM for recording microscopic information of fracture morphology.Further,wave velocity and density of all specimensbefore and after thermal treatment were tested and recorded prior to the SHPB impact test,as illustrated in Fig.6b.

Fig.6.Schematic diagrams of the experimental procedure and apparatus.
2.3.1.Dynamic loading system
The SHPB test system consists of the incident bar,transmitted bar,absorbing bar,spindle punch,nitrogen-driven gas gun,laser speedometer,ultra-dynamic strain gauge,and oscilloscope.The rod and punch are made of 40Cr alloy steel with diameters,modulus of elasticity,P-wave velocity,and density of 50 mm,233 GPa,5458 m/s,and 817 kg/m3,respectively.It is noteworthy that the spindle punch,in comparison to cylindrical and other shapes,has the ability to transform the incoming waveform into a half-sine waveform.This results in constant strain rate loading and effectively eliminates high-frequency oscillations (Li et al.,2008).
In the SHPB experiment,the spindle punch acquires energy from the instantaneous release of gas pressure and then strikes the incident bar at a certain velocity,which generates the onedimensional (1D) stress pulse.By converting the captured voltage signal,the axial stress,strain,and strain rate in the SHPB experiment can be derived from the following equations (Li,2014):
where σ(t),ε(t),(t)andASare the axial compressive stress,strain,strain rate and cross-sectional area of the specimen,respectively;A,EandCdenote the end area,elastic modulus and 1D longitudinal wave velocity of the alloy bar,respectively;εi(t) is the incident wave;εr(t)is the reflected wave;εt(t)is the transmitted wave;andLsis the length of the specimen.Moreover,the dynamic forcesPiandPtat the incident and transmitted ends of the specimen,respectively,can be given by the following equations (Zhou et al.,2012):
The validity of SHPB experiments follows several key principles:
(1) The system needs to be in a strictly 1D stress state.The diameter of the bar and the specimen in this study are both 50 mm.
(2) The specimen needs to reach dynamic stress equilibrium before failure (Fig.7).
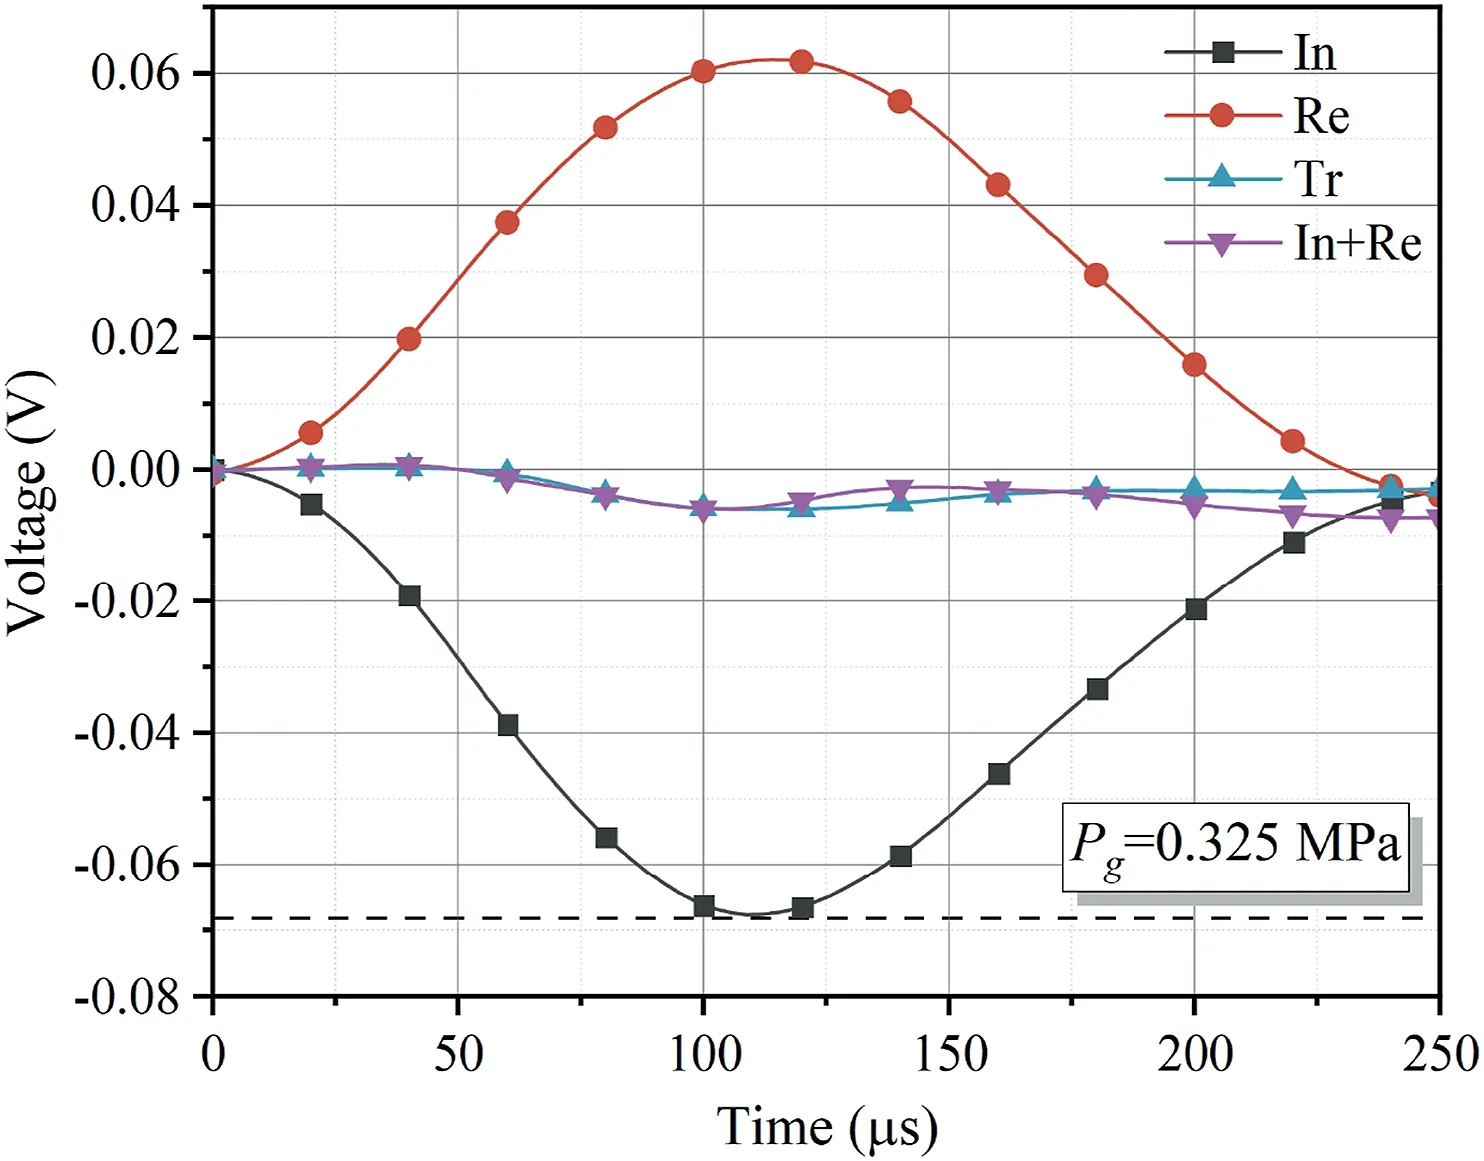
Fig.7.Dynamic stress state of specimen during CALC impact (In: Incident wave,Re:Reflected wave,Tr: Transmitted wave,specimen No.30-800-2-2, Pg is the reading of valve installed on the nitrogen tank).
(3) The aspect ratio of the rock sample needs to be set reasonably to eliminate the effects of lateral inertia and end effects as much as possible.The aspect ratio in this study is 1:1.
(4) The contact surface between the specimen and the incident bar is evenly coated with a layer of the coupling agent such as grease or Vaseline to reduce the friction effect.Additionally,the ends of the specimen should be flat to 0.02 mm and the perpendicularity to the axis of the specimen should not exceed 0.001 rad.
2.3.2.CALC impact tests
Generally,under the cyclic action of a certain magnitude of disturbance load,the partial material can gradually generate permanent cumulative damage.Once the magnitude of cyclic loading surpasses a critical threshold,the accumulated material damage results in the formation of macroscopic cracks or sudden,complete fracture,known as fatigue damage.It is already shown in many studies that the mechanical properties of rock specimens treated at 800°C are significantly degraded compared to 25°C-600°C.Hence,a series of CALC impacts on the specimens after treatment at 800°C was conducted as pre-tests in order to determine the appropriate incident stress.Fig.8 presents the crack evolution of the specimens after four impacts at 0.325 MPa.It can be observed that microcracks appear in the first impact and grow with the increasing impact times,eventually failing in the fourth impact.

Fig.8.Crack evolution of the specimen treated at 800 °C in pre-test at gas pressure of 0.325 MPa.
Hence,the gas pressure of 0.325 MPa can be determined as the disturbance amplitude.It can be seen from Fig.9 that the stability of the SHPB system can be basically guaranteed constant incident stress for each impact.
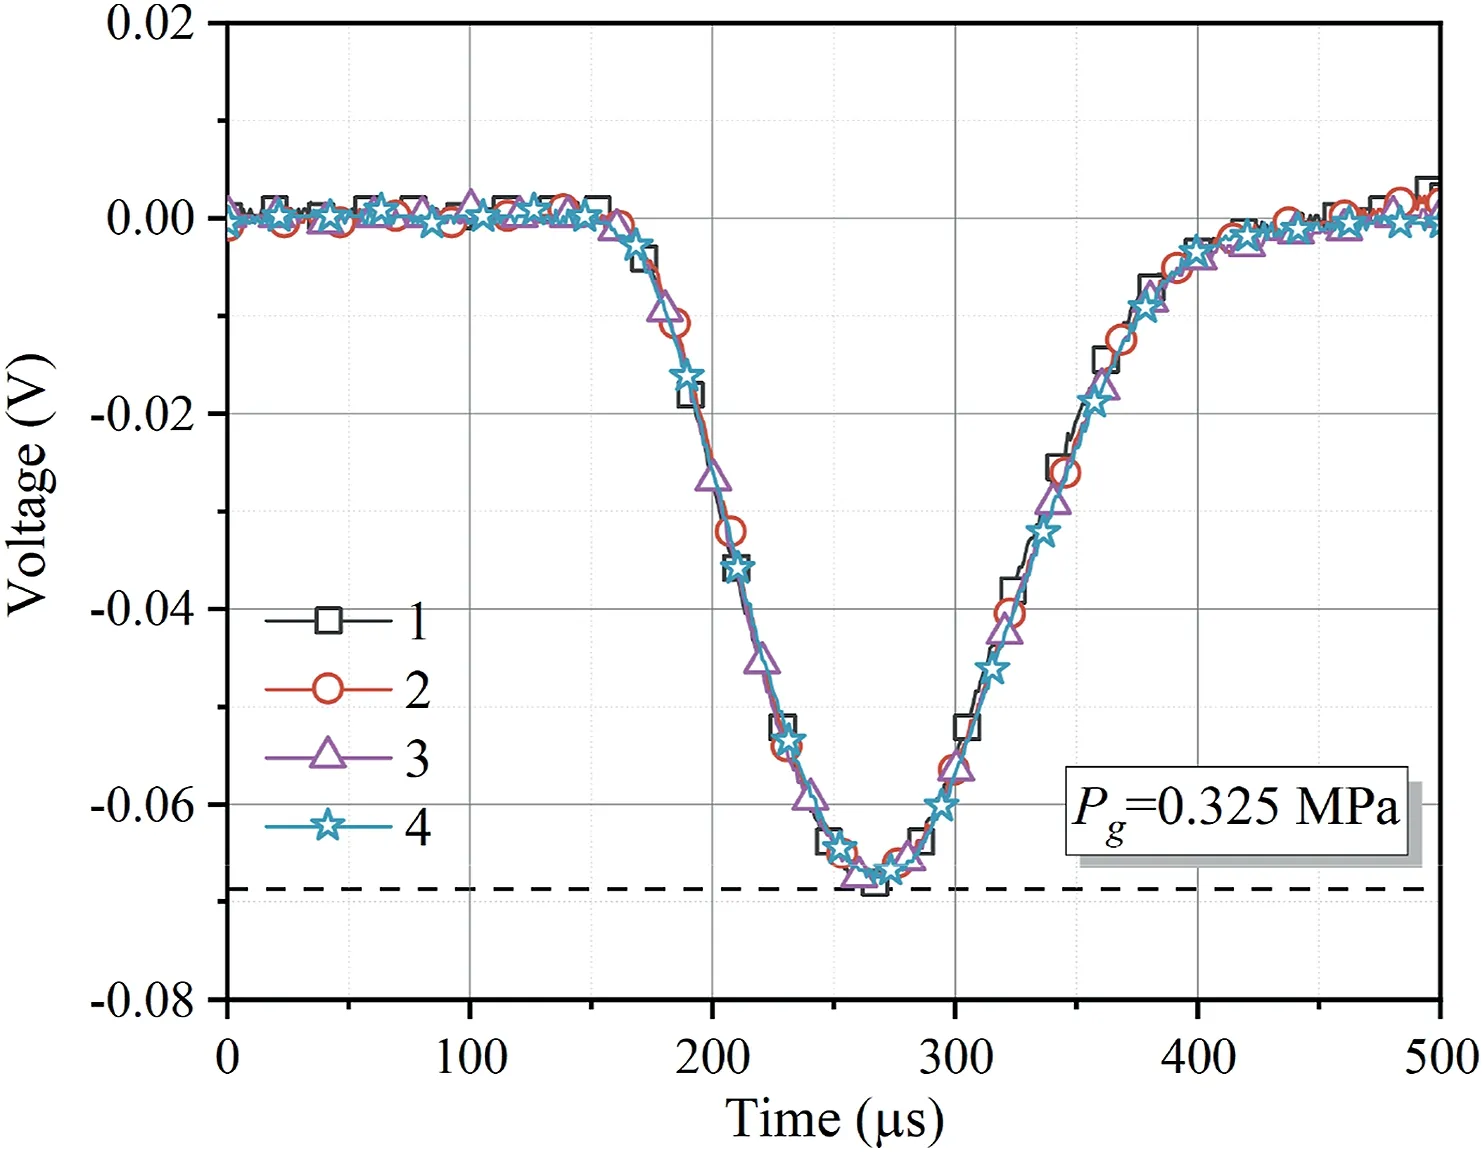
Fig.9.Incident waveform at cyclic impact gas pressure of 0.325 MPa.
3.Results
The average values of the basic physical parameters (radius,height,density,P-wave velocity,and dynamic elastic modulus) of the specimens before and after thermal treatment are presented in Table 2.The parameters are denoted asD,L,ρ,VpandEdfor the specimens prior to thermal treatment,and asD1,L2,ρ1,Vp1andEd1for the specimens after thermal treatment,respectively.Here the dynamic elastic modulus is derived from the equation below(Huang et al.,2010;Kim et al.,2017):

Table 2Average values of basic physical parameters of red sandstone containing fissure with different angles before and after thermal treatment.
where μ is the Poisson’s ratio of the specimen.
3.1.Characteristics of density and wave velocity of specimens before and after thermal treatment
The average density loss rateDkand the average P-wave velocity loss ratePkof the specimen can be employed to describe the state of density and P-wave velocity response to the thermal treatment.TheDkandPkcan be given by the following equations:
whereD0andP0are the average density and average P-wave velocity at 25°C,respectively;andDTandPTare the average density and average P-wave velocity at the thermal treatment temperatureT,respectively.
Fig.10 depicts the effect of thermal treatment on density and Pwave velocity.As can be seen from Fig.10a,the density and P-wave velocity of the specimens keep deteriorating at 200°C-800°C.With respect to the average density at 25°C,the density of the specimen decreased by 3.04% and 4.72% at 600°C and 800°C,respectively.What is noteworthy is that the decrease of the average density at 400°C is only 1.57%,yet the deterioration trend is the strongest.Fig.10b shows that the temperature degradation effect is more pronounced for the P-wave velocity compared to the density.Specifically,the average wave velocity keeps decreasing after an increase of 7.98% at 200°C,and the peak rate of decrease is observed at 600°C,which is about 13.53 times that at 400°C.In addition,DkandPkin this study can be described withTby the relationships given in the figure.

Fig.10.Characteristics of the changes in the basic physical parameters of the specimens before and after treatment at different temperatures:(a)Density and(b)P-wave velocity.
3.2.Dynamic elastic modulus of thermally treated specimens
As an important parameter of the mechanical properties of rock materials,the dynamic elastic modulus can reflect the performance of the material under dynamic loading.Eq.(9)can be employed to characterize variation of the dynamic elastic modulus of the specimens affected by thermal treatment.
whereE0is the average dynamic elastic modulus at 25°C,ETis the average dynamic elastic modulus at the thermal treatment temperatureT,andEkis the deterioration rate of the average dynamic elastic modulus.
The effect of thermal treatment temperature on the dynamic elastic modulus is illustrated in Fig.11.To some extent,the deterioration trend is similar to the performance of the P-wave velocity,particularly at 200°C where the average increase in the dynamic elastic modulus of the specimens attains 17.23%.Also,the pronounced deterioration of the dynamic elastic modulus of the specimens can be observed at 400°C-800°C.The dynamic elastic modulus decreases most sharply at 600°C,reaching an average decrease of 80.95%as a peak at 800°C,which is more dramatic with respect to the density and P-wave velocity.Furthermore,based on the fitting results withR2=0.95 plotted in Fig.11a,the relationship betweenTandEkis also provided.

Fig.11.Patterns of the effect of thermal treatment on the dynamic elastic modulus of specimens:(a)Variation characteristics of the dynamic elastic modulus of specimens before and after treatment at different temperatures,and (b) Statistical characteristics of dynamic elastic modulus of specimens with different fissure angles within the same thermal treatment range.
On the other hand,it can be seen from Fig.11b that the influence of thermal treatment on the dispersion of the dynamic elastic modulus at the same fissure angle is negligible and no outliers appear.It should be mentioned that the dynamic elastic modulus of the specimens with a fissure angle of 90°is greater than that of the other angles under the same thermal treatment temperature.This may imply that specimens with such inclined fissure behave superiorly to other specimens in terms of mechanical properties.
3.3.Variations in the thermal properties of minerals
The X-ray diffraction patterns of the red sandstone at each thermal treatment level are given in Fig.12.The representative behavior is represented by the increase of quartz content to 51.6%and 43.7% at 400°C and 800°C,respectively.The content of feldspar shows a drop peak at 400°C with 17.59%.However,at 600°C,it increases by 12.35%instead.In contrast,the calcite content starts to decrease significantly after 400°C and reaches a peak reduction until 800°C.On the other hand,as a hydrous mineral,chlorite manifests the most marked sensitivity to temperature.The drop reaches 35.71% at 200°C and then increases to 100% with increasing temperatures.Similarly,mica decreases at 200°C by 53.85% which is the sharpest decrease in all minerals at the same temperature level,and even after 400°C,its average decrease is above about 35%.With better thermal stability and low water content,the hematite content only starts to decrease after 400°C.
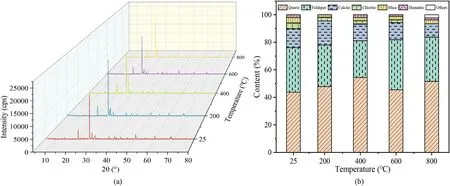
Fig.12.Mineral analysis of red sandstone after different temperature treatments: (a) X-ray diffraction patterns,and (b) Mineral content (Chen et al.,2021).
3.4.Dynamic characteristics in CALC impact
3.4.1.Fatigue strength,strain rate and life
The dynamic parameters obtained from the CALC impact for the specimens after thermal treatments are selected and listed in Table 3.The parameters include fatigue strength (σf),strain (∊f),strain rate(f)at failure,and fatigue life(FL),which is defined as the number of cycles to failure for each specimen.

Table 3CALC impact dynamic parameters of specimens.
As it is found in Fig.13a,compared to 25°C,the fatigue strengths of the specimens all show different degrees of increase at 200°C and the magnitude is between 4.64% and 8.44%.The average decrease in fatigue strength is only 2.05%,indicating a limited sensitivity to the thermal treatment temperature of 400°C.The fatigue strength at 600°C and 800°C deteriorates significantly with average reductions of 24.57% and 69%,respectively.
The impact of fissure angle on the fatigue failure strength of specimens subjected to the same thermal treatment temperature is noteworthy and can be intuitively perceived.It can be observed that an increase in fissure angle results in an increase in fatigue strength,with this effect becoming more pronounced at higher temperatures.At 25°C,the fatigue strength at α=30°,60°and 90°increases by 3.02%,10.65% and 31.08%,respectively,compared to that at 0°.As the thermal treatment temperature increases to 400°C,no discernible change is observed.The fatigue strength increases by 7.73% and 18.46% at α=30°and 60°,respectively,when the temperature is raised to 600°C.However,it remains stable at 31.58% for α=90°.The angle effect becomes most conspicuous when the temperature rises to 800°C.The increase in fatigue strengths at α=30°,60°and 90°are 18.54%,110.46% and 230.11%,respectively.Additionally,the relationships between thermal treatment temperatures and the dynamic peak stress of the specimens can be given as
To further explore the connection between temperature and fissure angle and fatigue strength,a statistical analysis by RSM was applied to determine the best-fit regression model for fatigue strength.The response surface and contour plots of the fatigue strength of the specimens under the influence of temperatures and fissure angles are given in Fig.13b and c.It can be seen from the plots that the negative effect on the fatigue strength is more pronounced as the thermal treatment temperature exceeds 200°C.Conversely,the increasing fissure angle positively affects the fatigue strength.The best-fit regression model for fatigue strength,as derived from a statistical analysis of the relationship between the response variable (fatigue strength) and the interactive effects of independent variables (temperature and fissure angle),can be presented as follows based on the fitting results of RSM:
Each independent variable can be determined by how it affects the response variable through the value of its regression coefficient.R2reflects the reliability of the regression model.The similarity between the adjustedR2()and predictedR2()serves as an effective indicator for eliminating unnecessary variables of the model.In general,a difference between the two of 0.2 or less indicates that the complexity of the model,response transformation,outliers or block effects,etc.are within a reasonable range.Besides,the Adeq precision (Ap) measures the signal-tonoise ratio,which is desirable at greater than 4.This indicates that the signal is sufficient and the model can be employed to navigate the design space.The comprehensive evaluation ofR2,andApdemonstrates the validity of the regression model.
From Fig.13d,it can be found that the failure strain rate behaves basically opposite regarding the influence patterns of thermal treatment temperatures and fissure angles on the peak stress.The failure strain rate of the specimen at 200°C decreases by an average of 8.23%relative to 25°C,while it increases by more than 6.11% at 400°C.It is noteworthy that as the temperature increases to 600°C and 800°C,the failure strain rate increases by more than 30% and 60%,respectively.Contrary to the effect pattern of angle found in the peak stress,the failure strain rate decreases with increasing fissure angles.Concretely,the failure strain rate decreases by 6%,23.36% and 33.47% at 25°C for α=30°,60°and 90°,respectively.Such a downward trend remains stable until 600°C,yet the failure strain rate decreases only 8.13% and 19.27% for α=60°and 90°,respectively.Also,the relationships between thermal treatment temperatures and the failure strain rate of the specimens can be given as
The response surface and contour plots of the failure strain rate of the specimens under the influence of temperatures and fissure angles are given in Fig.13e and f.What is noteworthy is that the response patterns of failure strain rate to the thermal treatment temperature and fissure angle are opposite to those of the fatigue strength.According to the fitting results of the response surface,the best-fit regression model for failure strain rate derived from a statistical analysis of the relationship between the response variable (failure strain rate) and interactive effects of independent variables(temperature and fissure angle)can be shown as follows:
The comprehensive evaluation ofR2,andApdemonstrates the validity of the regression model.
As far as the fatigue life of the specimens is concerned,it is clear from Fig.13g that the response of the specimen fatigue life to thermal treatment temperature is similar to that of the fatigue strength at the same fissure angle.At 200°C,there is also an increase in fatigue life versus 25°C,ranging from 14.29%to 63.33%for specimens with different fissure angles.When the thermal treatment temperature is 400°C,the average decrease in the fatigue life of the specimens reaches 13.93%,and then it reaches 34.4% and 70.71% at 600°C and 800°C,respectively.Simultaneously,the specimen fatigue life increases with the increase of fissure angle.At 25°C,the specimen fatigue life increases by 133.33%,366.67% and 900% versus 0°for α=30°,60°and 90°,respectively.This angle effect is most evident at 200°C,and the specimen fatigue life increases by 100%,325% and 1125% for α=30°,60°and 90°,respectively.However,this angle effect is weakening at 400°C-800°C.
Fig.13h and i depicts the response surface and contour plots of the fatigue life of the specimens affected by temperatures and fissure angles.A rapid decrease in the fatigue life can be observed after 200°C,especially at α=90°.Furthermore,the best-fit regression model for fatigue life,based on the relationship between the response variable(fatigue life,FL)and interactive effects of independent variables (temperature and fissure angle),is presented as follows:
Also,the comprehensive evaluation ofR2,andApdemonstrates the validity of the regression model.
3.4.2.Fatigue characteristics
In order to facilitate the evaluation of the mechanical behavior of the thermally treated specimens during CALC impact,the peak stress and strain rate are selected and plotted in Fig.14.It is noteworthy that the peak stress of the specimens during CALC impact exhibits an increase followed by a decrease.Such stress intensification is more apparent at a greater impact count.To some extent,the temperature effect can also be observed in the peak stress of the specimens during CALC impact,which can be supported by numerous clues.For instance,the average reduction of the maximum peak stress in the CALC impact is -4.31%,7.13%,26.05%and 72.9% (relative to 25°C) for the specimens treated at 200°C,400°C,600°C and 800°C,respectively.
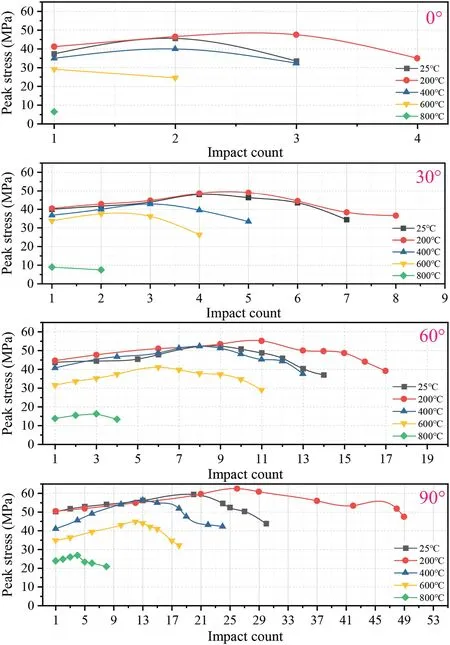
Fig.14.Variation patterns in peak stress of specimens after thermal treatment in CALC impact.
At the same thermal treatment temperature level,the peak stress of the specimens during the CALC impact test has a similarity to the failure strength,i.e.the greater the fissure angle,the greater the stress level.At 25°C,the maximum peak stress with fissure angles of 30°,60°and 90°increases by 5.35%,15.17% and 30.44%,respectively(relative to 0°).No significant change in the maximum peak stress is observed at 200°C,despite the fact that the overall stress level decreases after 400°C,the stress intensification induced by the angle effect remains strong.Conversely,the maximum peak stress increases by 7.3%,31.08% and 41.28% at 400°C for specimens with fissure angles of 30°,60°and 90°,respectively.As the temperature increases to 600°C,the peak stress intensification induced by the angle effect reinforces continuously,resulting in an increase of 41.83%,156.1% and 325.18% in the maximum peak stress at 800°C for specimens with fissure angles of 30°,60°and 90°,respectively.
To characterize in detail the peak stress intensification that occurs during CALC impact,we introduce a peak stress intensification factor,HP,which is given by the following equation:
where σPMand σP0are the maximum peak stress and peak stress in the first impact of a specimen that occur during a full CALC impact test,respectively.The larger theHS,the more pronounced the peak stress intensification of the specimen in CALC impact.Fig.15 provides the response surface and contour plots of theHPaffected by temperatures and fissure angles.It can been observed that the fissure angle is positive forHS,while the temperature has a negative effect on it.Specifically,HSdecreases with increasing temperatures at 400°C-800°C when α values are 0°and 30°.Whereas the stress intensification does not appear to weaken before 800°C when α values are 60°and 90°,and the minimumHSstill reaches 12.31%(α=90°).Additionally,the best-fit regression model forHPfrom the relationship between the response variable(HP)and interactive effects of independent variables(temperature and fissure angle)is illustrated as follows:

Fig.15.Response surface plots for peak stress intensification factor: (a) Interaction between temperatures and fissure angles,and (b) Contour.
The comprehensive evaluation ofR2,andApdemonstrates the validity of the regression model.
Similarly,Fig.16 presents the effect of thermal treatments and fissure angles on the relationship between the impact number and strain rate during CALC impact.Unlike the response of peak stress,the strain rate of the specimen during CALC impact exhibits a decrease followed by an increase,and such softening is also more obvious with a greater impact count.The strain rate of specimens during CALC impact has a similar response to temperature with respect to the strain rate at the destruction.The average increase in the minimum strain rate of the specimens during CALC impact is -10.7%,20.83%,69.75% and 187.29% (relative to 25°C) for the thermal treatment temperatures of 200°C,400°C,600°C and 800°C,respectively.As well,the minimum reduction in strain rate of specimens during CALC impact with respect to the first impact decreases with increasing temperatures (400°C-800°C) at α=0°and 30°.Instead,the strain rate softening is more pronounced at α=60°and 90°,despite a certain degradation caused by high temperatures,the lowest reduction in the minimum strain rate versus the first impact still reaches above 12.56% (60°,800°C).

Fig.16.Variation patterns in strain rate of specimens containing single fissure at different angles after thermal treatment in CALC impact.
At the same thermal treatment temperature level,the strain rate of the specimens during CALC impact manifests a similarity to the failure strain rate,i.e.the greater the fissure angle,the lower the strain rate.At 25°C,the minimum strain rate of the specimens with fissure angles of 30°,60°and 90°decreases by 14.89%,43.56% and 53.65%,respectively(relative to 0°).Similarly,the minimum strain rate is not significantly changed at 200°C,but the overall strain rate increases after 400°C and the strain rate softening due to the angle effect starts to weaken.As a concrete example,the minimum strain rate of the specimens at 400°C decreases by 13.91%,35.54% and 40.32% at α=30°,60°and 90°,respectively.The strain rate softening arising from the angle effect diminishes as the temperature increases to 600°C,the minimum strain rate for the specimens with fissure angles of 30°,60°and 90°decreases by 21.52%,36.4%and 47.79% at 800°C,respectively.
Similarly,to characterize in detail the strain rate softening that occurs during CALC impact,we introduce a strain rate softening factor,HS,which is given by
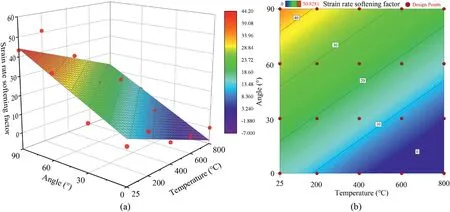
Fig.17.Response surface plots for strain rate softening factor: (a) Interaction between temperatures and fissure angles,and (b) Contour.
The comprehensive evaluation ofR2,andApdemonstrates the validity of the regression model.
3.4.3.Macro-and micro-scopic fatigue fracture features
The response mechanism of polycrystalline materials to crack propagation under CALC impact conditions is controlled by inertial force and reflected waves.Generally,cracks can be divided into the tensile crack(T),shear crack(S),and tensile-shear crack(TS)as per the form of principal stress.Further,the tensile and shear cracks can be categorized into T1-T3 and S1-S3,respectively,according to the form of crack morphology (Fig.18).
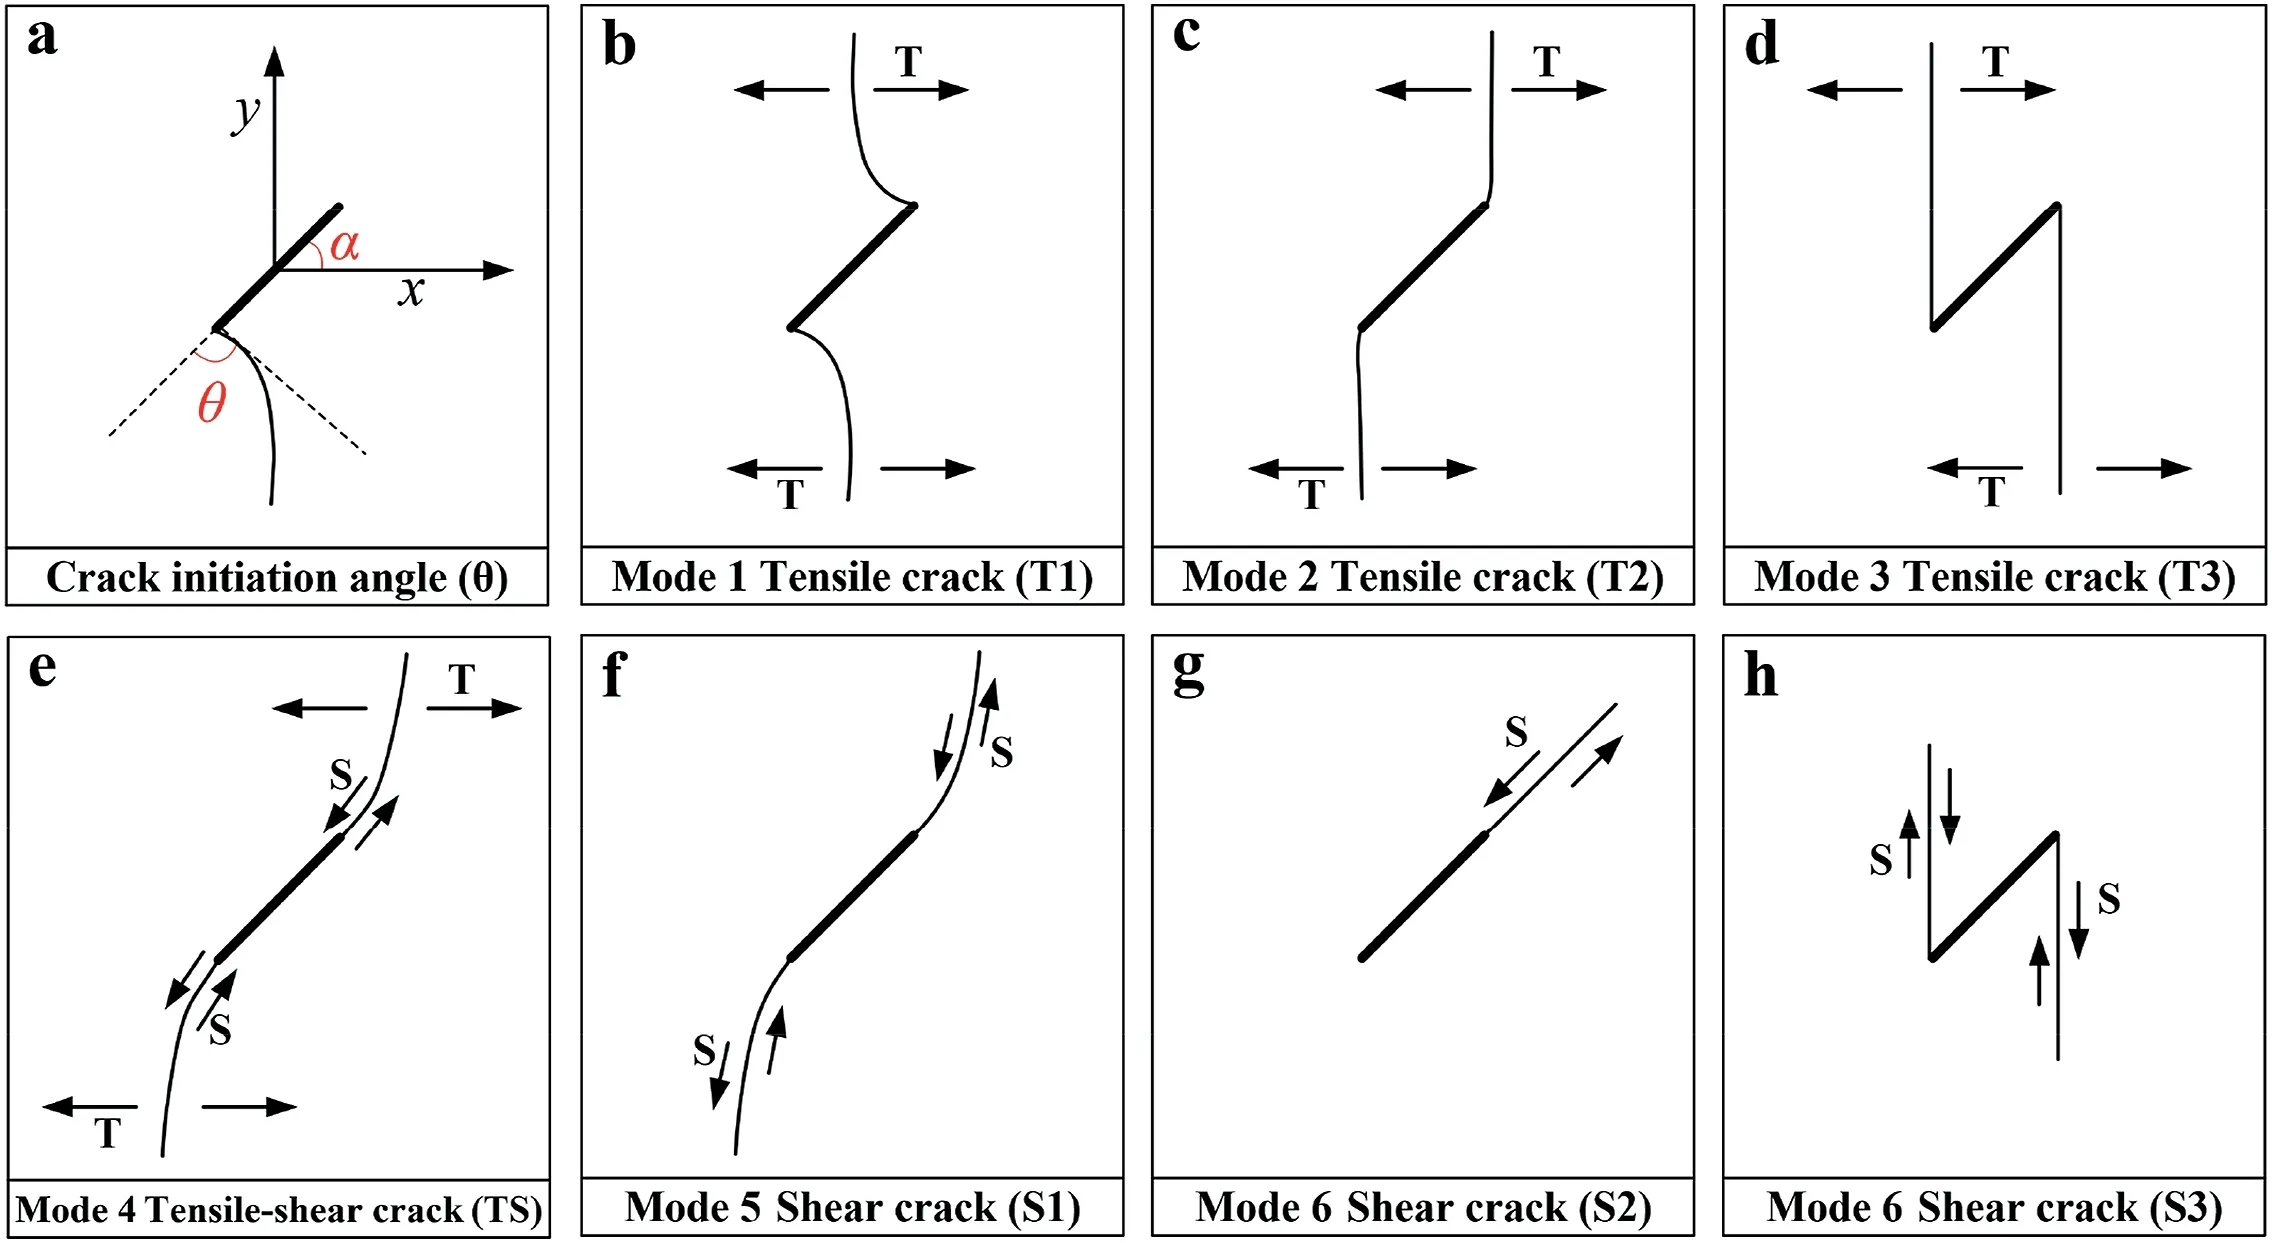
Fig.18.Definition of crack initiation angle and initial coordinate system:(a)The crack initiation angle θ is the angle between the tangential direction of the crack extension path at the initial initiation point and the original crack extension direction,in particular,positive values are anticlockwise and negative values are clockwise;(b-h)Evolutionary modes of typical prefabricated cracks (Wong and Einstein,2009).
The macroscopic fatigue failure modes of the specimens containing a single fissure with different angles under different thermal treatment temperature levels are given in Fig.19.The specimens after CALC impact failure show low fragmentation and the cracks almost expand strictly in single path until destruction.Moreover,no multipoint ruptures appear on the fracture surface,and no alternative crack paths can be observed.On the other hand,it is evident that the thermal treatment temperature and the fissure angle have a distinct effect on the CALC failure modes of the specimens.Regarding the fissure angles of 0°and 90°,the effect of temperature on the crack propagation path and macroscopic failure mode is not pronounced,which is mainly extended by mode I fracture.The crack surface is almost parallel to the direction of stress wave propagation and penetrates through the center of the specimen,which is a tensile splitting damage along the axial direction,and no additional macroscopic secondary cracks are found on the rock surface.While,for the fissure angles of 30°and 60°,the main crack morphology is dominated by wing cracks and tensile damage is predominant as well.It is different from the previous that the temperature has an obvious effect on the crack modes for the specimens at α=30°and 60°.As demonstrated in Fig.19,the predominant modes of fatigue failure in the specimens are T1 and T2 cracks,with only a few other macroscopic cracks observed at temperatures between 25°C-400°C.This suggests that tensile stress remains the driving force behind the growth of the primary crack.Although the failure crack modes remain dominated by T1 and T2 cracks at 600°C-800°C,other secondary cracks (fatigue cracks) can be found already in the vicinity of the prefabricated fissure.Also,it has been found that the first to appear on the rock surface during the experiments are not primary cracks but fatigue cracks.Notably,the expansion direction of fatigue cracks is nearly perpendicular to the propagation direction of the stress wave,which indicates that the thermal treatments have caused a shift in the previous simple tensile failure mode during the CALC impact.Furthermore,as far as the crack initiation angle is concerned,the crack initiation angle of the specimens with a fissure angle of 60°is generally greater than that of 30°,yet the effect of thermal treatment temperature on the initiation angle is not obvious.
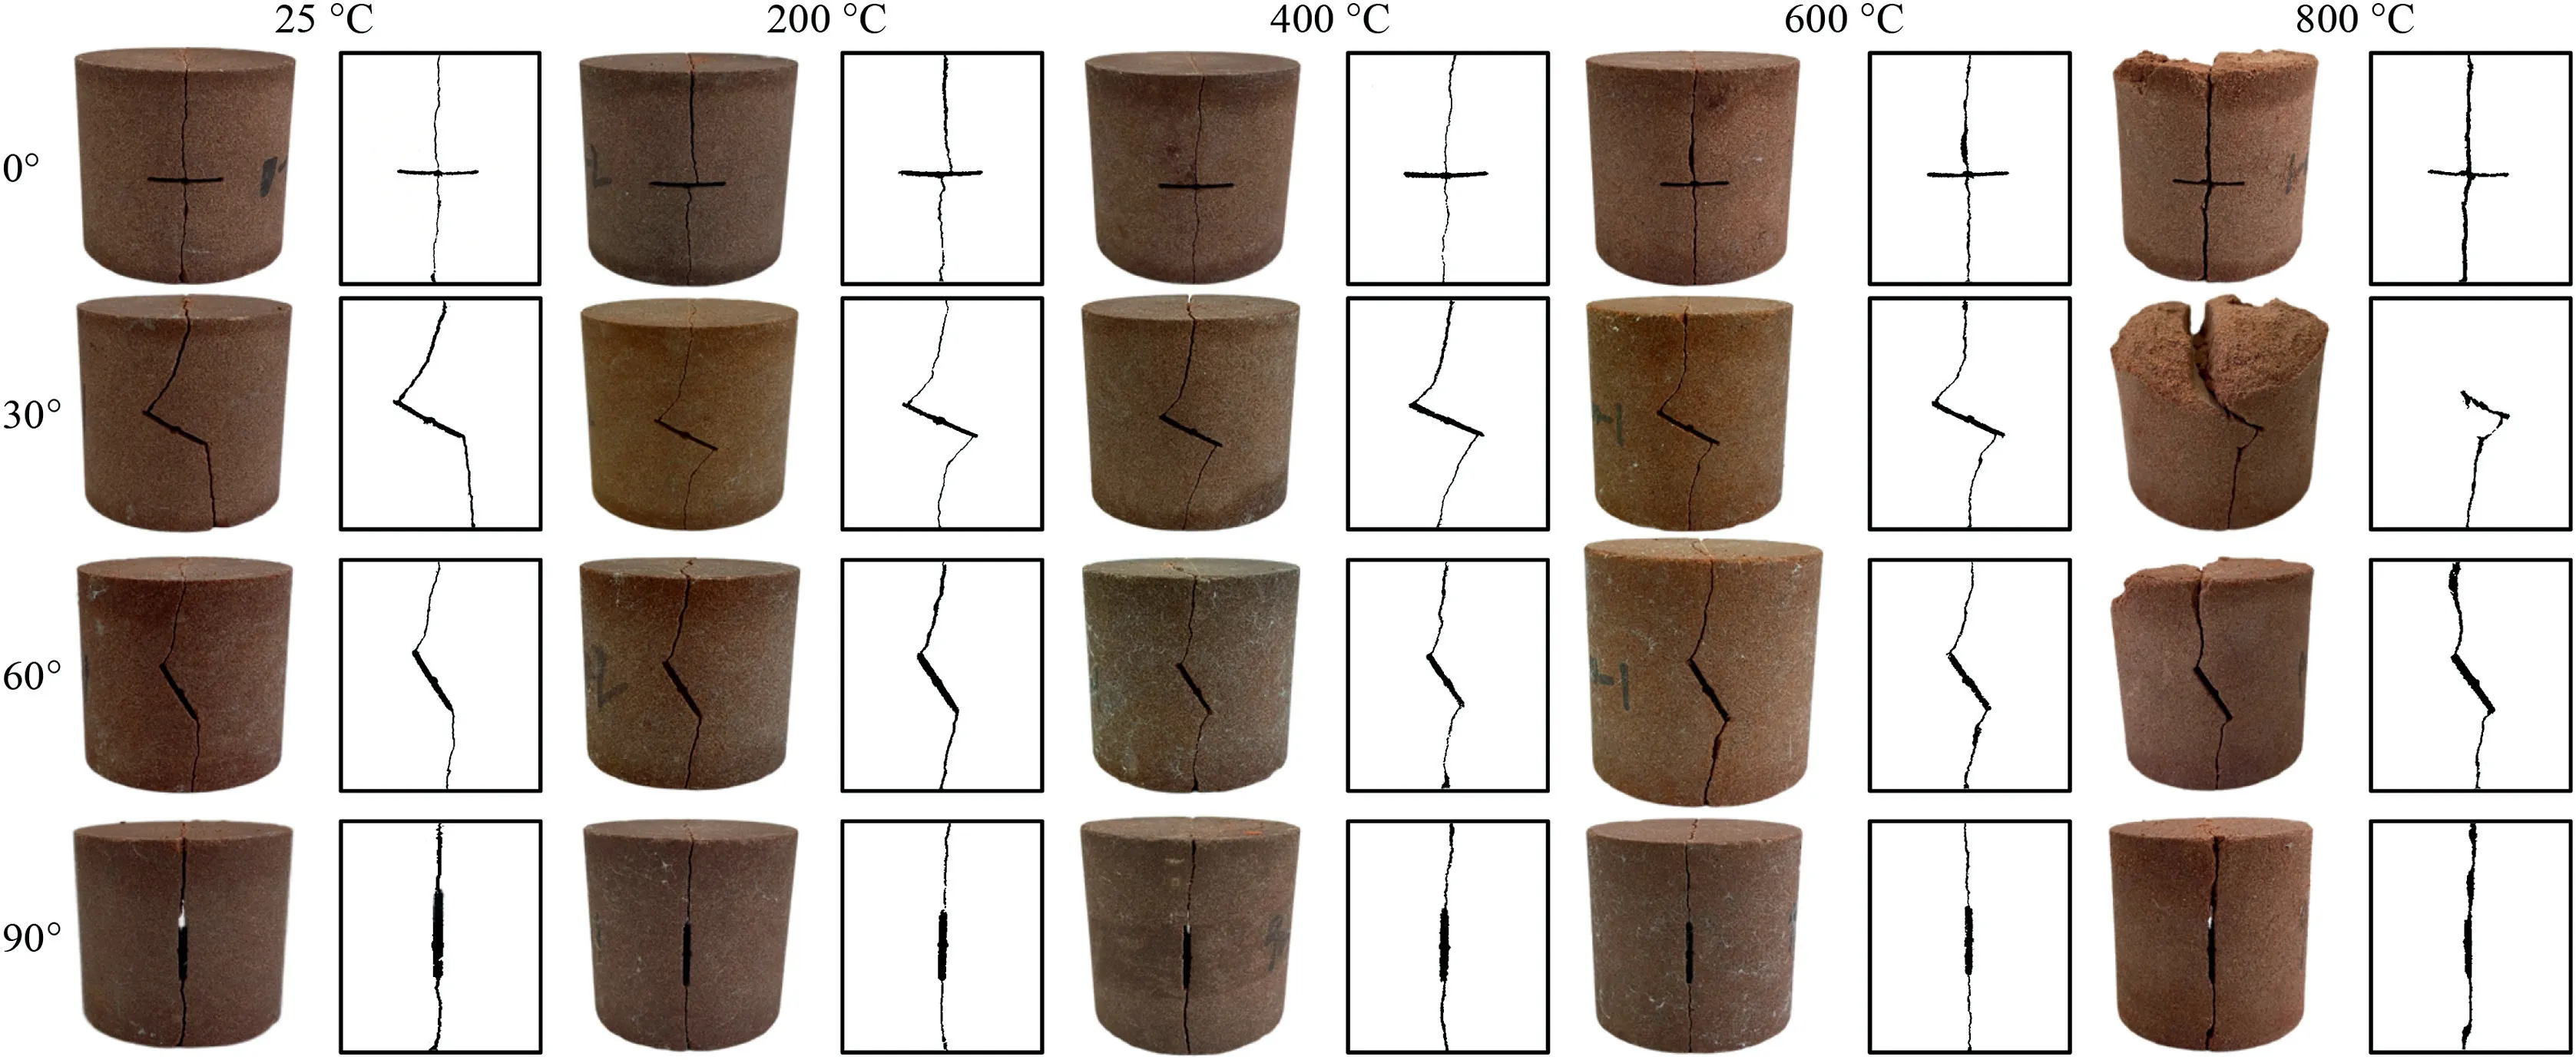
Fig.19.Typical failure patterns of specimens containing single fissure at different angles after thermal treatments in CALC impact.
The SEM results of the typical fractures of the specimens at different thermal treatment temperature conditions are given in Fig.20.The real morphology of mineral grains is not intuitive enough since the grain surface is partially wrapped by organic matter and clay minerals at 25°C.However,many irregular cracks and pores can still be found at the grain boundaries,which is the typical intergranular fracture.The reason for such cracks is attributed to the fact that the incident energy during CALC impact is not sufficient to rapidly damage the rock skeleton.Compared to the internal connection forces within the grains of the major rockforming minerals such as quartz and calcite,the weak connection forces at the grain boundaries can provide a low-energy fracture path.In other words,the critical strain energy release rate at the grain boundary is lower than that of the crack expansion within the grain,hence the crack will expand more easily along the boundary.And since the primary pores,organic matter and the layered structure in the silicate minerals of the rock can serve as a buffer to absorb part of the incident energy.This may lead to poor continuity in intergranular cracks,obvious passivation,and brittle fracture.Additionally,the transgranular cracks and fatigue cracks originating at the junction between the cement and the grain can also be observed.These cracks are primarily caused by the obstruction of the crack nucleus tip’s growth path and the misaligned deformation of mineral grains,as well as dislocation-induced slip.What needs to be mentioned is that the fatigue cracks are mainly distributed on individual grain fracture surfaces,which are distinct from the fatigue cracks in metallic materials.
The damage modes remain dominated by typical brittle fractures at 200°C-400°C.The compaction traces of pores and intergranular cracks are prominently visible post-CALC impact,as a result of weakened intergranular bonding due to the decomposition of organic matter and dehydration of hydrous minerals.Besides,the primary layered structures frequently occur within sandstone and have weak connections between structural surfaces.This further exacerbates the susceptibility of extended cracks to become compacted between the layered structures under CALC impact.As a result,many laminar fractures similar to cleavage steps appear at the scales of 1:50 and 1:20 μm.
As the thermal treatment temperatures rise to 600°C-800°C,the thermal decomposition of organic matter,minerals dehydration,quartz phase transition,and feldspar plasticization are basically finished.For these events,many damage cracks appear on the grain surfaces with regular crack edges and parallel arrangement,and the extension paths are blocked by grain boundaries.Under the action of CALC impact,the energy required for the expansion of intergranular cracks is diminished.The compaction between grains becomes more pronounced and the paths of intergranular cracks are more prone to converge towards the direction of the main stress.Moreover,CALC impact extrusion and high temperature induce an increase in the density of fatigue and thermal damage cracks.The micro cracks expand and connect within the grains eventually forming a typical compressor-crushed zone,and the development direction of the crushing zone basically coincides with the extension direction of the fatigue cracks.The occurrence of such compressor-crushed zone development and the plasticization of minerals are likely responsible for the main change in the macroscopic damage modes.
We calculated the GLCM of the SEM photographs at the 200 μm scale,i.e.A1-A5 in Fig.20,respectively.Meanwhile,4 s-order statistics including angular second-order moment (ASM),correlation (COR),entropy (ENT),and contrast (CON) in the reflecting image texture features in each GLCM were calculated using the following equations (Haralick et al.,1973):whereLis the grey level of the image;P(r,c) represents the elements of the GLCM;randcdenote the row and column elements of the matrix,respectively;andq1,q2,t1andt2are determined by
Fig.21 illustrates the relationships between temperatures as a function of second order statistics.As can be seen,temperatures have a positive effect on ASM and COR.This indicates that as the temperature increases,the difference in elements of the GLCM in the SEM image becomes greater and more concentrated,i.e.the texture becomes coarser.To some extent,it also contributes to quantifying of the microcracks.Yet,increasing temperatures demonstrate a negative impact on ENT and CON.This indicates that as the temperature increases,the non-uniformity of the element distribution in the GLCM of the SEM image increases,resulting in a more complex the texture in the image.It may also imply that the mineral grains become coarser which has been confirmed by the report from Singh et al.(2019).

Fig.21.Four second-order statistics characteristics of SEM versus temperatures at a scale of 200 μm.The shadow areas refer to the standard deviations of the second order statistics in the 0°,45°,90° and 135° directions,which can reflect the dispersion degree of the second order statistic.
On the other hand,in terms of the characteristics of the effect of temperature on the shadow areas in the graph,the shadow areas increase with increasing temperatures.This point implies that the rising temperatures contribute to the dispersion of the secondorder statistics of the GLCM of the image in all directions.And this promotion is more dramatic after the thermal treatment temperature reaches 400°C.Moreover,the fit functions between the second order statistics and the temperatures are given in plots,with a minimumR2value of 0.96,which proves the validity of the fit results.
4.Discussion
4.1.Thermal properties
The macroscopic mechanical properties of rock materials are dramatically altered by high temperatures,which have been well documented and interpreted by numerous experiments and theories (Waples and Waples,2004;Rossi et al.,2018;Zhao et al.,2022).Unlike most materials,rocks are commonly perceived as polycrystalline materials with a three-phase structure.The macroscopic mechanical properties of rocks are determined by the internal mineral composition,crystal structure,and water fugacity.It is widely accepted that water in rocks exists mainly in the form of bound and free water (such as gravity water,capillary water,and gaseous water) in the primary and secondary voids of rocks involved in constructing the rock skeleton (Masuda,2001).To further discuss the effects of thermal treatments on the materialistic properties of the red sandstone,the thermal properties of the specimens at 0°C-800°C obtained utilizing the STA are given in Fig.22.
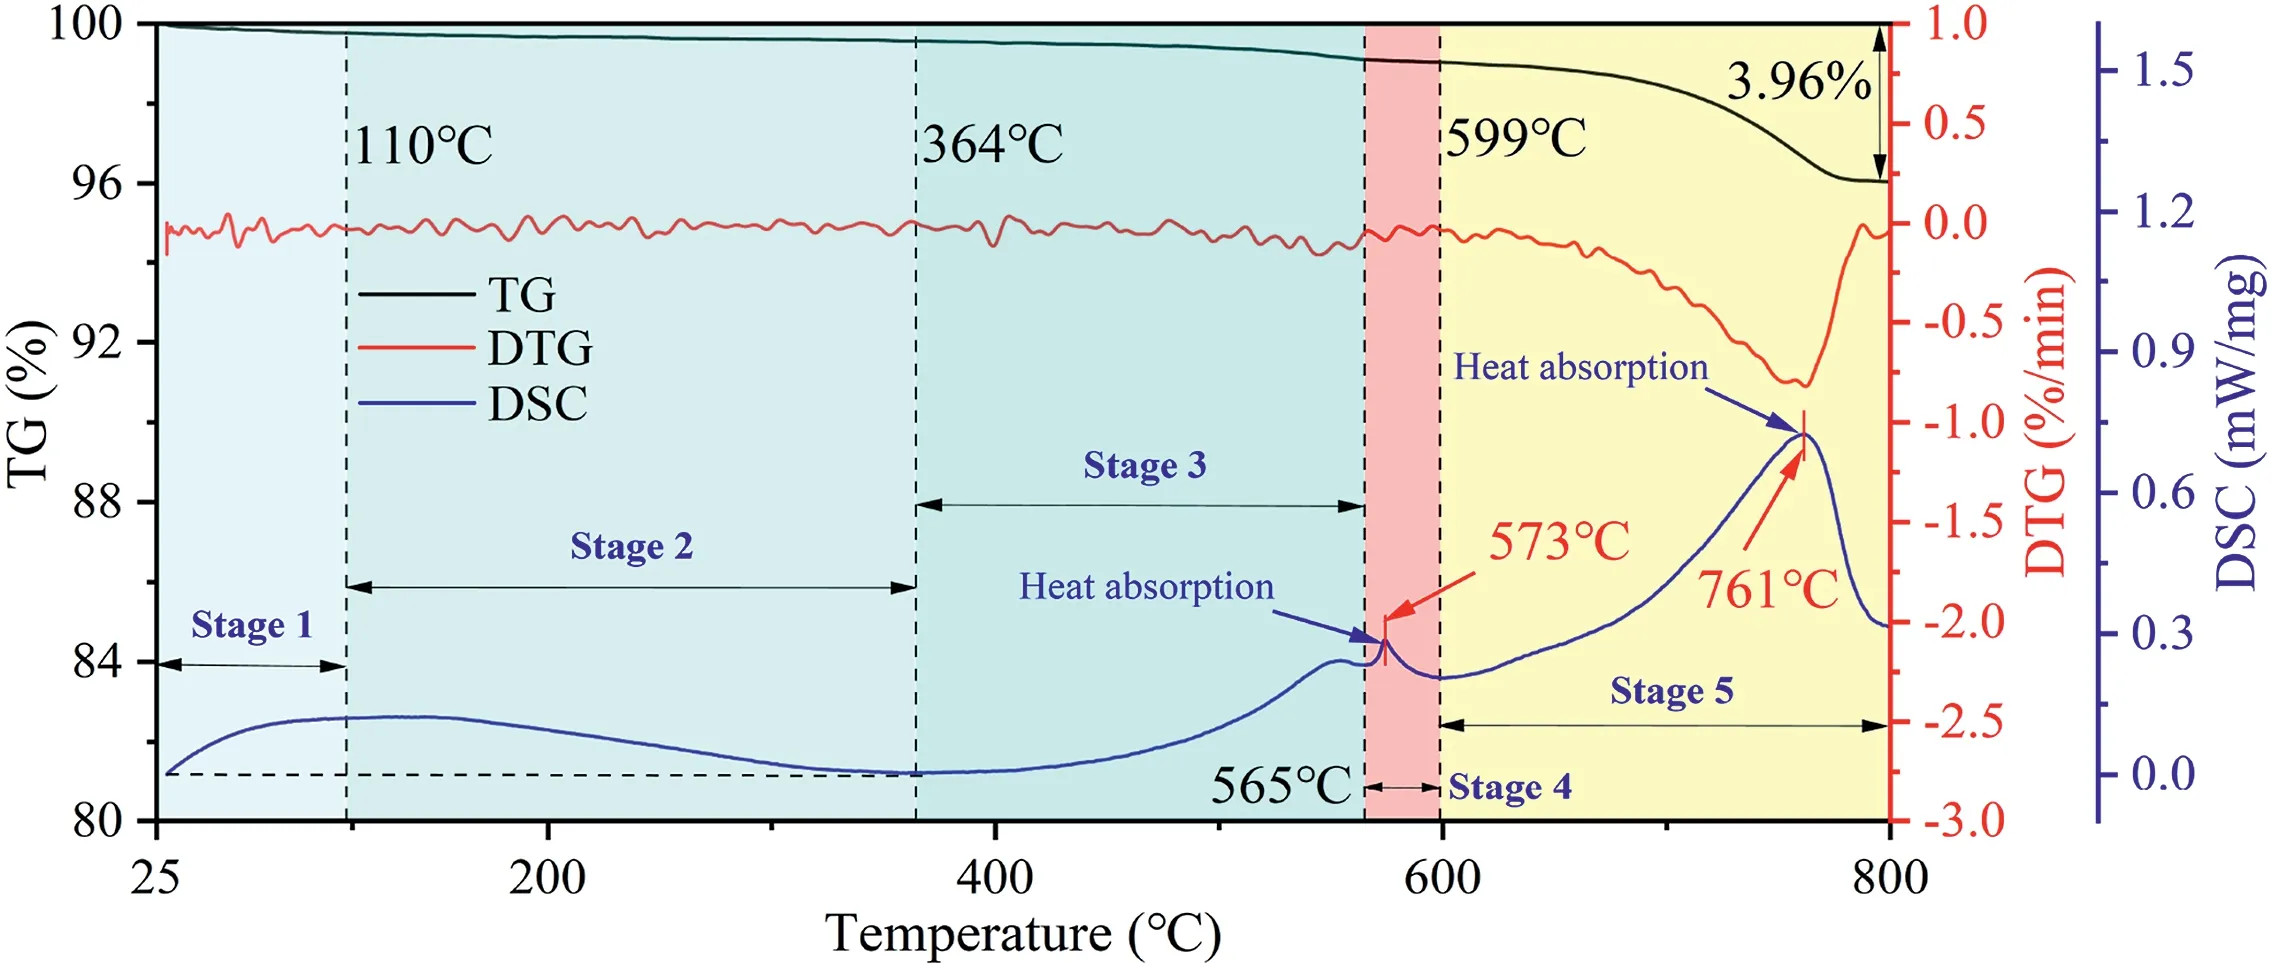
Fig.22.Thermal properties curves for the red sandstone(thermogravimmetric analysis,TG;differential thermogravimmetric analysis,DTG;differential scanning calorimeter,DSC).
The first stage of thermal properties alteration is at 25°C-110°C.The TG curve in Fig.22 shows that the specimen loses about 0.24%of its mass at this stage,the DTG curve performs relatively stable,and the DSC curve demonstrates that this stage is in an overall heat absorption state.This can be attributed to the escape of free water,weakly bound water in the rock skeleton as well as interlayer water in the chlorite,mica and feldspar.However,the dehydration behavior at this stage will also not cause damage to the rock skeleton and hence the macroscopic mechanical properties will not be weakened.
The second stage of thermal properties alteration is at 110°C-364°C.The TG curve in Fig.22 reveals that the specimen loses about 0.2% of its mass at this stage,and the DTG curve remains relatively stable.Additionally,the DSC curve shows that this stage is in a state of heat absorption as a whole,yet heat absorption is basically suspended at 364°C.Combining the morphology of the DSC curve and the TG curve in the first stage indicates that dehydration dominates this stage.This is mainly attributed to the escape of strongly bound water in the rock skeleton and interlayer in the lattice of layered silicate minerals (chlorite,mica and feldspar),some crystalline water,and structural water.Owing to the qualitative relationship between structure (polymorphism) and its formation temperature,chlorite is often employed as the geological thermometer to indicate the geothermal evolution of sedimentary basins(Hayes,1970;Cathelineau,1988;Battaglia,1999).Generally,chlorite in the sandstone grows during the burial diagenesis and is lodged in the form of pore lining,which can enhance the mechanical strength of the sandstone to a certain extent despite the sacrifice of the number and diameter of the pore throats(Lan et al.,2011;Worden et al.,2020).Moreover,differential thermal expansion causes primary defects as well as voids from chlorite dehydration to be closed by mineral extrusion and filling,but the dehydration activity is not intense enough to destroy the rock skeleton.It has also been suggested that such hardening is due to the release of competing mechanisms of thermal expansion of minerals due to the reduction of the surrounding pressure after sampling (Wong et al.,2020).On the other hand,these activities have a positive impact on repairing primary defects,thereby improving the macroscopic mechanical properties of the specimens.This is demonstrated by the increased peak stress,prolonged fatigue life,reduced strain rate,and altered crack expansion path.
The third stage of thermal properties alteration is at 364°C-565°C.The TG curve in Fig.22 shows that the specimen lost about 0.46% of its mass at this stage.The corresponding DTG curve displays a decreasing trend,while the DSC curve suggests that this stage is characterized by continued heat absorption.The pattern in the DSC curve suggests the occurrence of a combustion chemical reaction.It can be mainly attributed to the escape of crystalline and structural water from the mineral lattice and the decomposition of organic matter during combustion triggered by high temperatures.Still,these activities do not deteriorate the primary defects nor make a visible increase in secondary crack sources,and the crack growth path does not change substantially.The most representative manifestations are the decrease in peak stress and fatigue life as well as the increase in strain rate.
The fourth stage of thermal properties alteration is at 565°C-599°C.The TG and DTG curves in Fig.22 exhibit the absence of obvious alterations,while the DSC curve shows that this stage is in a state of overall heat absorption,with a typical peak of heat absorption at 573°C.It is mainly owed to the phase transition of quartz (Glover et al.,1995).What needs to be pointed out is that low-temperature quartz,i.e.α quartz,possesses good thermal stability properties by virtue of its atomic crystal structure and bond energy properties.However,Fig.23a shows that both the Si-O-Si bond angle and cell volume increase considerably with increasing temperatures before 573°C,and the acceleration is considerable at that stage.As the temperature reaches 573°C,the connection angle between the two Si-O tetrahedra in the lattice structure increases from 150°to 180°,leading to an approximate 8% increase in the volume of quartz (Sun et al.,2013;Smalley and Markovi′c,2019).
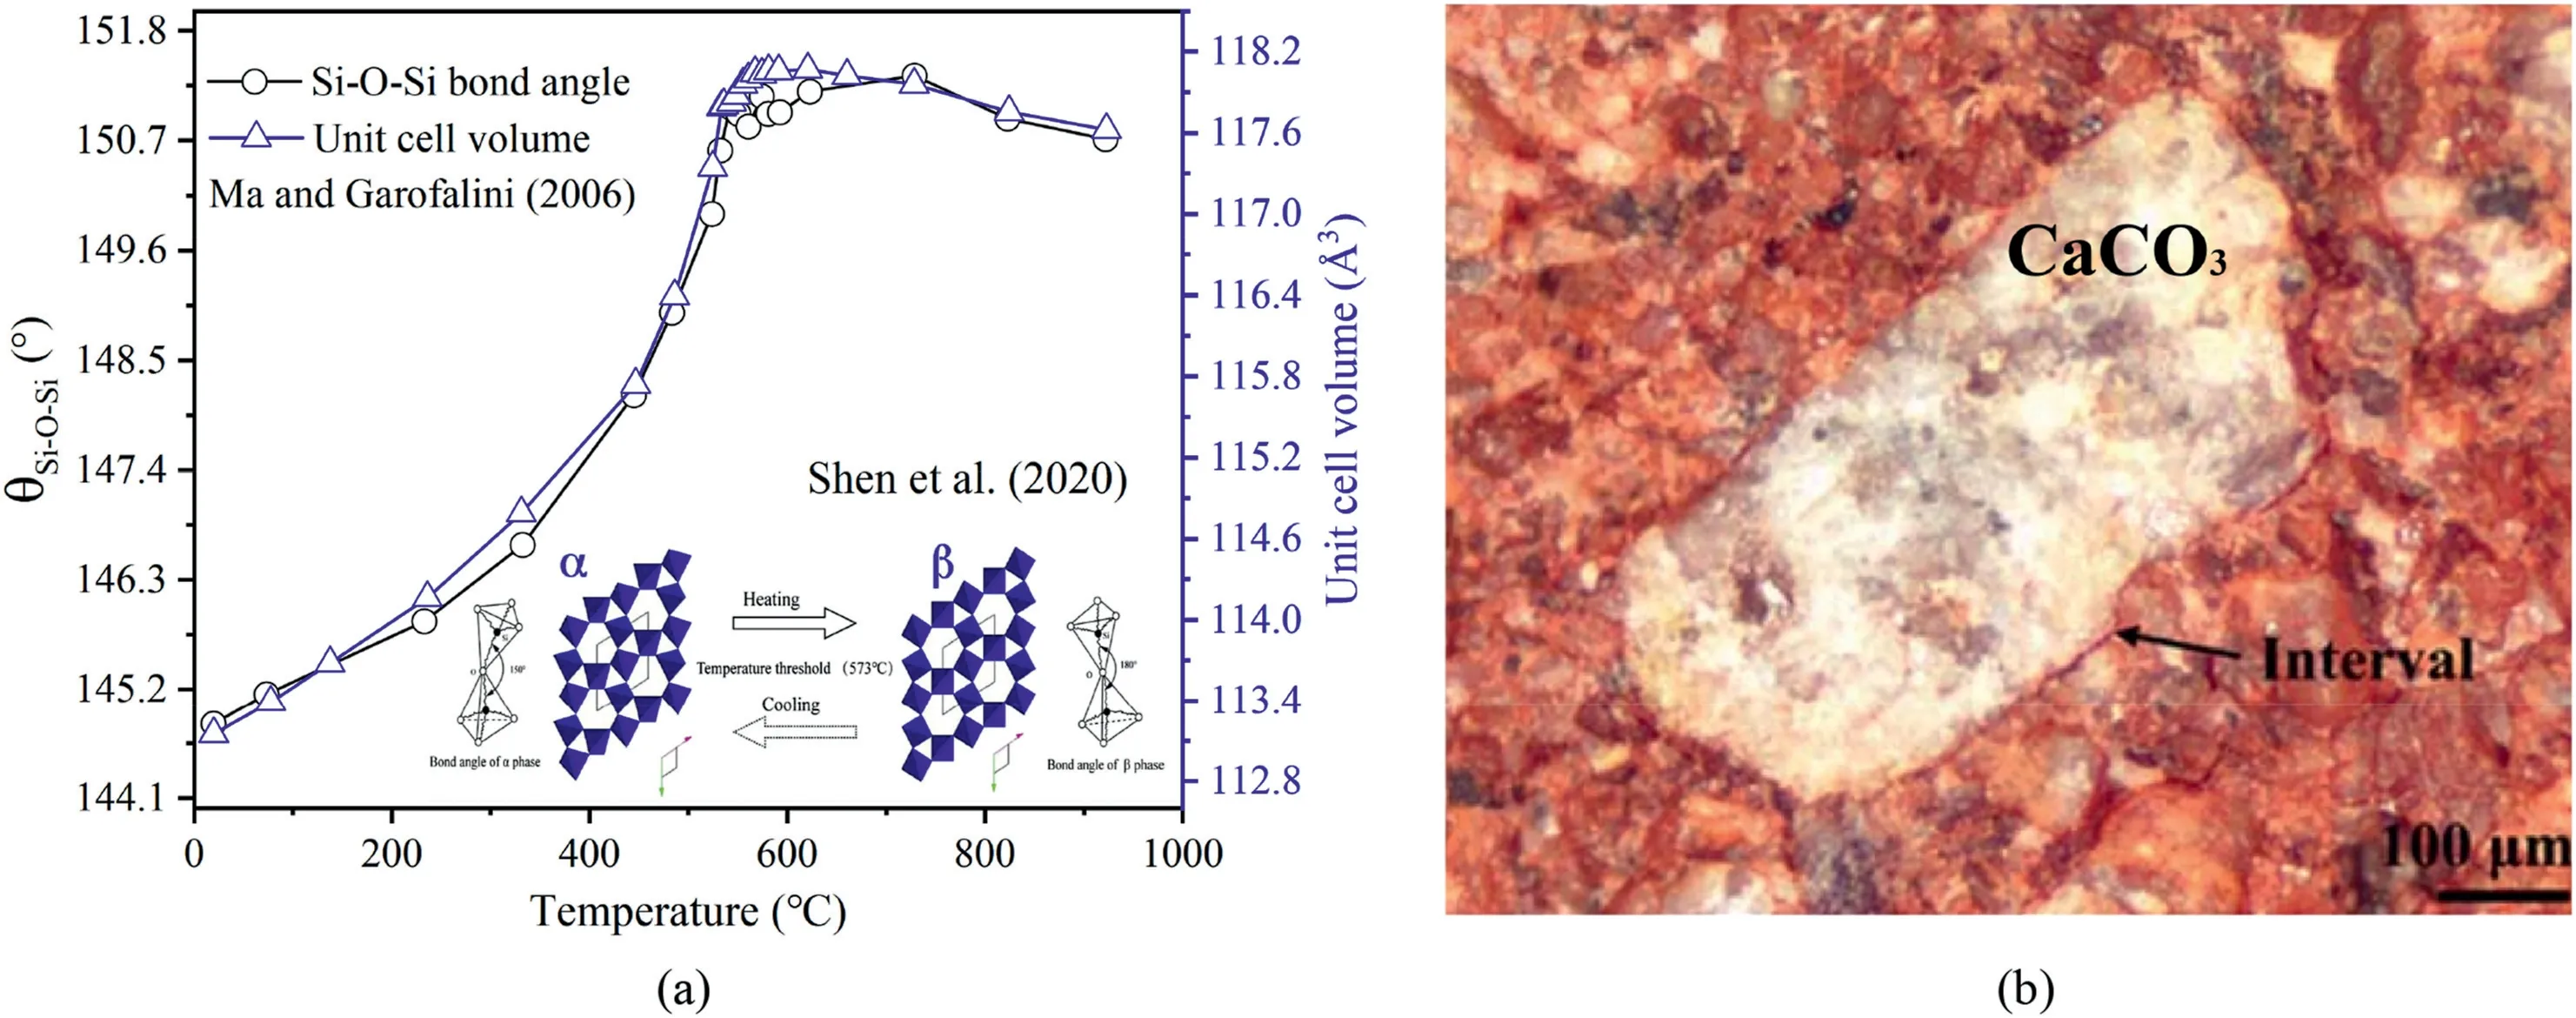
Fig.23.Microstructure of minerals under the action of high temperature: (a) Thermal expansion and evolution of Si-O-Si bond angle with temperature of quartz (Ma and Garofalini,2006;Shen et al.,2020);and (b) The interval formed at the boundary of a mineral grain (Ding et al.,2019).
Nevertheless,quartz does not show an apparent heat loss.Since quartz is the most abundant fraction in the specimen,the phase transition mechanism results in quartz possessing a high coefficient of thermal expansion,which exacerbates the occurrence of thermal cracking.It is supported by the strong microcracking peak monitored at the phase transition point(Glover et al.,1995).Additionally,it should not be ignored that the calcite crystals expand vertically and contracts horizontally at this stage due to the high temperature,which can also lead to the formation of voids between the calcite and the adjacent crystals,see Fig.23b.And at about 600°C,its expansion stress reaches the limit with the gradual emergence of tensile cracks in the grains (Xu et al.,2011).These activities provoke a further deterioration of primary defects and growth of secondary crack sources,which provide complicated potential paths for crack development.In response,the destruction of the rock skeleton is aggravated and the macroscopic mechanical properties of the material further deteriorate.Specifically,the peak stress and fatigue life show a decrease,whereas strain rate,fractal dimension,and roughness behave in the opposite way.
The fifth stage of thermal properties alteration is at 599°C-800°C.The TG curve in Fig.22 exhibits that the specimen loses about 3.06% of its mass at this stage,which accounts for 77.36% of the total mass loss.A dramatic decrease in the DTG curve indicates that the rate of mass loss per unit time is also rising sharply and reaches a peak at around 761°C,and then decreases drastically.Analogously,the DSC curve demonstrates that this stage remains in the heat absorption state in general.It is mainly due to the fact that calcite decomposes in this stage and reaches a peak decomposition rate at 761°C followed by a rapid decrease,which is substantially consistent with the findings from Karunadasa et al.(2019).The decomposition of calcium carbonate and the hydration of calcium hydroxide(as depicted in Eqs.(21) and(22)) both involve thermal activity and volume changes,which can impair the internal structure of the native skeleton and eventually reduce the bearing capacity of the rock(Ozguven and Ozcelik,2014).Moreover,Fe3O4in hematite is oxidized at high temperatures (see Eq.(23)),and the Type II H2O in feldspar (600°C) as well as hydrocarbon groups in mica(746.3°C)escape at this stage.Despite the slight impact on the total mass,these physical and chemical alterations have severely damaged the rock skeleton and significantly deteriorated the macroscopic bearing capacity.
On the other hand,elevated temperatures result in the formation of numerous secondary cracks and pores within the rock material.These features lower the energy threshold required for crack expansion during subsequent fatigue failure and offer multiple potential paths for crack propagation.Specifically,the peak stress decreases remarkably,strain rate increases considerably and fatigue cracks occur.
4.2.Thermal stress distribution and damage
It has been demonstrated theoretically and experimentally in many studies that the thermal stress produced by high temperatures can cause corrosion and damage to rocks to some extent(Yin et al.,2021b).Nevertheless,the relationships between the distribution patterns of thermal stress and fissure angles in defective rocks are not widely reported due to the limitations of available testing devices,especially for the red sandstone.The relationships between the magnitude and distribution of thermal stress in fissured red sandstone subjected to high temperatures and the macroscopic fracture patterns are analyzed in depth through the use of numerical simulations.These simulations aim to examine the distribution patterns of thermal stress in red sandstone with varying fissure angles under different levels of thermal treatment temperature.
Fig.24 demonstrates a distinct correlation between high stress areas on the surface of the specimen and temperature,as evidenced by the increased peak stress and high stress area with rising temperatures under similar fissure conditions.Furthermore,the high stress area is concentrated at the edges and tips of the prefabricated fissure,especially the tips(Bobet and Einstein,1998).In terms of the stress distribution patterns of the internal fissure,high stress area are more likely to occur at its edges as well.It is not complicated to notice that the distribution paths of the high stress area is subparallel to thex-axis,which is roughly consistent with the growth paths of fatigue cracks in the specimens during CALC impact.This indicates that the high stress areas generated by high temperatures play a positive role in the nucleation of internal microscopic cracks as well as the formation and penetration of paths.

Fig.25a shows the distribution patterns of peak thermal stress of the specimens with different fissure angles at each temperature level.It can be found that the higher the temperature,the greater the peak stress.The maximum increase rate of the peak thermal stress always occurs between 400°C-600°C,without being influenced by the fissure angle.This finding is in clear agreement with the results measured in the experiments conducted by Chen et al.(2008).It certainly proves the validity of this simulation from a certain point of view.Concerning the fissure angle,it is evident that the peak thermal stress at the fissure tips decreases with the increasing fissure angles under the same thermal treatment temperature condition.This is contrary to the distribution pattern of the failure strength and fatigue life,as shown in Fig.13.It is suggested that the greater the fissure angle,the lower the thermal stress distributed at its tips,and correspondingly the less thermal damage the rock may suffer.And its mechanical properties after thermal treatment will perform better.
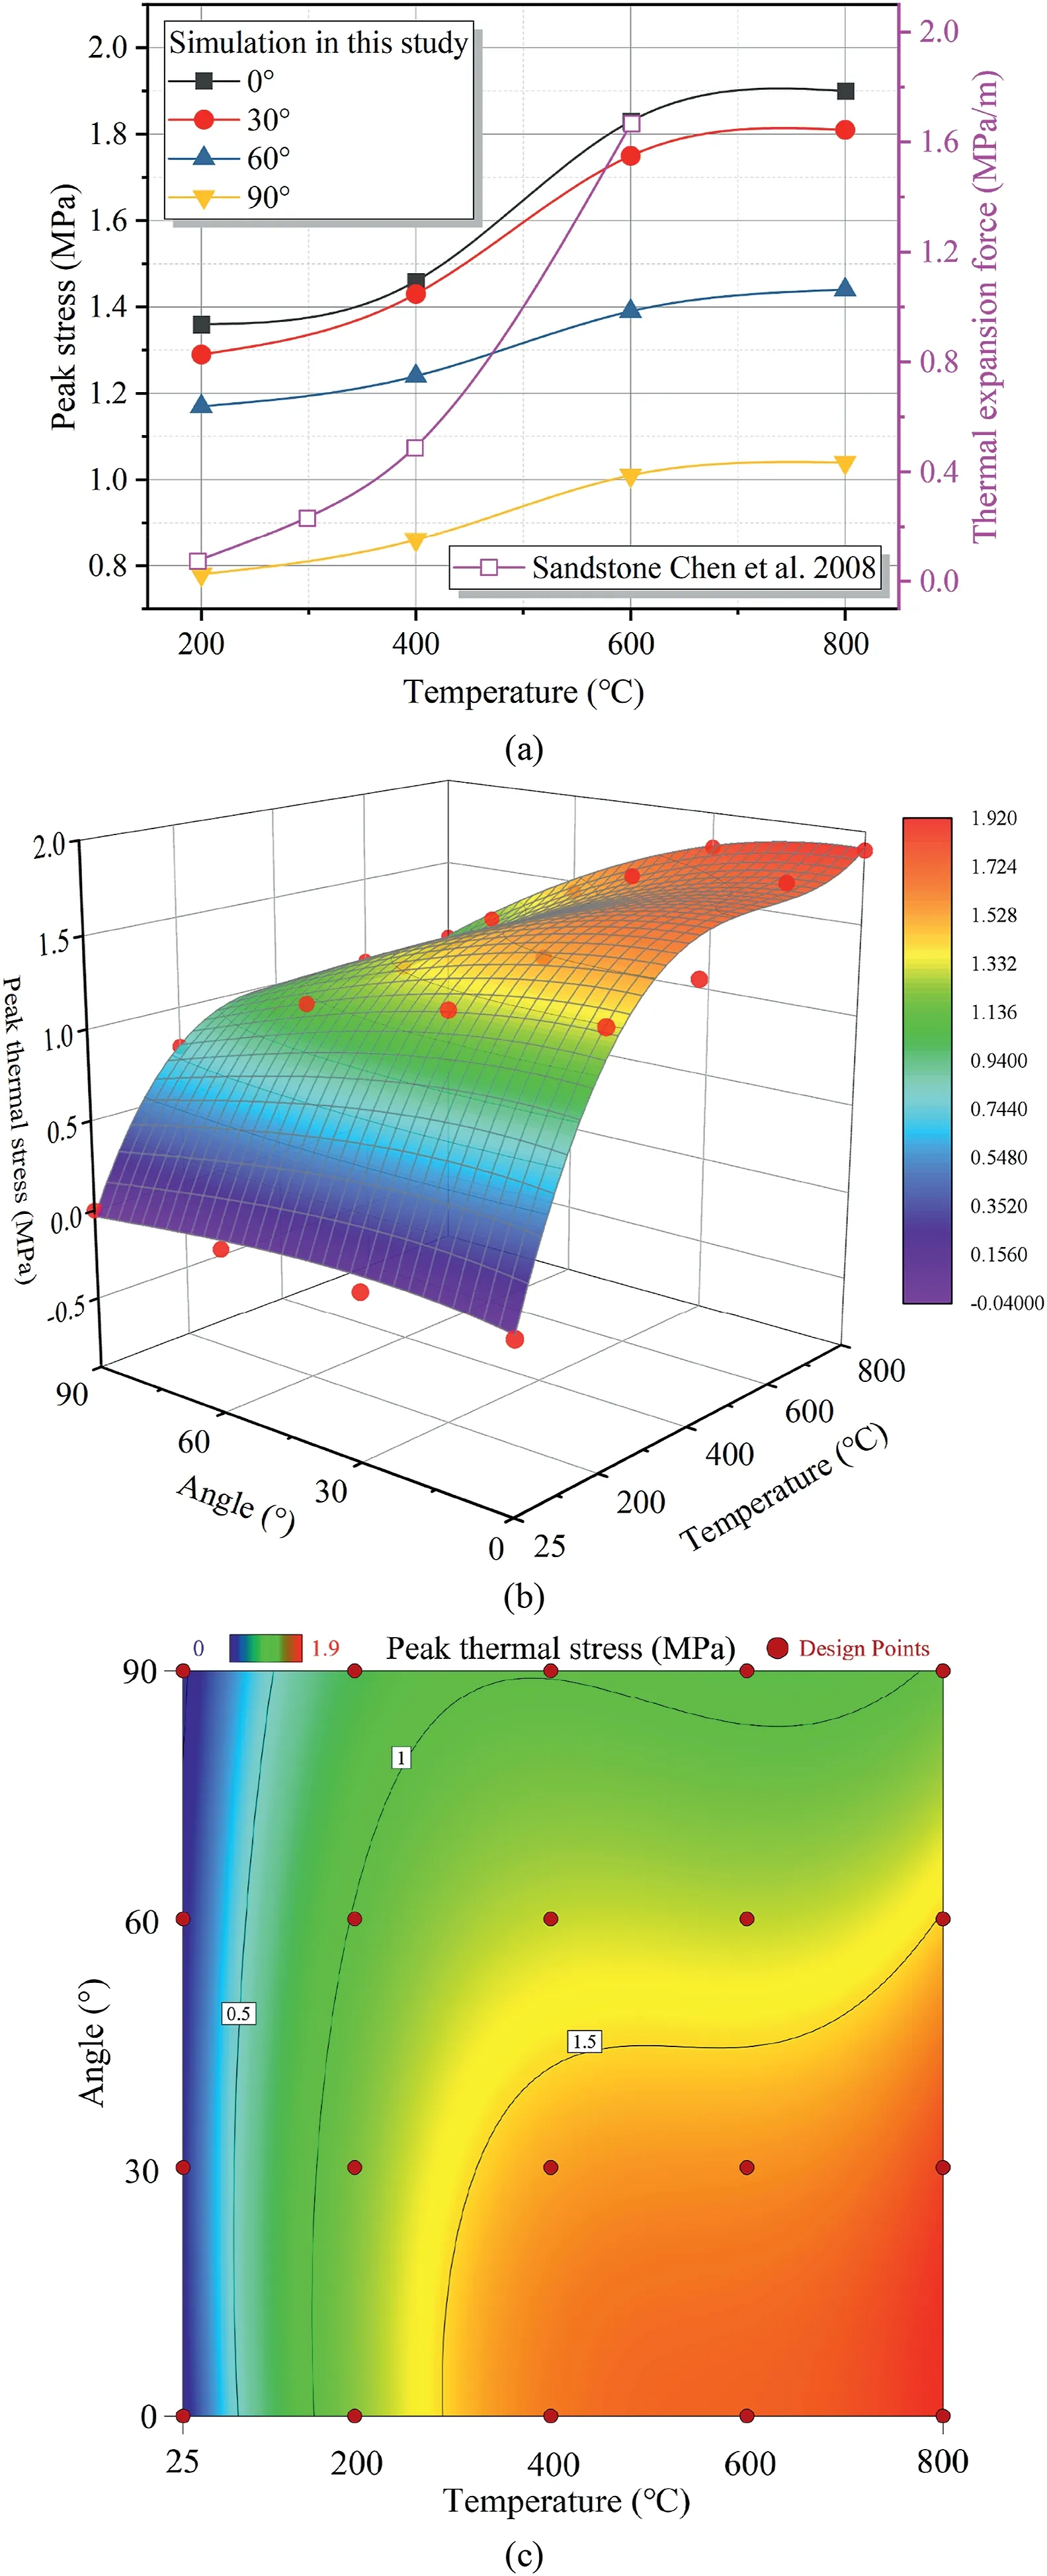
Fig.25.Peak thermal stress of the sample in the simulation as a function of the temperatures and fissure angles: (a) Comparison of the peak thermal stress in this simulation with the measured values;and (b,c) Response surface of peak thermal stress for the interaction of temperatures and fissure angles.
Fig.25b and c illustrates the response surface and contour of peak thermal stress (PT) in the simulation affected by the temperatures and fissure angles.As can be seen,the dominant area of the response surface forPTis concentrated in the range of temperatures greater than 400°C and fissure angles less than 60°.Additionally,the best-fit regression model forPTbased on the relationship between the response variable (PT) and the interaction effects of the independent variables (temperatures and fissure angles) can be described as follows:
The comprehensive evaluation ofR2,andApdemonstrates the validity of the regression model.
On the other hand,it has been documented in numerous reports that thermal damage negatively affects the fracture toughness of rocks,which is also a critical parameter in determining the ability of a material to resist macroscopic crack destabilization extension(Al-Shayea et al.,2000;Ayatollahi and Aliha,2008;Hua et al.,2015).As can be noted from Fig.26a and b,the temperature has a degradation effect on the dynamic and static fracture toughness of the sandstone,which is especially significant when the thermal treatment temperature exceeds 200°C.The link between dynamic and static fracture toughness of sandstone and thermal damage can be established using the constitutive model described in the following equation (Yao et al.,2016):
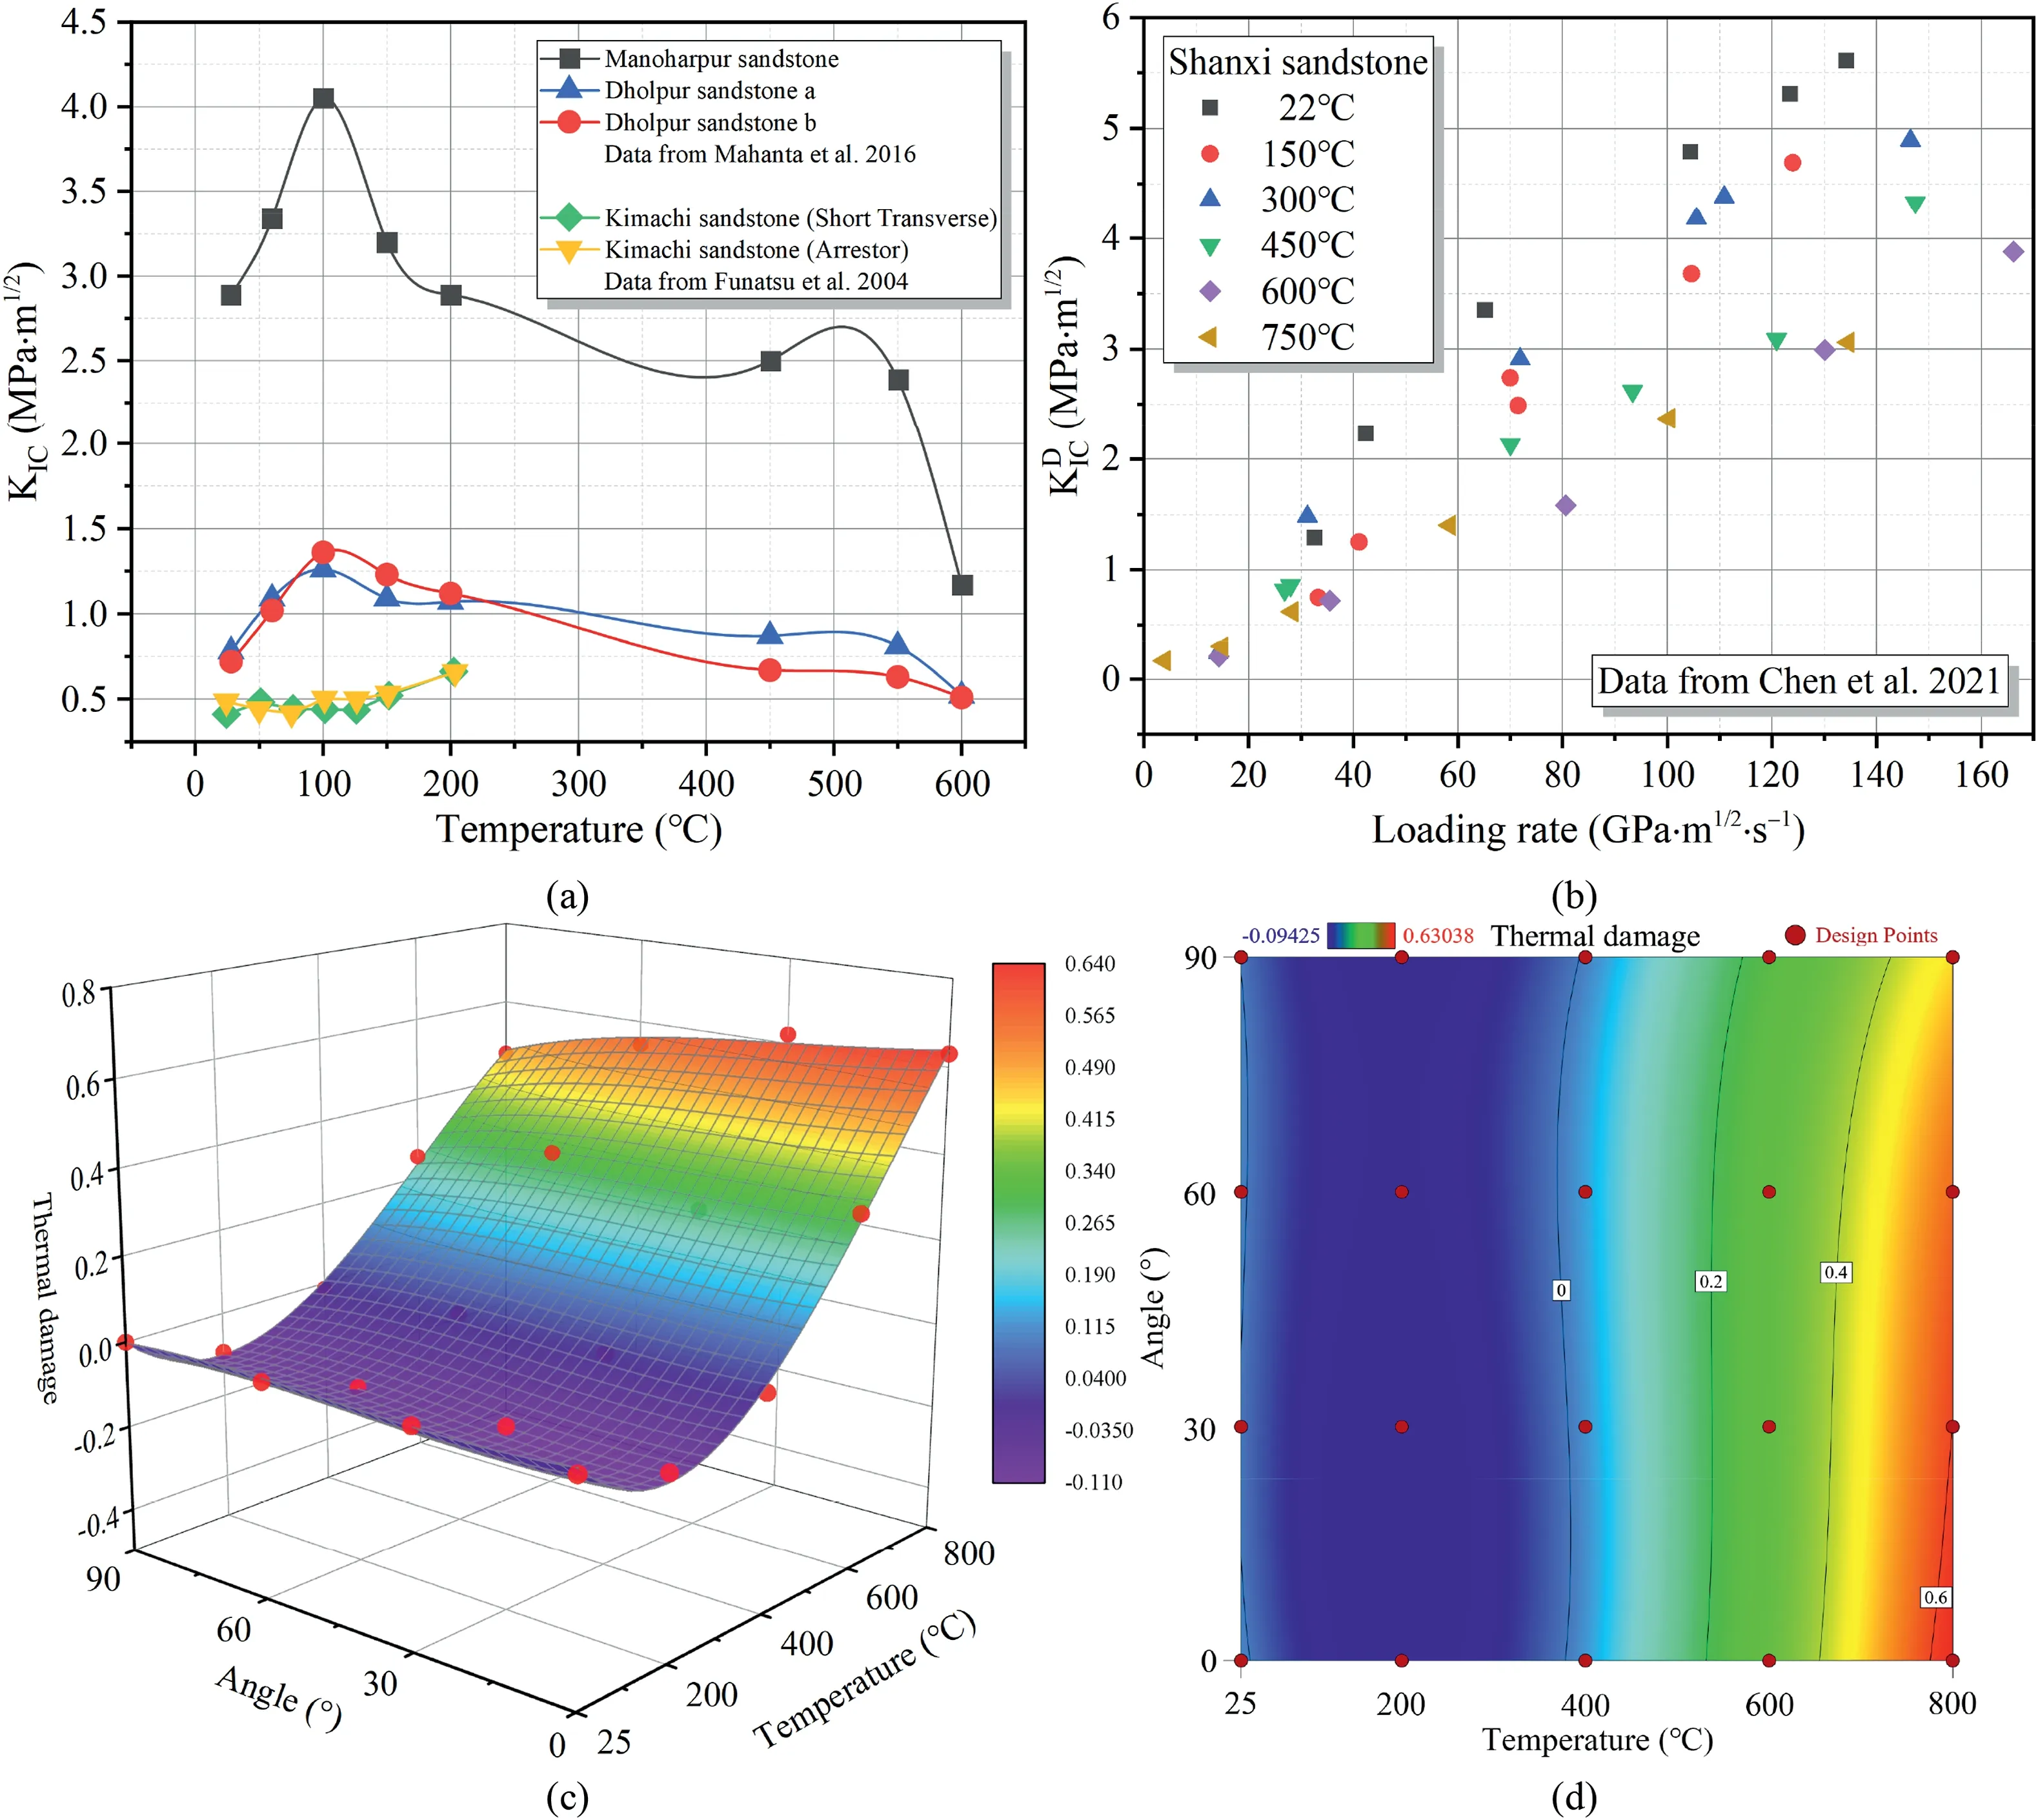
Fig.26.Damage characteristics of sandstone with elevated temperature: (a) Static fracture toughness (),(b) Dynamic fracture toughness (),and (c,d) Response surface of thermal damage for the interaction of temperatures and fissure angles.
Fig.26c and d shows the response surface and contour of thermal damage () of the samples affected by the temperatures and fissure angles.As can be seen that theexhibits a marked sensitivity to increases in the temperatures,especially after 400°C.Furthermore,it can be found that the effect patterns of the fissure angle onat the same temperature level are in good agreement with that of thePTin the simulation,providing evidence for the validity of the simulation.Besides,the association betweenandin sandstone implies that the driving energy required for crack expansion is relatively lower in regions whereis concentrated.Consequently,it is also more prone to the propagation of cracks and weaker mechanical properties under CALC conditions.The best-fit regression model for,which is the response variable,and its relationship with the independent variables (temperatures and fissure angles) is presented as follows:
The comprehensive evaluation ofR2,andApdemonstrates the validity of the regression model.
4.3.1D stress wave
When the loading condition is transformed into a 1D elastic stress wave,some mechanical response properties of the material under the quasi-static loading conditions are substantially altered due to the inertial effects and differences in material properties.Hence,we try to discuss and interpret the mechanical behaviors under CALC impact from the perspective of the transmission mechanism of stress wave in the defective specimens.For the sake of understanding and discussion,the propagation process of the 1D stress wave in the specimen at stress equilibrium is decomposed,as depicted in Fig.27.
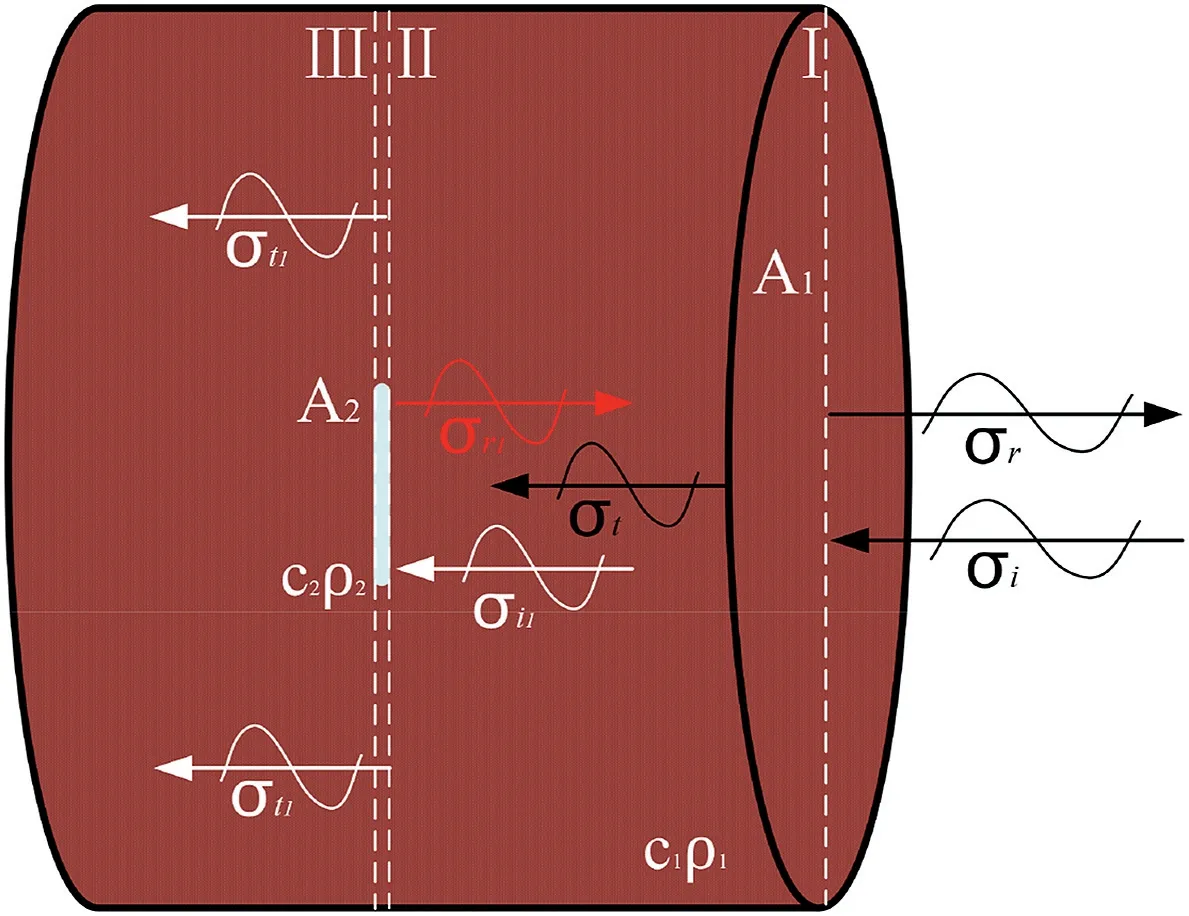
Fig.27.Propagation states of 1D stress waves at interfaces I,II and III in stress equilibrium. A1,σi,σr and σt are the area,incident stress,reflected stress and transmitted stress at interface I,respectively; A2,σi1,σr1 and σt1 are the area,incident stress,reflected stress and transmitted stress at interface II,respectively; c1ρ1 and c2ρ2 are the wave impedance of air and red sandstone,respectively,which are denoted by the product of wave velocity and density of the material.
The stress wave activated from the bar will undergo the first transmission and reflection while passing through the interface I.To facilitate the analysis of the transmission mechanism of stress wave at interface I,it is assumed that the medium at interface I remains in contact,and that internal forces on both sides are equal,ensuring the continuity of mass points.There,the following equations can be derived by combining the momentum conservation conditions of the wavefront surface(Schoenberg,1980):
wheremis the ratio of the impedance of the incident bar to that of the specimen;and φ and Ψ are the reflection and transmission coefficients,respectively.The relationships between the transmission and reflection coefficients of the stress wave at interface I and the thermal treatment temperatures are given in Fig.28a and b.The fitting relationships are presented in the following equations:
whereR2reflects the validity of the fitting results.It can be seen from Fig.28a and b that high temperatures (>200°C) can induce intensification of the rock reflection coefficient,which is most pronounced at 400°C-800°C.Simultaneously,with respect to the transmission coefficient,which can be used to reflect the intensity of the transmitted stress in the rock,it shows a completely opposite trend.From the viewpoint of wave impedance,high temperatures indirectly affect the intensity of transmitted wave and thus control the macroscopic mechanical properties of the specimens.In fact,the effect of high temperatures on the wave impedance of rocks is also conspicuous.The effect of high temperatures on the wave velocity and density of specimens has been found to be distinctly degraded,which is introduced in detail in Section 3.1.
Fig.28c-f displays the response surface and contour of φ and Ψ of the specimens influenced by the temperatures and fissure angles.As can be observed from the figure,the response surface of φ is opposite to that of Ψ.In addition,the best-fit regression model for φ and Ψ from the relationships between the response variables(φ and Ψ) and the interaction effects of the independent variables(temperatures and fissure angles) can be characterized as follows:
The comprehensive evaluation ofR2,andApdemonstrates the validity of the regression models.
To discuss the effect mechanism of the fissure on the dynamic properties of the specimens,the transmission mode of the stress wave at interface II is focused.In contrast to the intact specimen,the transmitted wave is partly transmitted and reflected as an incident wave when passing through interface II (the interface between air and rock),and the other part continues to pass inside the specimen as a transmitted wave.Based on the theory of 1D stress wave propagation,i.e.no shear wave is generated at perpendicular incidence.To facilitate the discussion,the stress wave incident to interface II is decomposed into its components perpendicular to the interface,as illustrated in Fig.29a.What is different from electromagnetic waves is that the transmission of stress wave depends on the medium,and the efficiency of this propagation is strictly related to the intrinsic properties of the medium,particularly the wave impedance.Similarly,it is assumed that the medium at interface II remains in contact,and that the internal forces on both sides are equal,with the continuity of mass points maintained.On this basis,the formulae for transmitted and reflected stresses can be modified as (Daehnke and Rossmanith,1997):
where σr1and σt1are the reflected and transmitted stresses at interface II,respectively;A1andA2are the areas of interfaces I and II,respectively;andc1ρ1andc2ρ2denote the wave impedance of the red sandstone and medium,respectively,which are determined by the density and wave velocity of the material;kr1andkt1are introduced as reflection and transmission factors to facilitate the comparison of the incident and reflected stresses,and the equations are given as follows:
Since the medium in this experiment is air,as shown in Fig.29b,it is difficult to support the effective propagation of stress waves without a medium or air.Therefore,it can be regarded that σt1arrives at interface II without transmission,i.e.total reflection,which is attributed to the extremely low air mechanical wave impedance.In this case,the equations can be written as
At this point,it can be found that at a constant σt,i.e.the reflected stress at interface II is completely determined by the fissure angle at the same thermal treatment temperature level.It is not difficult to observe that the incident compression wave is reflected as a tensile wave.The tensile wave is determined bykr1and exhibits a clear angle effect,i.e.the greater the angle the smaller the amplitude of the tensile wave.In general,polycrystalline materials with a certain strength tend to withstand quite strong compressive stress waves.However,it is not able to withstand the same intensity of tensile stress waves.Therefore,when the intensity of the tensile wave is greater,the material is also more prone to damage.The response of the tensile wave resulting from the fissure angles is probably the underlying cause of the peak stress sensitivity to the fissure angles in CALC impact testing.Also,the typical fatigue cracks are quite easily developed on the surface of the specimens(≥600°C) during the CALC impact.This occurs when the absolute value of the reflection factor is small,and the tensile wave serves multiple times(α=30°and 60°).The direction of extension of the fatigue cracks is subperpendicular to the tensile stress,as shown in Fig.30.It is most likely due to the fact that the fracture toughness after deterioration by high temperatures is not sufficient to resist the erosion of the reflected stress,and hence fatigue cracks are expanded.Under the effect of this mechanism,the specimens with small fissure angles experience higher tensile stress and are more susceptible to failure with crack expansion.As a result,the macroscopic mechanical properties,including peak stress and fatigue life,are more delicate than those of specimens with greater fissure angles.
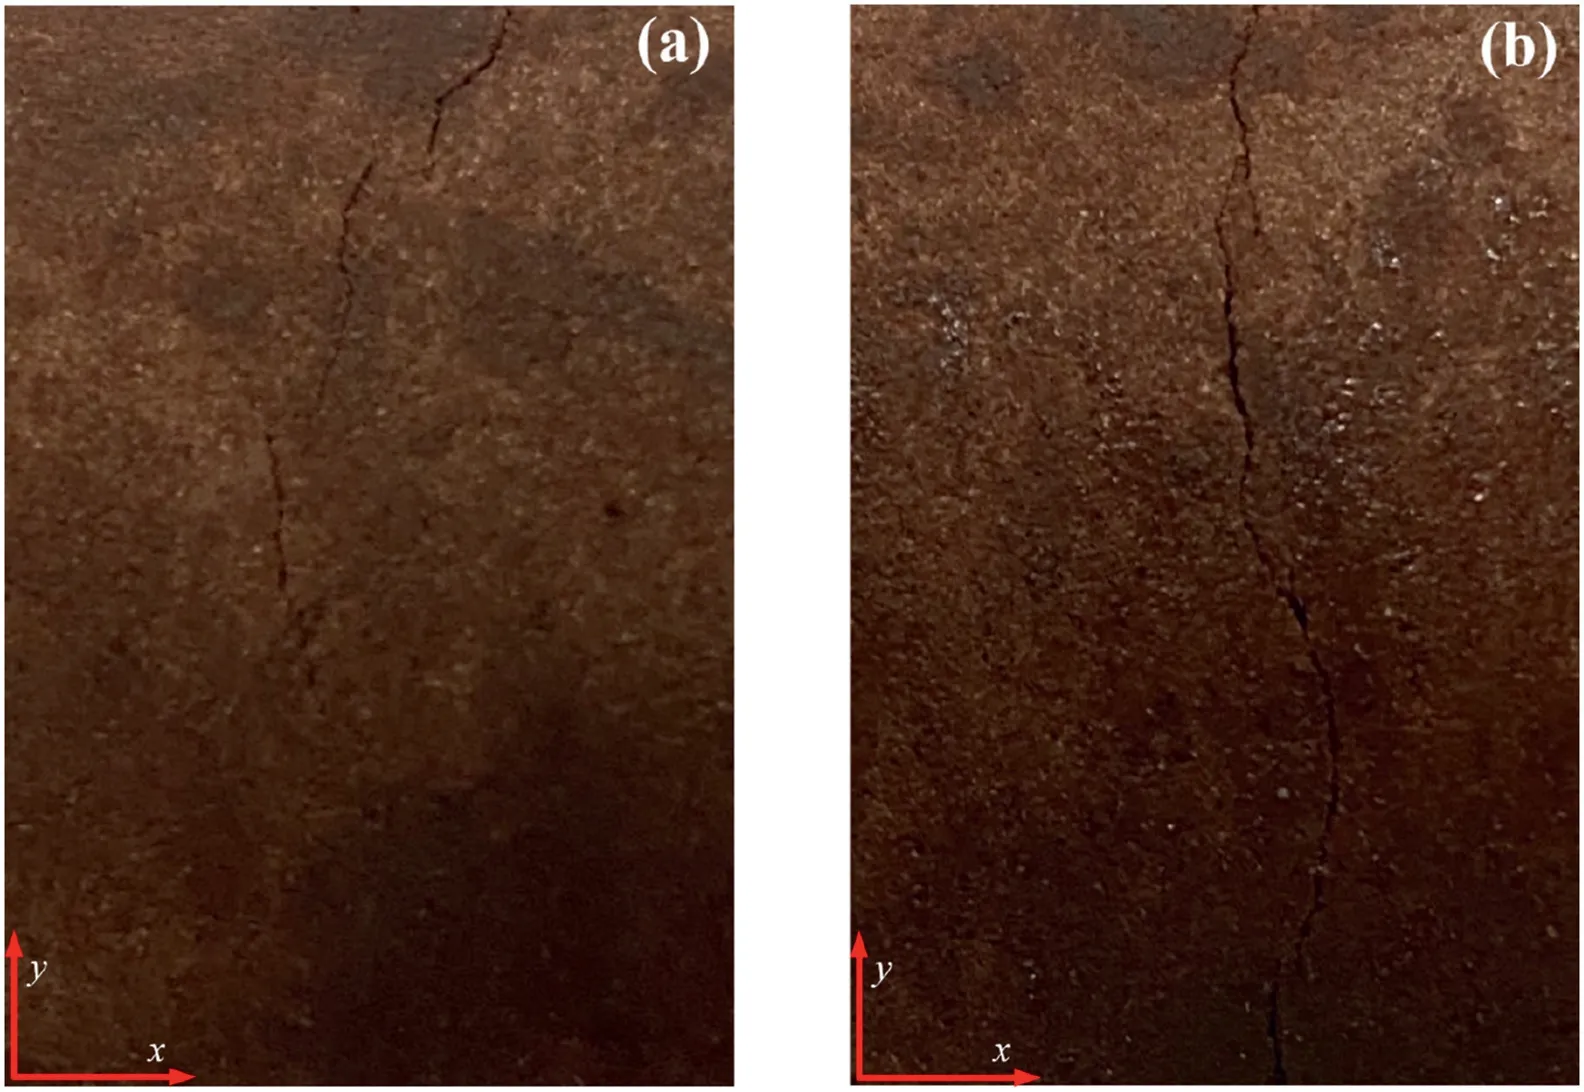
Fig.30.Typical fatigue cracks in the specimen during CALC impact,where the x-axis denotes the direction of the impact load.
4.4.Internal structure
Likewise,each CALC impact is accompanied by nucleation,extension and compression of microscopic cracks as well as structural alterations within the rock.The rock can withstand multiple impacts at a larger fissure angle,i.e.small tensile stress.In the early stages during the CALC impact,the native defects are compacted in porous sandstone,and this effect becomes more pronounced,especially after high-temperature treatment,which corresponds to stage 2 in Fig.31.Accordingly,the skeleton denseness after compaction and wave impedance of the sample are enhanced at this stage.Besides,the peak stress increases,and the strain rate decreases compared to the previous impact,i.e.peak stress intensification and strain rate softening.It is not uncommon for porous rock-like materials,such as concrete and sandstone,to experience phenomena resulting from stress corrosion caused by thermal or chemical treatment.This leads to an increase in the number and volume of microcracks and pores,exacerbating the effects in the early stages of CALC impact (Yang et al.,2020;Xue et al.,2022).

Fig.31.Schematic diagrams of the internal structural changes of the specimen during CALC impact.
On the other hand,although similar peak stress intensification is infrequently found in non-porous rock-like materials during conventional mechanical tests,the hardening of the elastic modulus can still be observed during impact (Wang et al.,2019;Si et al.,2020).Also,the study conducted by Vaneghi et al.(2020) demonstrates that low-frequency cyclic loading has a stronger damage effect on crystalline rocks compared to rocks with granular structures,and no peak stress intensification can be observed.With the increase in the impact number,the continuous disturbance of tensile stress is accompanied by massive microcrack nucleation,extension,and penetration,and then these phenomena disappear.As depicted in Stage 3 from Fig.31,the peak stress and strain rate decrease and increase sharply,respectively,and damage accumulates rapidly with massive microcracks propagating drastically until the rock fails.The way a specimen fractures under single impact failure conditions is dominated by transgranular fracture.However,in the CALC impact fatigue mode,intergranular fracture has more opportunities to occur,especially at longer fatigue lives where the path of microcracks becomes more complex.As a consequence,when the thermal treatment temperature is elevated to 800°C,the increase in the low fracture toughness area and crack expansion rate within the red sandstone radicalizes the evolution of this mechanism.
5.Conclusions
This paper documents the detailed laboratory results of dynamic response and fracture characteristics of red sandstone containing a fissure at different angles after thermal treatment in CALC impact.The effects of temperature and fissure angle on the mechanical parameters and crack extension behaviors of red sandstone were thoroughly investigated and discussed in terms of thermal properties,thermal damage,stress wave propagation and internal structure.The main findings are summarized as follows:
(1) Optimum multiple regression models indicate temperatures and fissure angles have substantial effects with potential predictability on the behaviors of red sandstone in response to CALC impact.
(2) Failure strength and fatigue life deteriorate parabolically with increasing temperatures and strengthen with increasing fissure angles,while strain rate behaves oppositely to failure strength and fatigue life.
(3) The peak stress during CALC impact decreases with increasing temperatures and increases with increasing fissure angles.Peak stress intensification and strain rate softening occur in the early stage,which is more pronounced at α=60°and 90°,and at temperatures ranging from 25°C to 600°C.
(4) Stress corrosion induced by temperature affects the microscopic crack expansion and the characteristics of the crack tips,which weaken the connectivity of grain boundaries and cause the tensile fracture,brittle fracture,and intergranular fracture dominating the failure.
(5) The elevated density of fatigue and thermal cracks in the grain causes the formation of the compressor-crushed zone,resulting in the growth of macroscopic cracks nearly perpendicular to the stress wave direction.Additionally,temperature exerts a positive effect on the ASM and COR of the GLCM in SEM images,yet a negative effect on the ENTand CON.
(6) The morphology and number of pores and microcracks,as well as the mechanical properties and fracture characteristics,are controlled by various thermal properties such as dehydration,thermal expansion,dehydrocarbon,plasticization,phase transition,thermal cracks,and thermal decomposition activities.
(7) Numerical simulations demonstrate that the high-stress areas induced by high temperatures in the specimens increase with increasing temperatures and the maximum thermal stress decreases with increasing fissure angles.Further,the high-stress areas have a positive effect on the nucleation of internal microscopic cracks as well as the formation and connectivity of paths.
(8) Besides the porous structures which can absorb low impact energy,the temperatures and fissure angles also influence the thermal damage which determines the wave impedance and tensile stress located at the fissure surface.They together govern a series of mechanical behaviors including stress intensification and strain softening of the specimen under CALC impact.
Data availability statement
The datasets generated during and/or analyzed during the current study are available from the corresponding author on reasonable request.
Declaration of competing interest
The authors declare that they have no known competing financial interests or personal relationships that could have appeared to influence the work reported in this paper
Acknowledgments
This work was financially supported by the National Natural Science Foundation of China (Grant No.41972283),the Fundamental Research Funds for the Central Universities of Central South University (Grant No.2021zzts0287),and the China Scholarship Council (Grant No.202206370109).We also thank anonymous reviewers for their valuable comments and suggestions to improve this manuscript.
 Journal of Rock Mechanics and Geotechnical Engineering2024年2期
- Journal of Rock Mechanics and Geotechnical Engineering的其它文章
- Determination of uncertainties of geomechanical parameters of metamorphic rocks using petrographic analyses
- Evaluation of excavation damaged zones (EDZs) in Horonobe Underground Research Laboratory (URL)
- On the calibration of a shear stress criterion for rock joints to represent the full stress-strain profile
- Effect of dynamic loading orientation on fracture properties of surrounding rocks in twin tunnels
- Experimental study on the influences of cutter geometry and material on scraper wear during shield TBM tunnelling in abrasive sandy ground
- Effect of fracture fluid flowback on shale microfractures using CT scanning