
Hydrocarbon Composition of Different VGO Feedstocks and Its Correlation with FCC Product Distribution
2013-07-25 10:07SongHaitaoJiaoGuofengZhuXinyiZhouXiangZhuYuxiaDaZhijian
中国炼油与石油化工 2013年1期
Song Haitao; Jiao Guofeng; Zhu Xinyi; Zhou Xiang; Zhu Yuxia; Da Zhijian
(Research Institute of Petroleum Processing, SINOPEC, Beijing 100083)
Hydrocarbon Composition of Different VGO Feedstocks and Its Correlation with FCC Product Distribution
Song Haitao; Jiao Guofeng; Zhu Xinyi; Zhou Xiang; Zhu Yuxia; Da Zhijian
(Research Institute of Petroleum Processing, SINOPEC, Beijing 100083)
Three different types of VGO were selected and cut into various distillates by true boiling-point distillation (TBD), and the distillates were further separated into different components (saturates, aromatics and resins) via solid phase extraction (SPE). The hydrocarbon components in saturates and aromatics were characterized on the quasi-molecular level by GC/ MS and GC/TOF MS. Cracking reactions of VGO, their distillates, and hydrocarbon components (saturates and aromatics) were performed on an ACE (model AP) unit. Nine correlation parameters (mainly based on the previous assumption of basic structure units, BSU) which could better reflect the structures and compositions of hydrocarbons were put forward based on the quasi-molecular level analysis data, and correlated with FCC product distribution by multi-regression method. A series of correlation formulas were obtained. The formulas were further verified by comparing experimental and calculated FCC yields emanated from two other VGO feedstocks.
fluid catalytic cracking; VGO; product distribution; hydrocarbon composition; correlation
1 Introduction
Fluid catalytic cracking (FCC) is one of the most important processes in refineries aiming at converting heavy oils into valuable light products like LPG, gasoline and LCO[1-2]. Feedstock composition, catalyst properties and operating conditions (reaction temperature, catalyst/oil ratio, etc.) each could influence the FCC product distribution, among which the feedstock composition plays a fundamental role[3].
In the past decades, considerable studies have been conducted in order to correlate feedstock properties (such as basic properties, hydrocarbon group composition, structural parameters, and K factor) with FCC performance[4-5]. Nowadays great progresses have been achieved in heavy oil analysis methods and computing techniques, but how to build a FCC reaction model on molecular level is still a huge challenge[4].
In our previous work[6], quasi-molecular level analysis results of VGO hydrocarbon compositions had been obtained by a series of analysis procedures, such as GC/ MS, and GC/TOF characterization methods. Based on the conversion regulations observed in cracking reactions of model molecules, some assumptions were made to simplify the complex hydrocarbon compositions of VGO feedstocks into basic structure units (BSU), which could reflect the structure and composition characteristics of hydrocarbon molecules and follow the conversion regulations of model molecules. Then the hydrocarbon group compositions of VGO feedstocks were correlated with the FCC product distributions on the basis of the conversion regulations of BSU. However, there were still several issues not resolved satisfactorily, including: (1) the interactions between saturates and aromatic hydrocarbons were ignored (despite their existence in commercial feedstocks), as cracking reactions of saturates and aromatics were performed separately and the product yields were added up linearly; (2) the conversion regulations obtained from limited model molecules were not enough, therefore many assumptions were made which could influence the depth and accuracy of calculation results; and (3) the sulfur containing aromatics (not to mention other heterocyclic aromatics) and resins were not considered owing to insufficient basic data.
In this work, the correlation parameters were put forwardin compliance with the quasi-molecular level analysis data (mainly based on the assumption of BSU), and correlated with the FCC product distribution by mathematical regression by which the difficulties in seeking conversion regulations could be avoided; furthermore, as the integral VGO feedstocks were also taken into account, and resins were assumed as a separate parameter (with sulfur containing aromatics being still combined into aromatics approximately), the correlation model would be more brief and of practical value.
2 Experimental
2.1 Separation of VGO
Three VGO samples included the paraffinic-base Daqing VGO (DQVGO), the intermediate-base Arabian VGO (SZVGO) and the hydrotreated SZVGO (HTVGO).
VGO samples were firstly divided into three distillate fractions through true boiling-point distillation (TBD) at 410℃ and 460℃, respectively. The distillates were labeled as “the abbreviated name of VGO–No. of distillates”, for example, the first distillates of DQVGO (350—410℃) was named DQ-1. Yields of the distillates are listed in Table 1.
Then the distillates were further separated into various hydrocarbon groups, i.e.: saturates (S), aromatics (A) and resins (R), via solid phase extraction (SPE) technology. Yields of the hydrocarbon group components are listed in Table 2. Taking the saturates separated from DQ-1 as an example, the component was named DQ-1S. The separation procedures and methods have been described in reference [6] in detail.
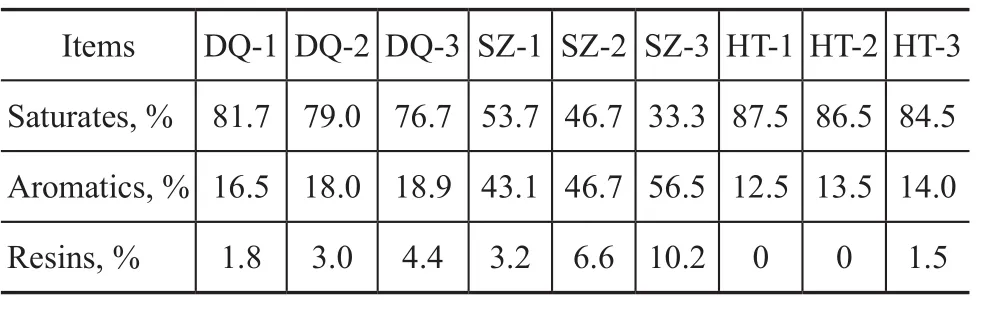
Table 2 SPE separation results
The resins were not collected for cracking experiments, because their content in VGO was quite low. The feedstocks that were actually used to perform FCC reactions included 3 VGO feedstocks, 9 distillates and 18 hydrocarbon group components (saturates and aromatics).
2.2 Characterization of hydrocarbon structure and composition
Main hydrocarbon structures and compositions of the separated fractions of saturates and aromatics were firstly analyzed by GC/MS; and the carbon number distribution of hydrocarbons was further characterized by GC/TOF technology, by means of which the hydrocarbon group compositions on the quasi-molecular level could be obtained. The specific descriptions of GC/MS and GC/TOF methods have been mentioned in the literature [7-8].
2.3 Catalytic cracking experiments
Catalytic cracking reactions of a total of 30 feedstocks were performed on an ACE (Model AP) unit with a USY zeolite catalyst. The cracking conditions covered: a reaction temperature of 510 ℃, a WHSV of 16 h-1, and a catalyst/oil ratio of 4. The coked catalysts were stripped by N2at the end of a cracking cycle. The composition of gaseous products and distillation fractions of liquid products were separately analyzed by different GC apparatus. The coke yield was calculated by IR measurement during in-situ regeneration.
The conversion was defined as: (1-the yield of liquid fraction boiling above 221 ℃) ×100%.
3 Results and Discussion
3.1 Hydrocarbon structure and composition
GC/MS and GC/TOF analysis results have been referred to in detail previously[6]. As an example, the hydrocarbon group compositions of DQ-1S and DQ-1A are also shown in Tables 3 and 4.
It can be seen from data listed in Tables 3 and 4 that the GC/TOF results are more detailed than those of GC/ MS, from which the content of each type of hydrocarbon groups with a certain carbon number could be ascertained. Furthermore, the carbon number of side chains could be easily obtained by “subtracting the cyclic carbon atom number from the total number”.
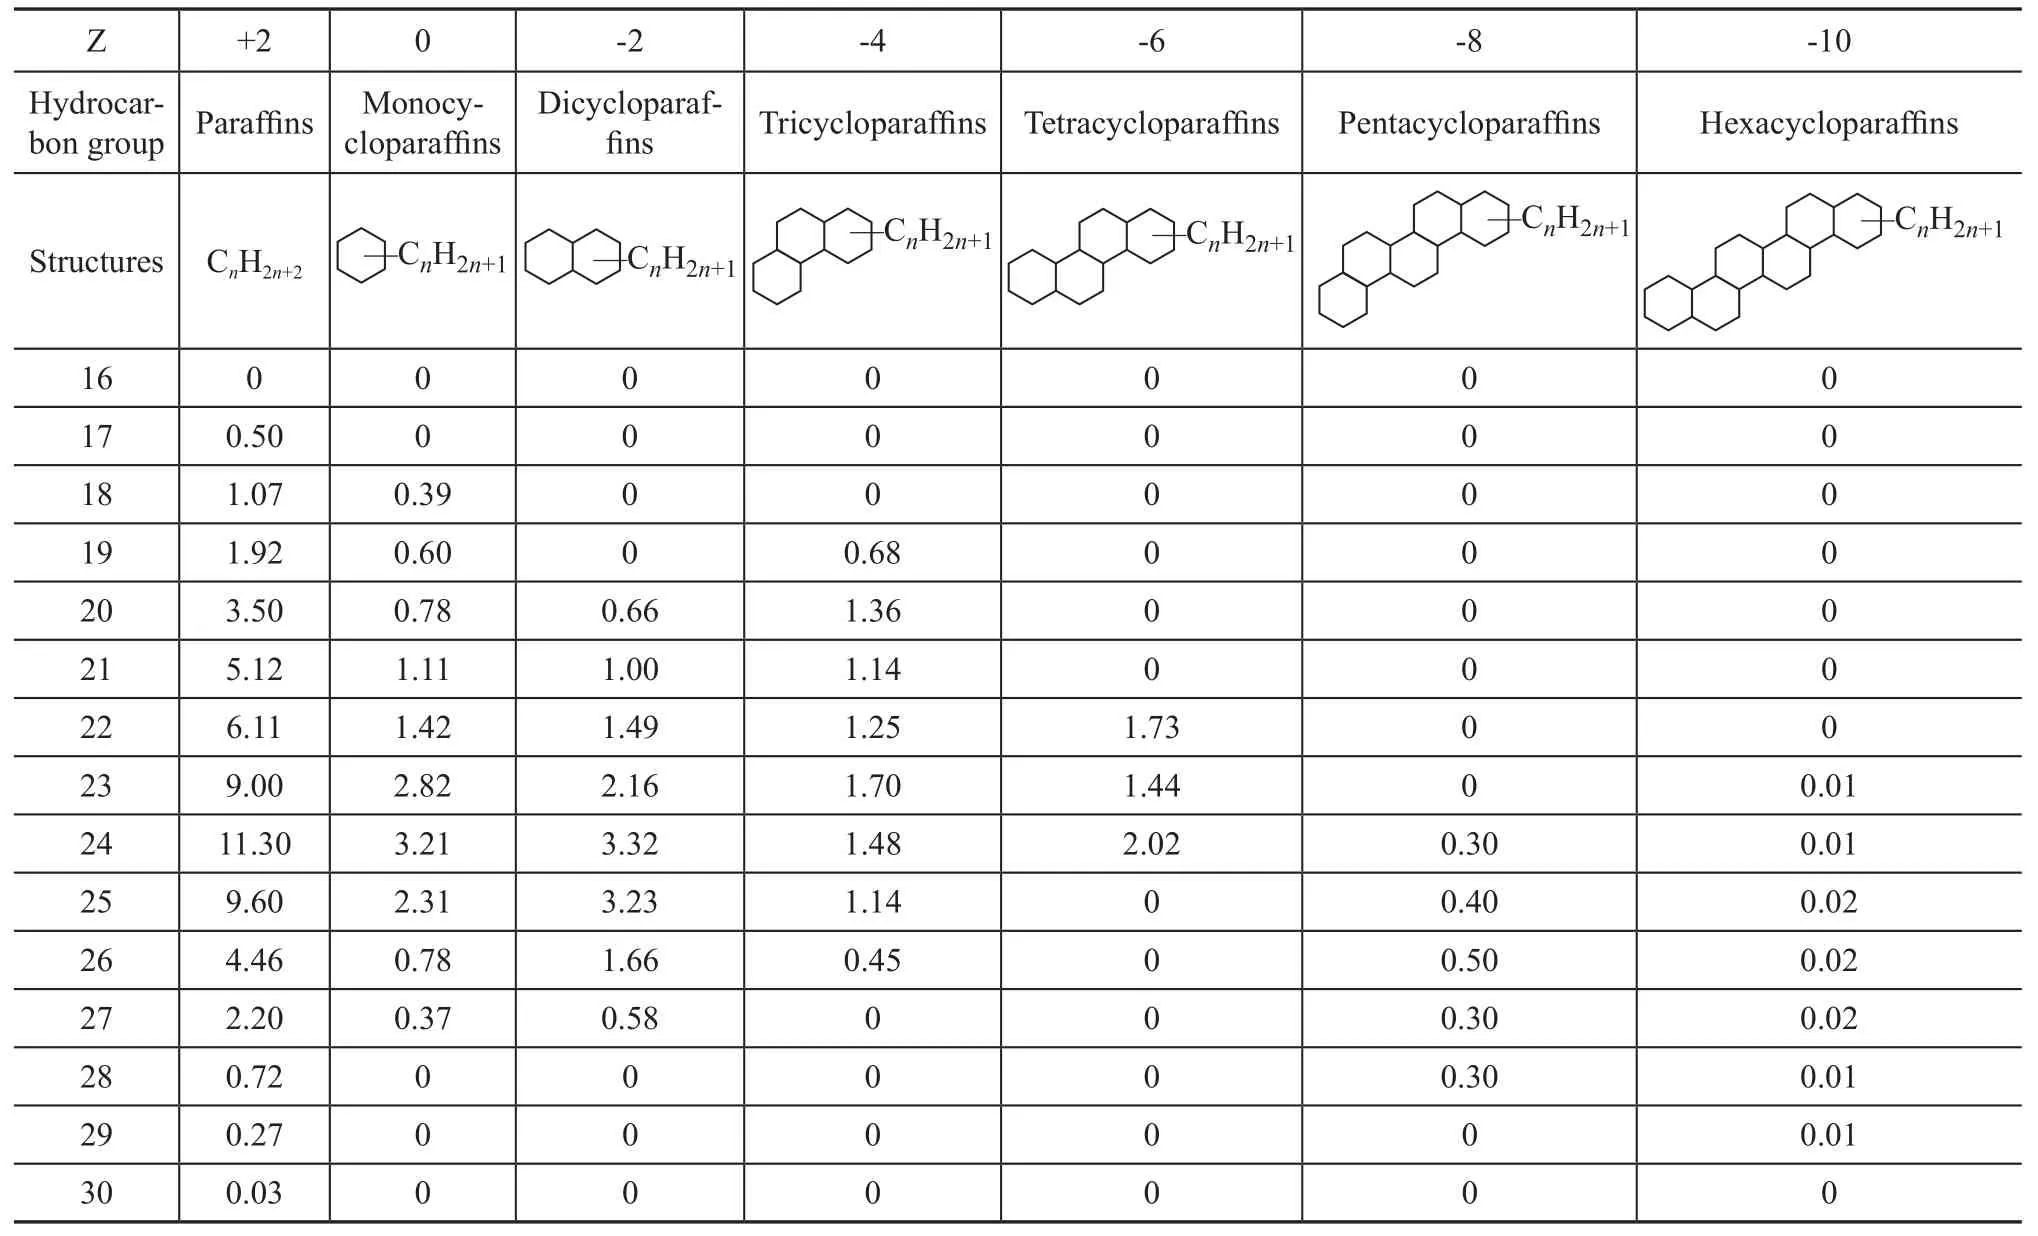
Table 3 Hydrocarbon group composition of DQ-1S
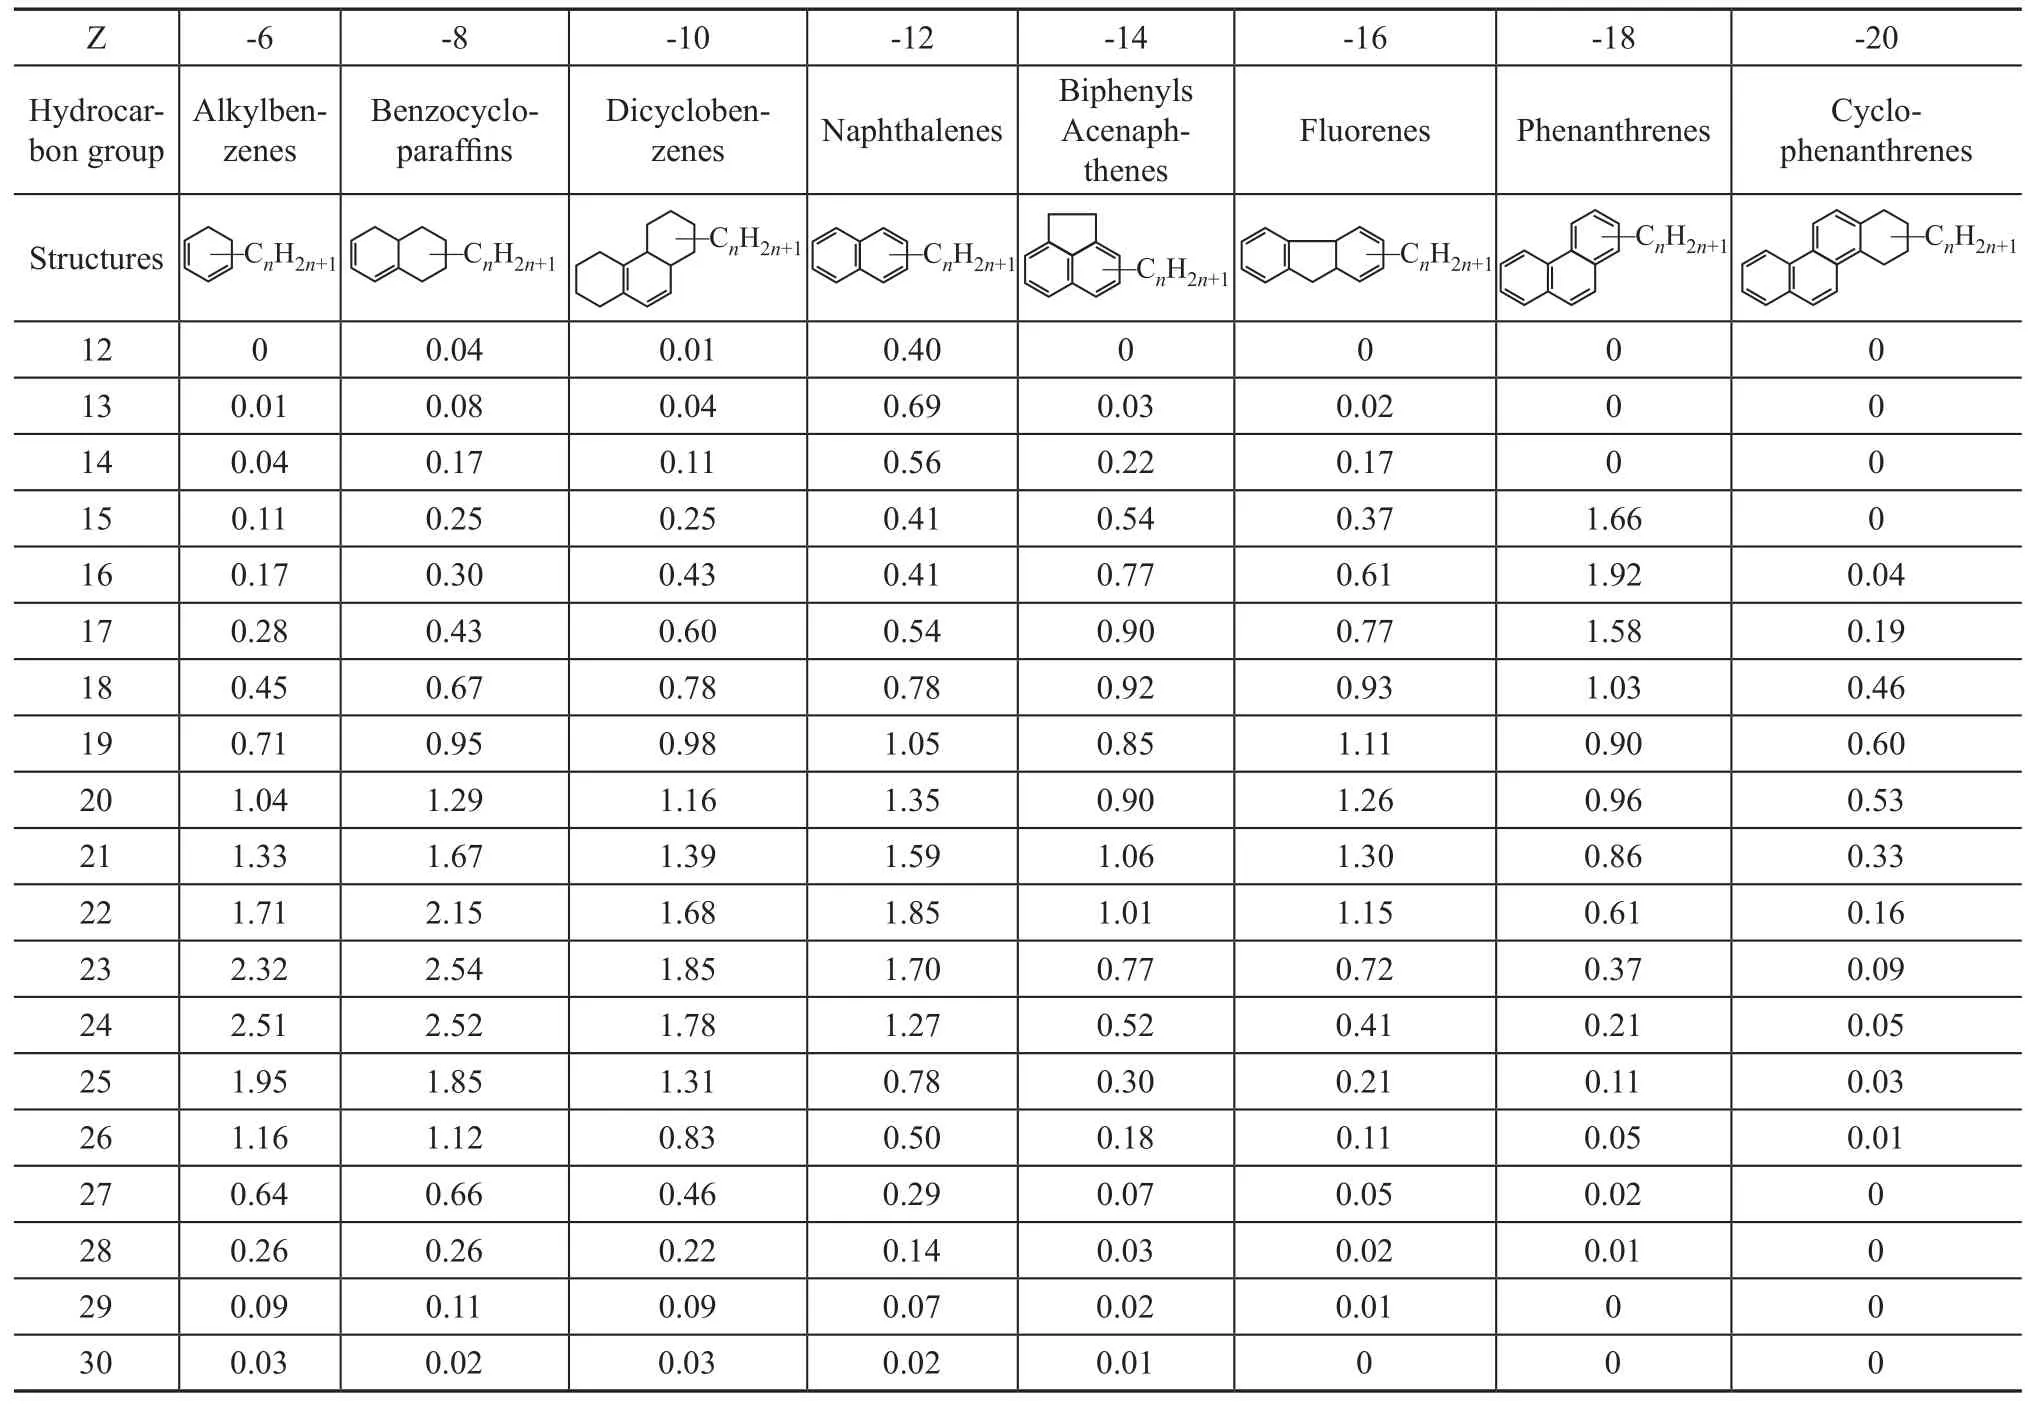
Table 4 Hydrocarbon group composition of DQ-1A
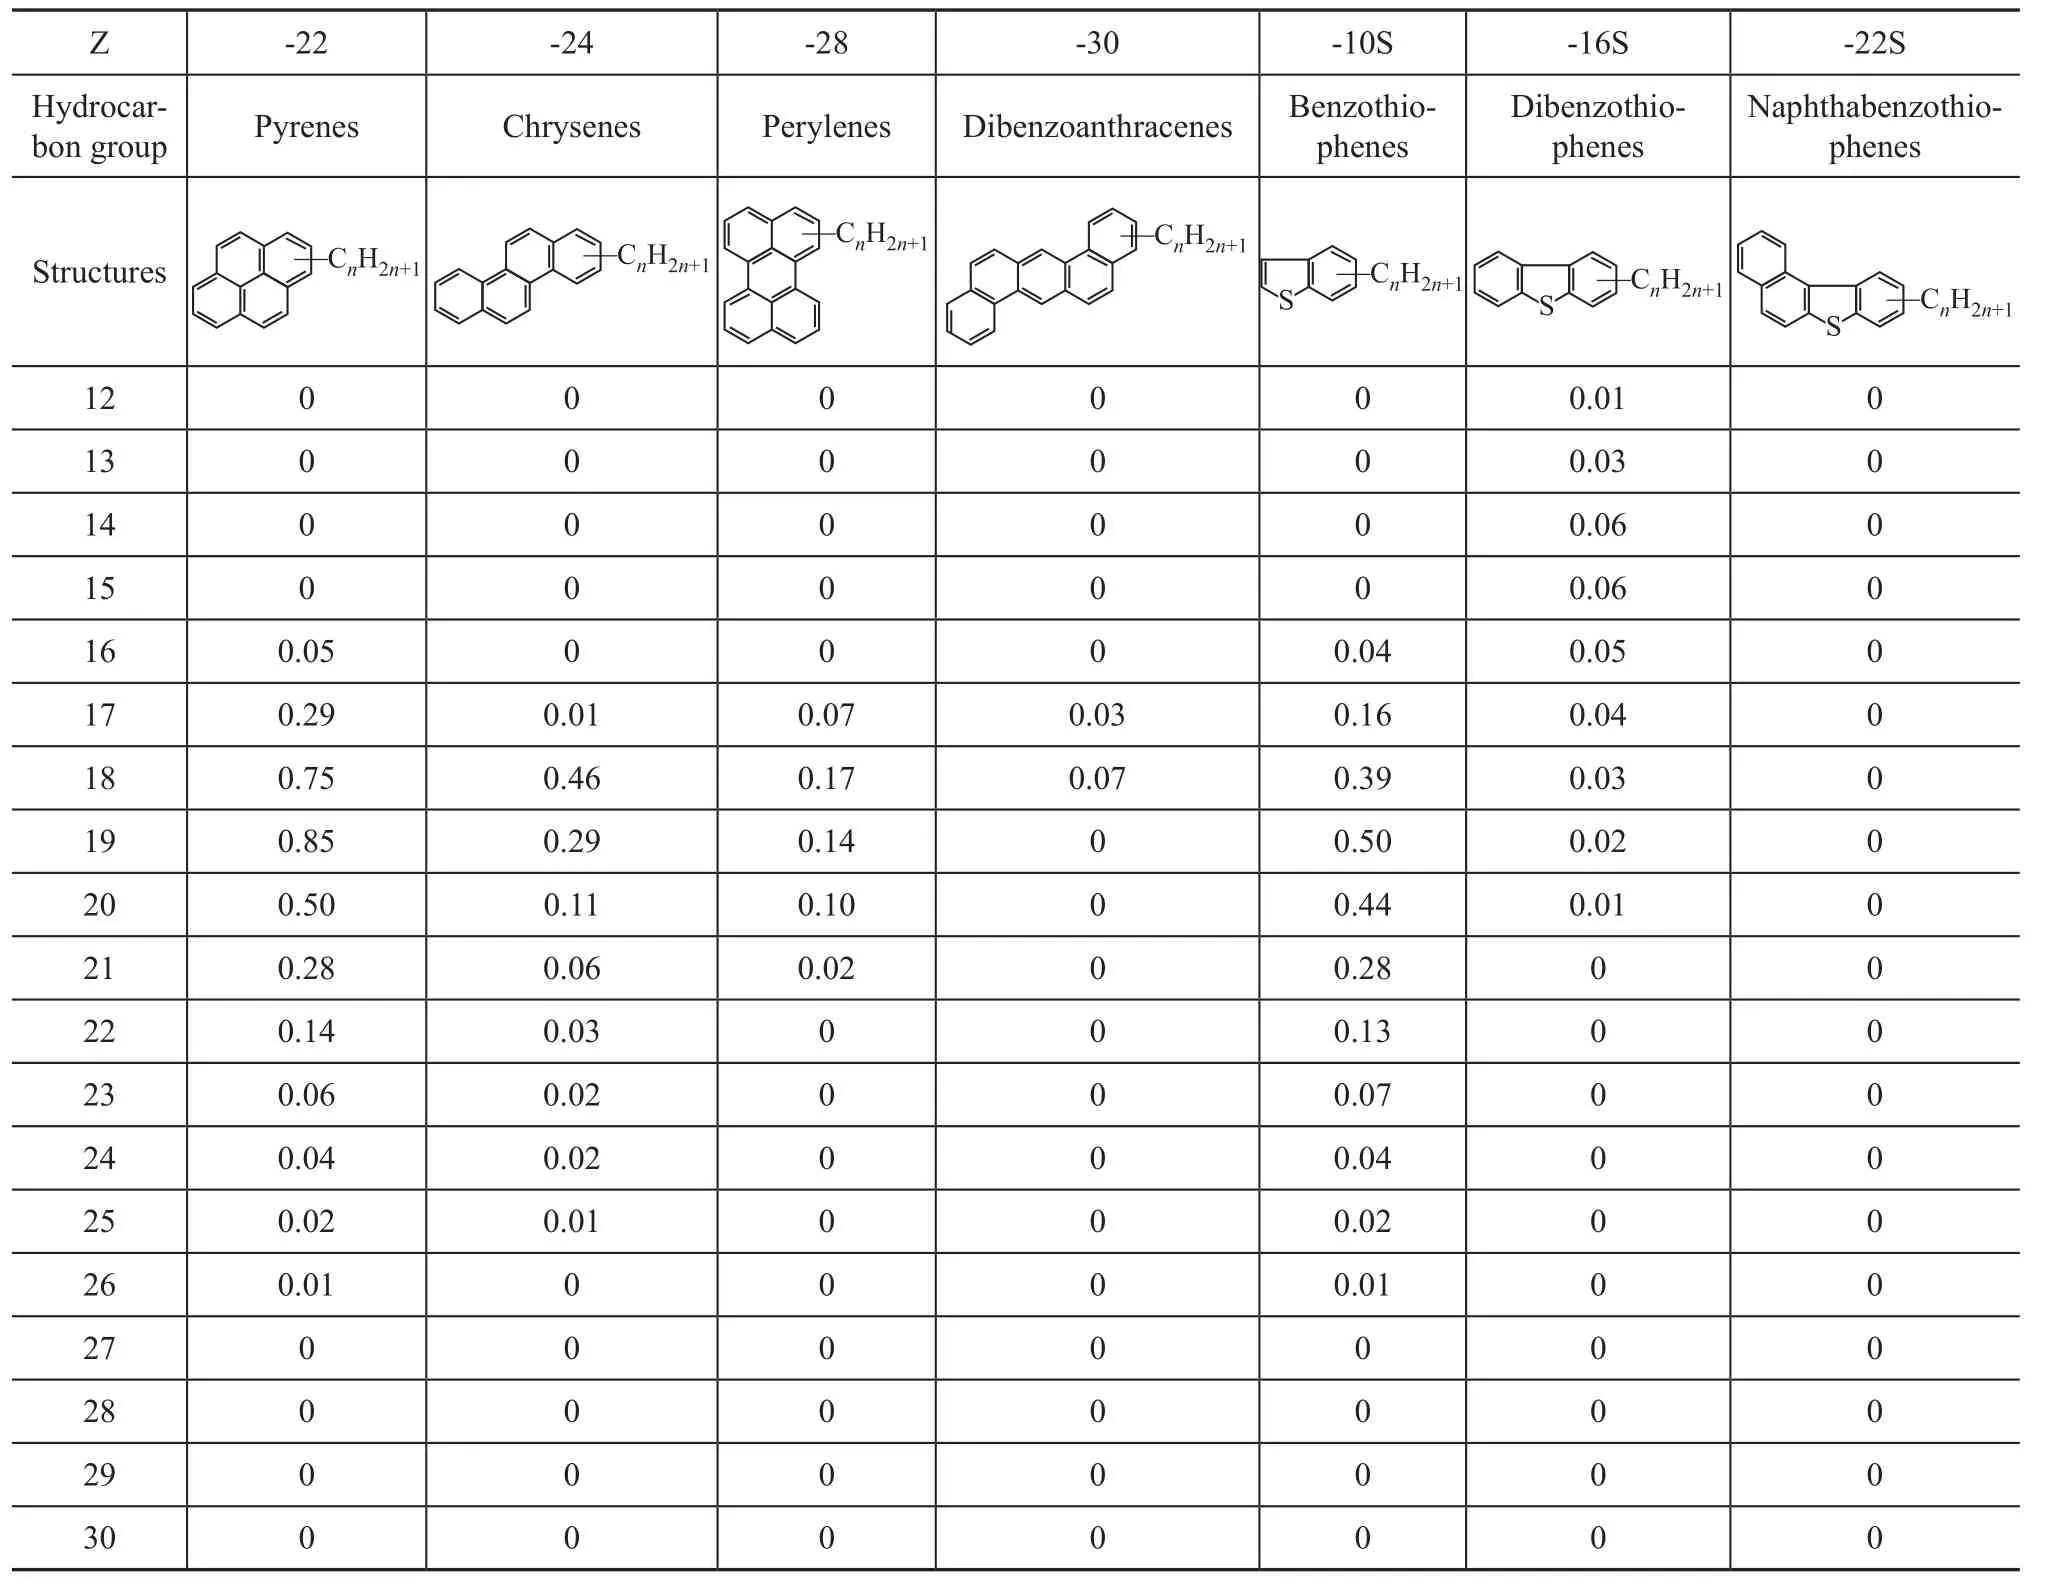
(Table 4 continued)
3.2 Determination of correlation parameters
The FCC product yields (obtained under fixed operating conditions) had been approximately calculated from hydrocarbon group compositions of the feedstocks based on the conversion regulations of BSU[6]. However, as the three issues mentioned above, the depth and accuracy of calculation results would be largely limited, and the calculation procedure is quite complicated. Therefore, the calculation methods need to be further improved.
In this paper, mathematical regression was adopted to correlate hydrocarbon group compositions with the FCC product distribution. Compared with the traditional methods, the hydrocarbon group composition used in this work was based on the quasi-molecular level data. However, the detailed analysis data have to be simplified to make the correlation approach feasible. To minimize the loss of molecular level information during the simplification procedure, the correlation parameters should be carefully determined.
The parameters were mainly selected from BSU which had been mentioned previously and properly compressed to make the correlation more creditable within the limited data (30 groups) of reaction performance. It still relied on the assumption that the same BSU could follow similar cracking regulations under common FCC conditions.
The 9 parameters included:P—the weight percent of paraffins and paraffinic side chains;N—the weight percent of monocycloparaffins;N2—the weight percent of dicycloparaffins;A—the weight percent of benzenes;AN—the weight percent of benzocycloparaffins;A2—the weight percent of naphthalenes;A2N—the weight percent of naphthocycloparaffins;MA—the weight percent of tricyclic aromatics and aromatics with more than three rings, andR—the weight percent of resins.
It should be noted that: 1) the polycyclic naphthenic structures were decomposed into monocyclic and dicyclic naphthenic BSU, and their contents were represented byNandN2; 2) the sulfur-containing aromatics and unidentified aromatics were combined into aromatics approximately because of inadequate quantitative analysis data and limited understanding of the cracking mechanism.
The correlation parameter compositions of 30 feedstocks are listed in Table 5. It can be seen from the data listed in Table 5 that with regard to the saturate components, the values of parameters containing aromatic carbon atoms were 0 or very close to 0; however with regard to aromatics, the value of parameterPwas high (as aromatics contain paraffinic side chains). Furthermore, with regard to saturate and aromatic components the value of parameterRwas 0, because resins had been separated from them.
3.3 Correlation of hydrocarbon group compositions with FCC product yields
Hydrocarbon group composition parameters of the 30 feedstocks were correlated with FCC product yields (obtained over the same catalyst under fixed operating conditions) by means of statistical method. However, as the number of basic data was limited to 30, and the parameter compositions of the feedstocks were very different (espe-cially in respect to saturates and aromatics), the accuracy of the correlation would be affected to some extent. The final correlation formulas of FCC product yields are shown below:
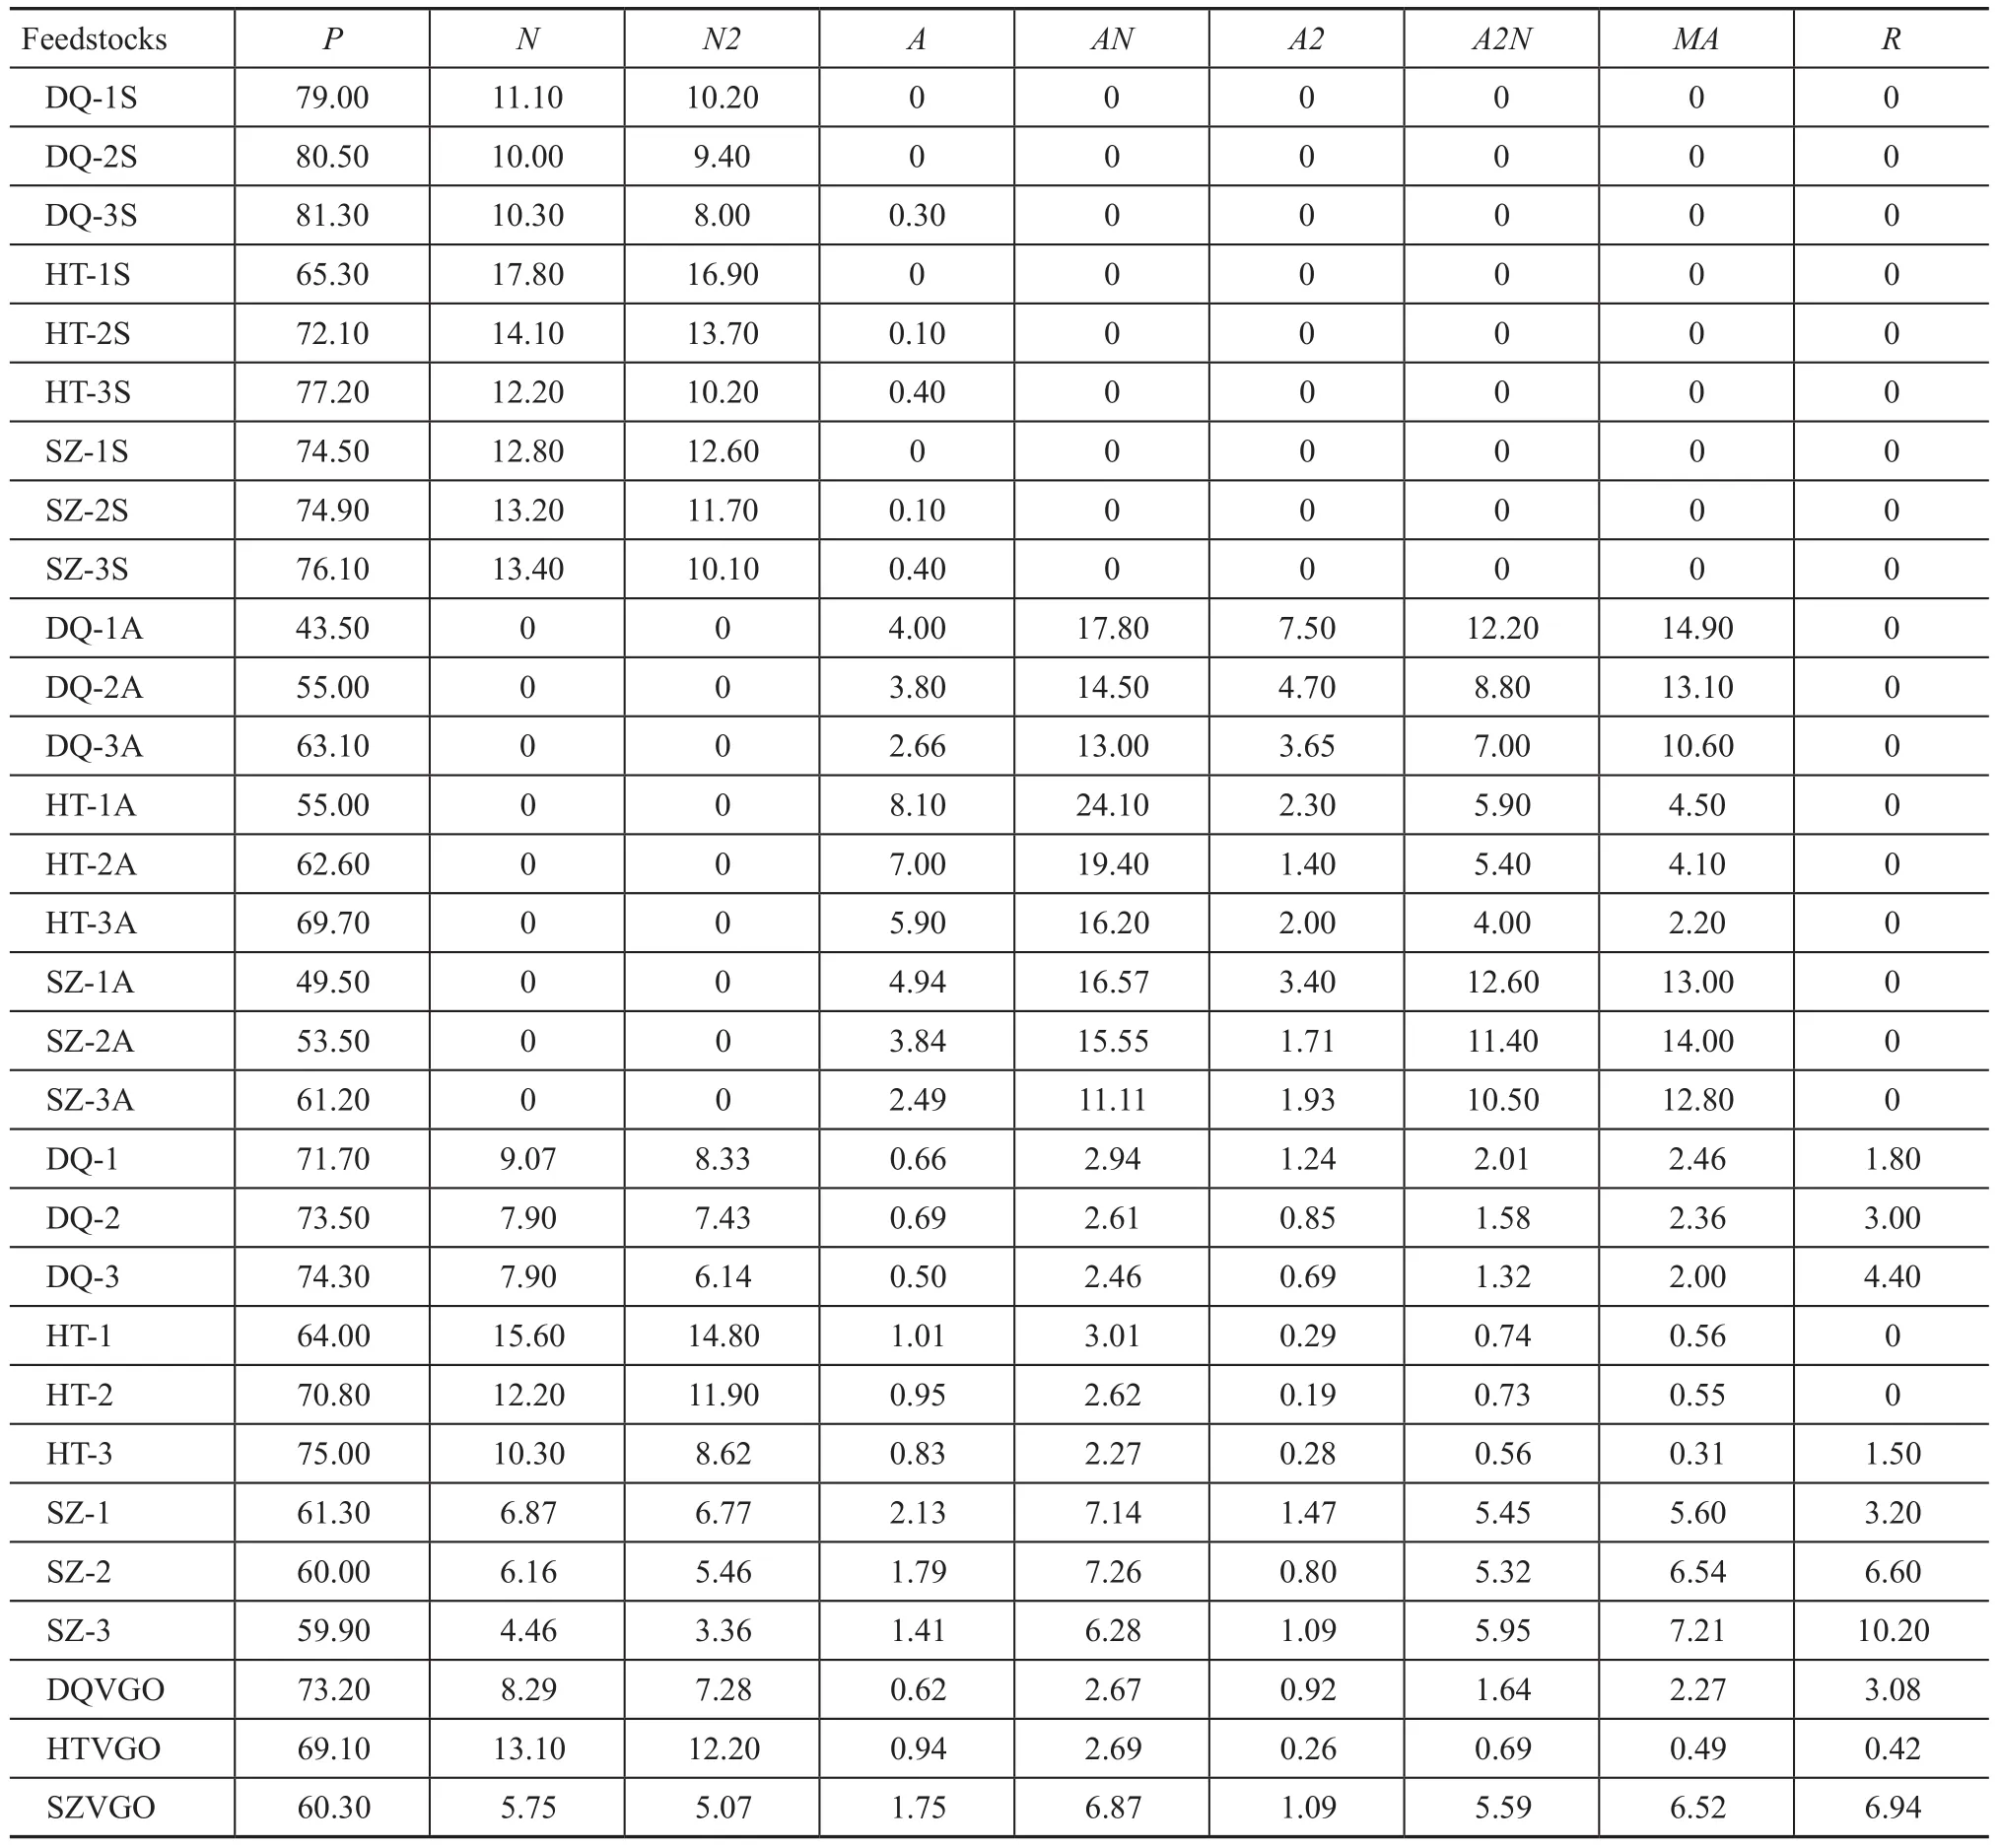
Table 5 Correlation parameters of the 30 feedstocks
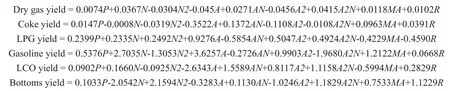
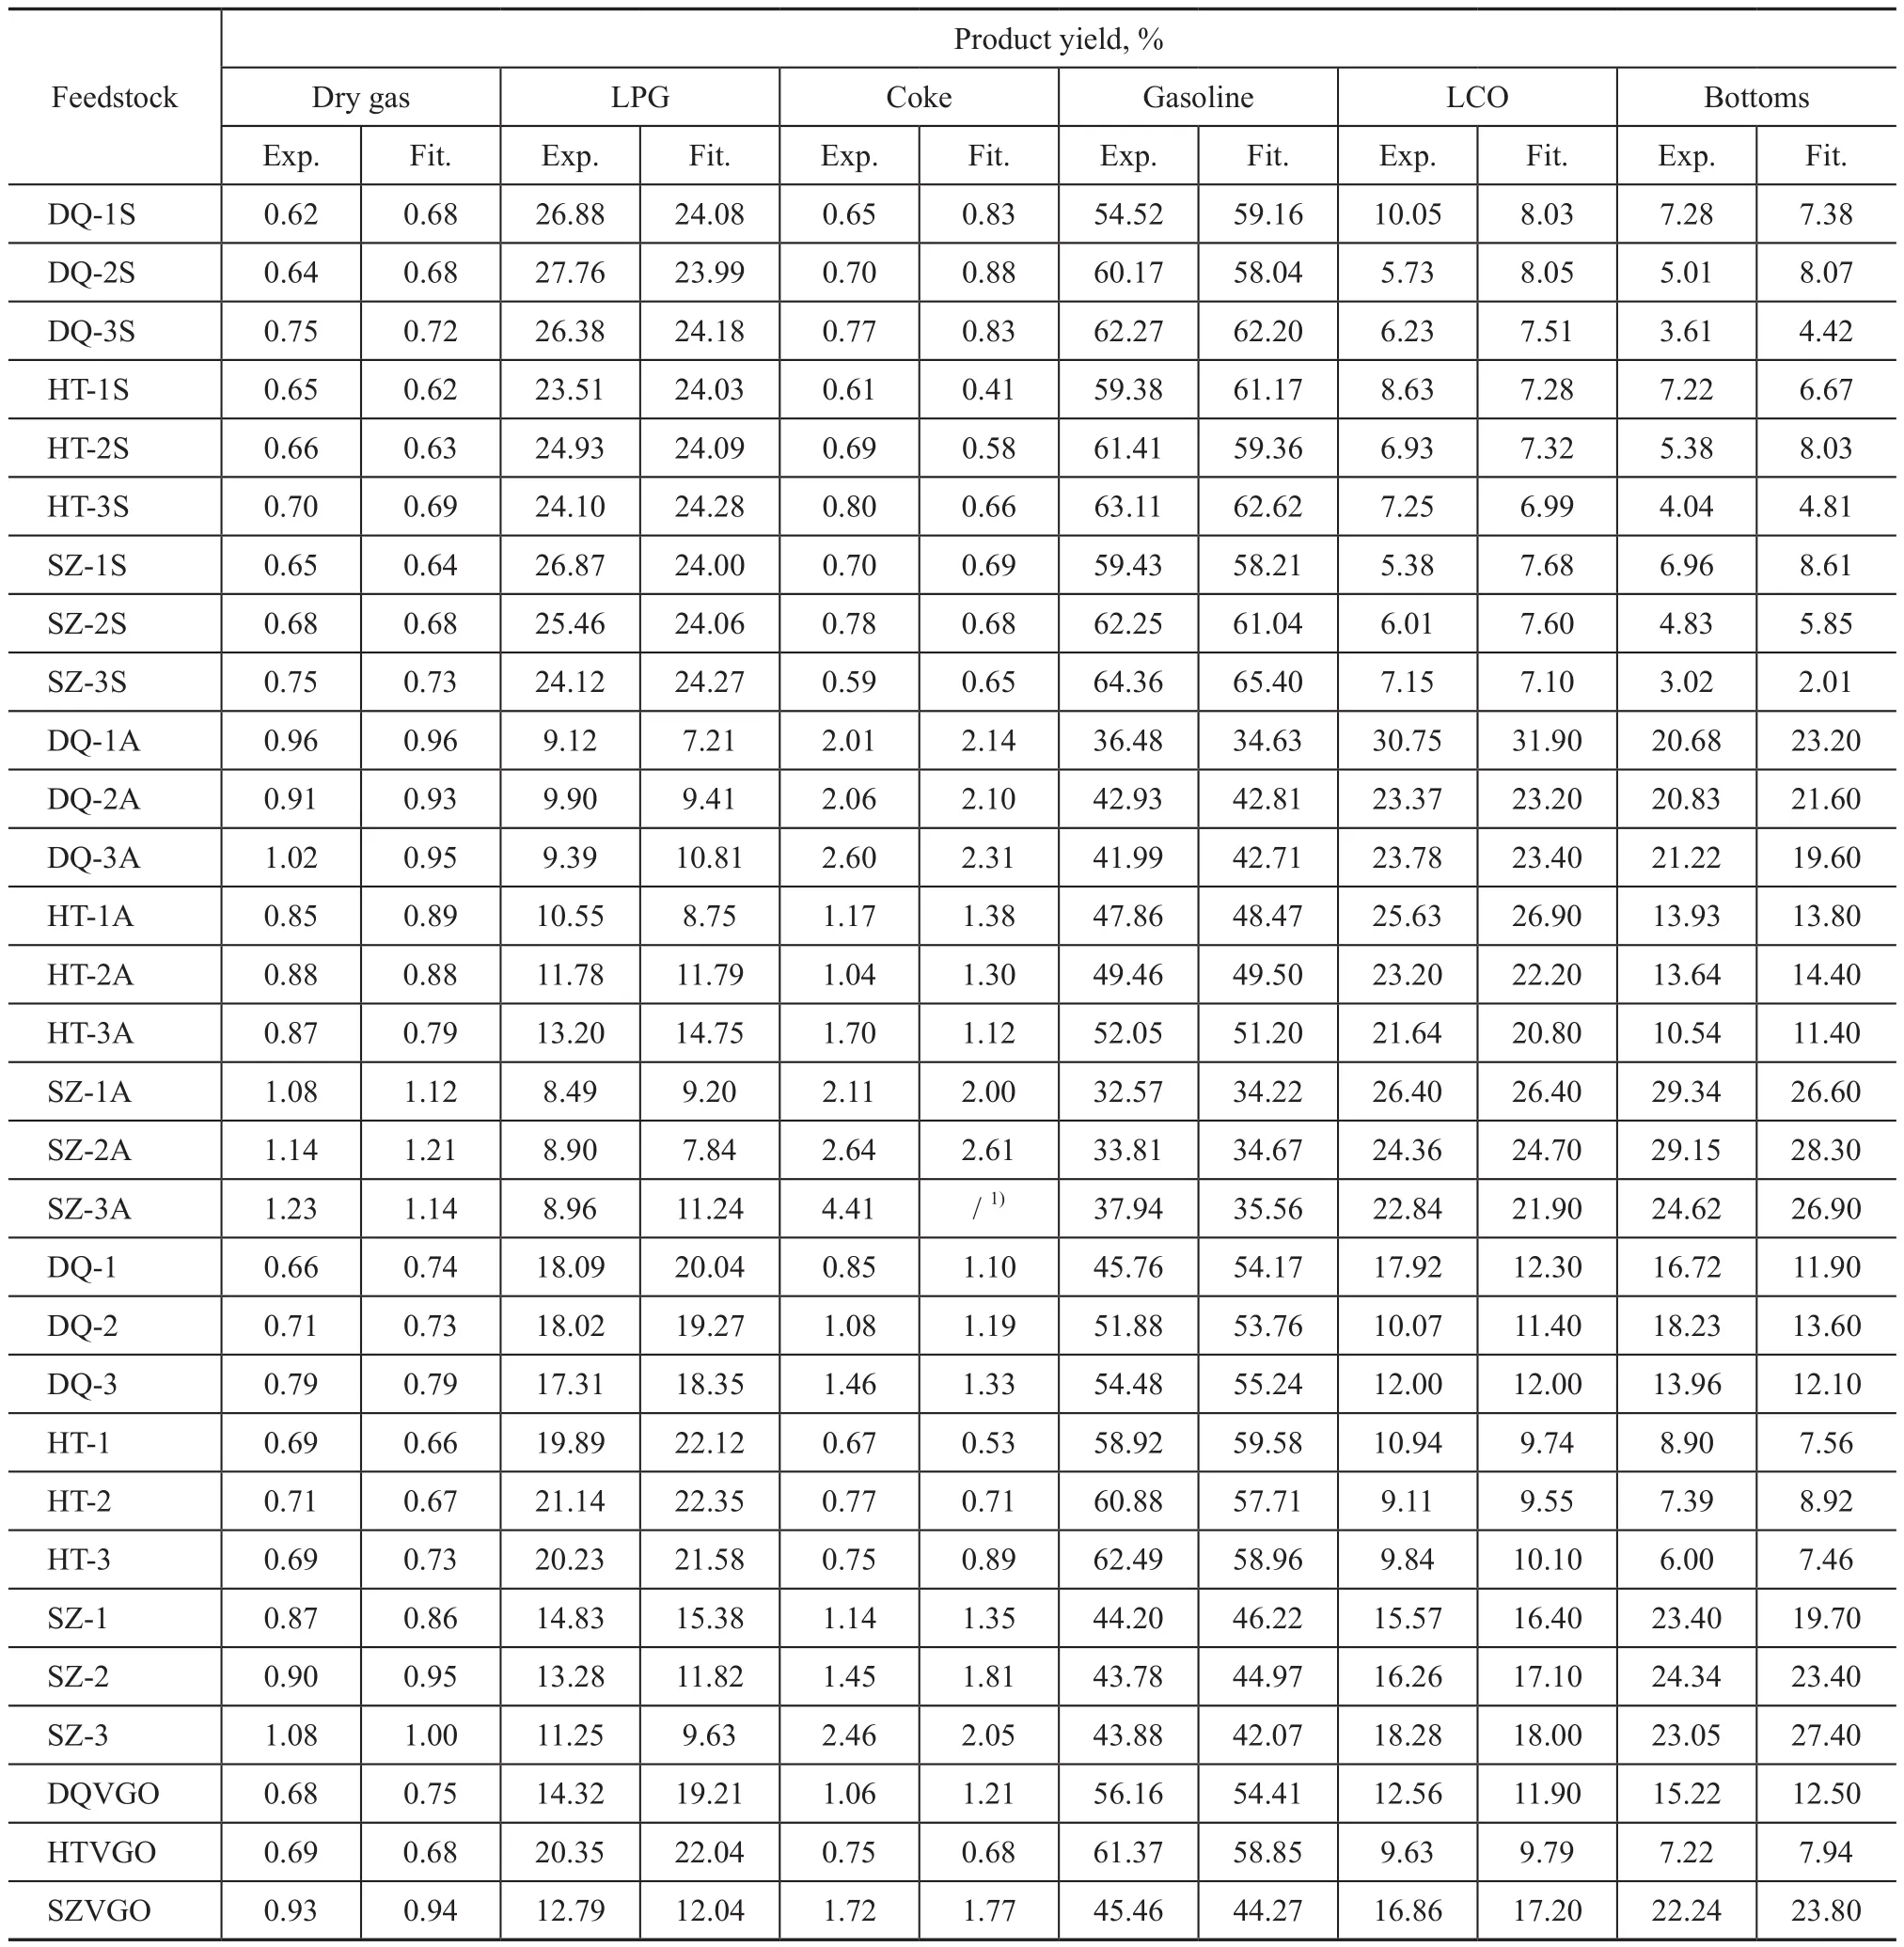
Table 6 Experimental and fitted values of FCC product yields
The experimental and fitted values are listed in Table 6, and are plotted in Figure 1 to make a clear comparison. It can be seen from Figure 1 that the fitted values are in good agreement with the experimental data.
To verify the correlation results, two other VGO feedstocks (A and B) were selected and characterized by the above mentioned methods to obtain correlation parameters (as shown in Table 7). Then the parameters were put in the correlation formulas to calculate product yields that were further compared with experimental results (as shown in Table 8). It can be seen from Table 8 that the calculated results were in good agreement with the experimental ones, which implied that the correlation formulas could be reliably used in predicting the distribution of FCC products derived from various VGO feedstocks.
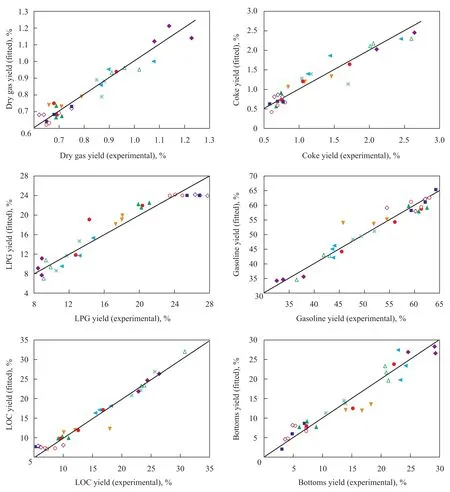
Figure 1 Comparison of experimental and fitted values of FCC product yields
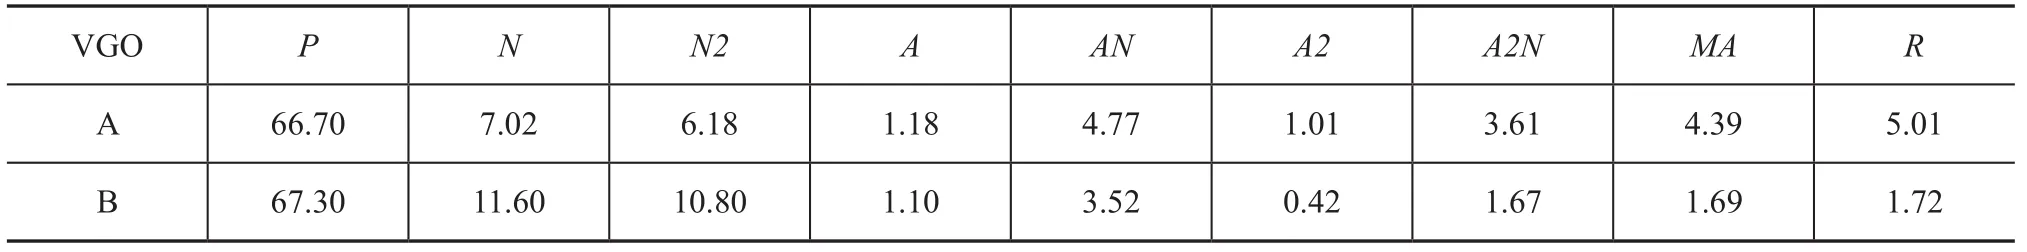
Table 7 Correlation parameters of two other VGO feedstocks
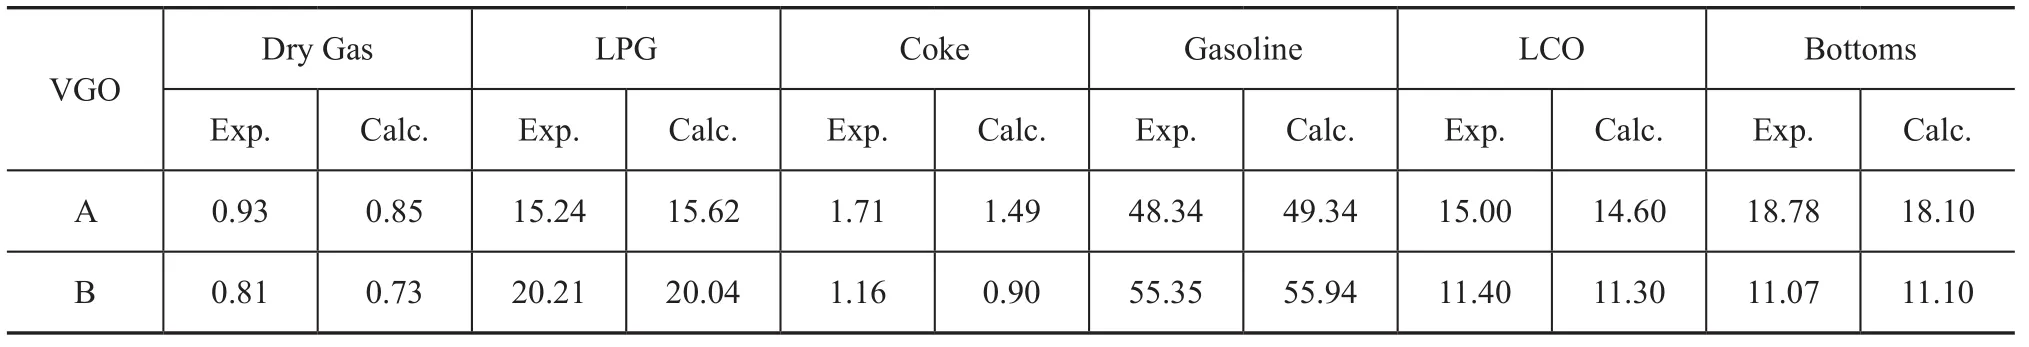
Table 8 Experimental and calculated FCC product yields
4 Conclusions
(1) Through the combination of separation and analysis methods, the saturates and aromatic components were separated from VGO samples, with their hydrocarbon group compositions identified on the quasi-molecular level. Based on the assumption of basic structure units, 9 correlation parameters were ascertained and their values in the 30 samples (including 3 VGO feedstocks, 9 distillates and 18 hydrocarbon components) were determined.
(2) The statistical method was adopted to correlate hydrocarbon group compositions (by correlation parameters) with FCC product yields, and a series of correlation formulas were obtained. As the mathematical regression was used, the correlation formulas were simpler in form than calculations based on conversion regulations and reaction models; in addition, since the correlation parameters were put forward on the quasi-molecular level analysis data, more molecular level information was obtained compared to traditional correlation models.
(3) Two other VGO feedstocks were selected to verify the correlation formulas by comparing calculated product yields with experimental ones. The results complied well with each other which implied that the correlation formulas could be effectively used in predicting the distribution of FCC products derived from various VGO feedstocks.
(4) The correlation formulas could be further improved by incorporating the influence of catalyst, temperature and other kinetic factors.
[1] Avidan A A. FCC is far from being a mature technology[J]. Oil & Gas Journal, 1992, 18(5): 59-67
[2] Chen Ye-Mon. Recent advances in FCC technology [J]. Powder Technology, 2006, 163: 2-8
[3] Mao Anguo. Optimizing FCC operation conditions to compensate the change in feedstock property [J]. Petroleum Processing and Petrochemicals, 2006, 37(10): 36-41 (in Chinese)
[4] Chen Junwu. Fluid Catalytic Cracking Technology and Engineering [M]. Beijing: China Petrochemical Press, 2005: 925-1001 (in Chinese)
[5] Xu Chunming, Gao Jinsen, Zhao Suoqi, et al. Correlation between feedstock SARA components and FCC products yields [J]. Fuel, 2005, 84: 669-674
[6] Song Haitao. Hydrocarbon structures and compositions of different VGO feedstocks and the correlation with catalytic cracking performance [D]. Beijing: Research Institute of Petroleum Processing, 2011: 21-122 (in Chinese)
[7] Liu Zelong, Li Yunlong, Gao Hong, et al. Research of group analysis of petroleum fractions by quadrupole GC/MS and its software development[J]. Petroleum Processing and Petrochemicals, 2001, 32(3): 44-48 (in Chinese)
[8] Zhu Xinyi, Liu Zelong, Tian Songbai, et al. Determination of carbon number distribution of vacuum gas oil by GC field ionization time-of-flight mass spectrometry [J]. Acta Petrolei Sinica (Petroleum Processing Section), 2012, 28(3): 426-431 (in Chinese)
Recieved date: 2012-10-25; Accepted date: 2012-12-25.
Dr. Song Haitao, Telephone: +86-10-82368392; E-mail: songht.ripp@sinopec.com.

- 中国炼油与石油化工的其它文章
- Alumina Supported Vanadium Oxide Catalysts for Residue Hydrotreating
- Commercial Applications of Paraxylene Adsorbents RAX-2000A and RAX-3000
- Et3NHCl-AlCl3Ionic Liquids as Catalyst for Alkylation of Toluene with 2-Chloro-2-methylpropane
- Purification of Crude Glycerol from Waste Cooking Oil Based Biodiesel Production by Orthogonal Test Method
- Degradation of Nitrobenzene-Containing Wastewater with O3and H2O2by High Gravity Technology
- Highlights on Planned Grassroots Styrene Units and Expansion of Existing Styrene Units in China