
Wave Pressure Acting on V-Shaped Floating Breakwater in Random Seas
2015-04-01 01:57YUYangDINGNingLINJieandHOUJiajia
YU Yang, DING Ning, LIN Jie, and HOU Jiajia
Wave Pressure Acting on V-Shaped Floating Breakwater in Random Seas
YU Yang1), DING Ning2), 3), *, LIN Jie4), and HOU Jiajia5)
1),,100190,2),,300072,3),300161,4),,300300,5),,300452,
Wave pressure on the wet surface of a V-shaped floating breakwater in random seas is investigated. Considering the diffraction effect, the unit velocity potential caused by the single regular waves around the breakwater is solved using the finite-depth Green function and boundary element method, in which the Green function is solved by integral method. The Response-Amplitude Operator (RAO) of wave pressure is acquired according to the Longuet-Higgins’ wave model and the linear Bernoulli equation. Furthermore, the wave pressure’s response spectrum is calculated according to the wave spectrum by discretizing the frequency domain. The wave pressure’s characteristic value corresponding to certain cumulative probability is determined according to the Rayleigh distribution of wave heights. The numerical results and field test results are compared, which indicates that the wave pressure calculated in random seas agrees with that of field measurements. It is found that the bigger angle between legs will cause the bigger pressure response, while the increase in leg length does not influence the pressure significantly. The pressure at the side of head sea is larger than that of back waves. When the incident wave angle changes from 0˚ to 90˚, the pressure at the side of back waves decreases clearly, while at the side of head sea, the situation is more complicated and there seems no obvious tendency. The concentration of wave energy around low frequency (long wavelength) will induce bigger wave pressure, and more attention should be paid to this situation for the structure safety.
random seas; V-shaped floating breakwater; wave pressure; boundary element method; spectrum analysis
1 Introduction
With the fast development of ocean exploration, break- waters have been widely used in ocean engineering practice to reduce wave height in working areas. There are many different forms of breakwaters designed for different environments. A V-shaped breakwater is effectively designed for offshore construction or open sea cargo transferring between ships. As the bow of the breakwater faces incident waves, an angle forms between the breakwater’s leg and the direction of incident waves. Waves inside the breakwater are reduced due to wave reflection and diffraction by the extended breakwater body under the water surface. However, the reflection and diffraction effects will induce wave force and moment on the wet surface of the breakwater as well as attenuate waves inside the breakwater. Being the integration of wave pressure on the wet surface, these forces are parts of the main loads in the analysis of anchoring and body structure, and play a very important role in the design of breakwaters under random seas. If wave pressure is determined, the wave force and moment can be easily estimated. Therefore, studying the characteristics of wave pressure on the wet surface of a V-shaped breakwater in random seas has practical significance in its design.
Some researches have been done about the V-shaped breakwater. Cheng(2005) studied wave diffraction and wave attenuation. Lu(2007) studied excited wave force. Chang(2012) studied the distribution of wave height and wave attenuation. However, though many studies examined wave pressure on other kinds of breakwaters, no previous studies have focused on the investigation of wave pressure on the wet surface of V-shaped breakwaters in random seas. MuniReddy and Neelamani (2003) carried out a series of physical model tests in a wave flume to examine the performance of defense structure (offshore submerged breakwater) in reducing wave pressure on seawalls/caissons. Based on the potential flow theory for regular wave propagation, Elchahal(2006) set up an analytical model to compute the pressure of sea waves on vertical breakwaters, in which wave pressure was expressed in a linear form. Additionally, an extension to the structural analysis was studied, which was based on the mechanics of continuous medium for the stress distribution inside the fixed breakwater and on the frame theory for the floating breakwater. Elchahal(2007) investigatied the hydrodynamic prssure over the floating breakwater without considering diffraction or transmission of regular waves. By assimilating port quay walls Elchahal(2009) investigated the hydrodynamic performance of moored rectangular floating breakwaters with a leeward boundary. With various mooring configu- rations Ozeren(2011) investigated the hydro-dy- namic interactions of cylindrical breakwaters (single- and multiple-cylinder cross sections) with monochromatic waves in deep and transitional waters. Wang(2011) investigated the interactions between surface and sub- merged horizontal/vertical plates with regular waves. Duan(2012) studied the sheltering effects on arc-shaped floating perforated breakwaters using an analytical method.
It can be noticed that these studies focused on the investigation of wave pressure acting on breakwaters under regular waves or wave attenuating effects, but not on V-shaped floating breakwaters. In this paper, the wave pressure on the wet surface of V-shaped floating breakwaters in random seas is investigated. Considering the diffraction effect, the unit velocity potential around a breakwater caused by the single regular wave is solved using the finite-depth Green function and the boundary element method, in which the Green function near the breakwater is solved by integral method. The frequency response function of wave pressure is acquired according to the Longuet-Higgins’ wave model and the linear Bernoulli equation. From this, the Response-Amplitude Operator’s (RAO) numerical solution is obtained by calculating the unit velocity potential, and furthermore, the wave pressure’s response spectrum is calculated according to the wave spectrum. Considering that wave height obeys the Rayleigh distribution, the wave pressure’s characteristic value corresponding to certain cumulative probability is determined. Taking the wave spectrum of field measurements as an example, the wave pressure spectrum at a typical point is calculated, and the com-parative analysis indicates an agreement between the numerical and field results. It can be found that the larger angle between legs will cause the larger pressure response while, clearly, the increase in leg length does not influence the pressure. The pressure at the side of head sea is larger than that of back waves. When the incident wave angle changes from 0˚ to 90˚, the pressure at the side of back waves decreases obviously, while at the side of head sea, the situation is more complicated and no clear tendency is displayed. The concentration of wave energy around low frequency (long wavelength) will induce bigger wave pressure, and more attention should be paid to this situation for the safety of structures.
2 The Determination of Wave Pressure of Regular Waves
Let the draft of the V-shaped breakwater be, the length of each of the breakwater’s two legs be, the angle between its two legs be(<π), and the water depth be(<) (see Fig.1). The coordinate system iswith the origin located at the bow of the breakwater. The planeis the surface of calm water, the axisis the midline of the breakwater with its forward direction towards the stern, the axisis the upright, and the axisobeys the right-hand rule. The incident wave is a single regular wave train with,andbeing its amplitude, frequency and incident angle (between the wave direction and the forward direction of), respectively. The wave pressure on the wet surface of the breakwater in this problem can be solved according to the linear Bernoulli equation with the velocity potential determined in the linear frequency domain as follows.
In order to get effective wave attenuation, the breakwater needs to be anchored firmly. As a result, its motions of six freedoms are very small and the consequent wave pressure excited by radiation effect is very small comparing with that excited by the incident waves and the diffraction effect. It is reasonable to calculate the sum of wave pressures excited by the incident waves and the diffraction waves as the final results while ignoring the pressure excited by radiation effect.

Fig.1 Breakwater and coordinate system.
According to the superposition principle, the total velocity potential Φ of flow field around the breakwater can be written as the sum of the two parts Φand Φ:

By introducing the complex functions7(,,) and0(,,),the space and time variables of velocity potential can be separated as follows:
,

,
whereis the wave potential with the unit amplitude,7is the diffraction potential around the breakwater excited by the waves with the unit amplitude,is the acceleration of gravity,is the wave frequency, and0is the root of equation0·th(0·)2/. According to the linear Bernoulli equation, the wave pressure at any point in the flow field is:

Using the wave potential and the diffraction potential, the wave pressure can be written as follows:
. (1)
The wave pressure can then be converted for the determination of diffraction potential.
The boundary conditions of diffraction potential are:

(=0), (3)
(=−), (4)

(on the body surface). (6)
It is a boundary value problem of the Laplace equation, which can be changed to another form by the 3-D Green function and the Green formula (Dai, 1998),

where(,,) is a field point,(,,) is a source point,7() is the source intensity at the source point, and(,) is the 3-D Green function of finite depth in the frequency domain. Eq. (7) satisfies the same definite conditions as Eqs. (2)–(5):
(in the flow field),

(−),
,
where2/and. Taking the remaining condition Eq. (6) into account, the numerical solution of source intensity7() can be solved by discretizing the wet surfaceSusing the boundary element method.7is then calculated by Eq. (7) and the wave pressure in the wet surface of breakwater can be determined from Eq. (1). For the determination of the Green function in this paper, refer to Newman (1984, 1985, 1986) and Endo (1987). Besides, the irregular frequencies are removed based on an integral equation obtained by including a panel model of the internal water plane (Ohmatsu, 1975).
3 The Wave Pressure in Random Seas
According to the Longuet-Higgins’s wave model (Long- uet-Higgins, 1975), the wave surface is expressed as:

where() is the distance from the wave surface to the still water level,a,kandare the amplitude, wave number and frequency of theth composition wave, respectively, andεis the initial phase of theth composition wave.εis a random variable that obeys the uniform distribution in (0, 2π),() obeys the normal distribution, and wave height obeys the Rayleigh distribution.
In the linear frequency domain, the total velocity potential of flow field in random seas has the same form as that of regular waves:

where the wave potential is:
,

the diffraction potential is:
.
In the above equation7is the diffraction potential cor- responding to theth composition wave potential. From these equations it can be seen that the transformation defined by Eqs. (2)–(5) is linear. If random waves are defined as input and wave pressure is defined as output, then the wave pressure, according to the superposition principle of a linear system (Yu, 2011), can be written as follows:

,
where the complex function()is the frequency response function and its modulus |()| is the system’s response amplitude operator (RAO). As the numerical solution of7was obtained in Section 2 and0also known, the numerical solution of() can be determined by calculating the values of() at all frequencies. However, the corresponding values of() at all frequencies cannot be calculated because of the infinite number of the values. Therefore the frequency domain is discretized intosubintervals for the calculations with70 (Yu, 2011). And the cut-off-frequencyis determined under the condition that the energy loss must be less than 0.2%. By multiplying the squares of these calculated values and given wave spectrum, the spectrum of wave pressure is determined at the corresponding frequency. Furthermore, the statistical results of wave pressure can also be obtained by calculating the corresponding cumulative probability.
4 Example and Analysis
The wave pressure on the external wet surface of a V-shaped breakwater is calculated under the conditions that the water depth=13.4m, the draft=7.3m, the leg length=77.1m, the angle between the two legs=60˚, and the beam of legs=2.4m.
Fig.2 is a 3-D view of the breakwater’s panel layout. Newman and Lee (1992) recommended a minimum of 6 to 12 panels per the smallest wavelength. In this example, the longitudinal panel length of 1.0m corresponds to a minimum of 6.24 panels per the shortest wavelength of 6.24m at 2s. Fig.3 is the transient distribution of external wave pressure of regular waves with amplitude=1.2m, period=3s, and incident angle=0˚, and it is consistent with the results of Wamit by Briggs (2001).

Fig.2 3-D view of the panel layout.

Fig.3 Transient distribution of external wave pressure of regular waves.
Fig.4 is the measured wave spectrum by Briggs (2001), for which the peak frequency is 0.3Hz with the wave energy concentrated on. Fig.5 is the calculated and measured external wave pressure spectrum at point1(8.133, 4.692, −2.959) with=0˚. Figs.6 and 7 are the time-history curves of the external wave pressure calculated and meas- ured at the same point. The comparison in Fig.5 indicates that the calculated results are consistent with the field results with two peaks at 0.12Hz and 0.3Hz, respectively.

Fig.4 Measured wave spectrum.

Fig.5 Wave pressure spectrum.

Fig.6 Time-history curve of wave pressure calculated in random seas.
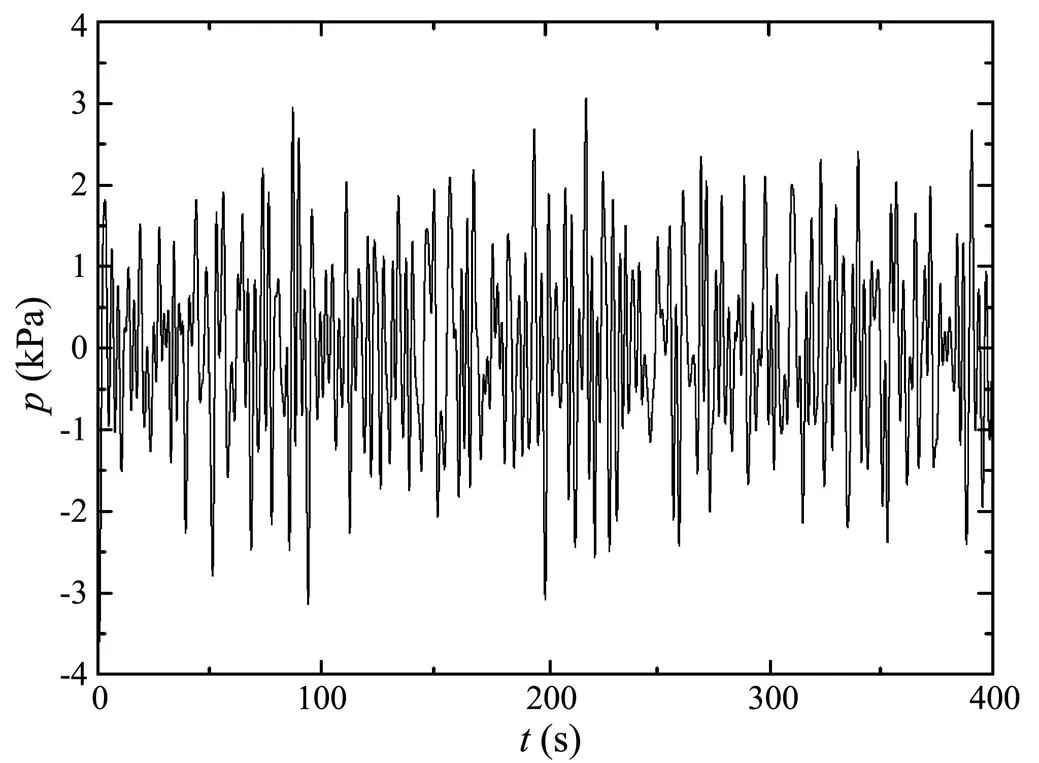
Fig.7 Time-history curve of wave pressure measured in random seas.
Table 1 shows the significant wave height (1/3) and the corresponding wave pressures calculated according to wave spectrum, calculated and measured wave pressure spectrum. The calculated wave pressure,1/3, is almost the same as the measured wave pressure,1/3, which indicates that the radiation effect may be neglected for a properly fixed breakwater. In fact, for an improperly properly fixed floating breakwater, the designed level of wave reduction effect may not be achieved.

Table 1 Significant wave height, and calculated and measured wave pressures (P'H1/3 and PH1/3) in random seas
Figs.8 and 9 are the calculated results at1(8.133, 4.692, −2.959) and its mirror2(8.133, −4.692, −2.959) about theplane with=60˚. Figs.10 and 11 are the calculated results at1and2with=90˚. Figs.12 and 13 are the calculated results at1and2with=60˚ and=154m. The spectral peaks are all around 0.12Hz and 0.3Hz in those figures, which indicates that the response of wave pressure of low frequency (long wavelength) waves is larger than that of higher frequency (short wavelength) waves. The pressure response spectrums at1and2with=0˚ are the same due to the breakwater symmetry. When=30˚,=60˚ and=90˚, the pressure spectrum is larger at2than that at1because2is at the side of head sea while1is at the side of back waves. From Figs.8, 10 and 12, it can be seen that at the side of back waves the pressure spectrum decreases withincreasing from 0˚ to 90˚, while at the side of head sea the situation is more complicated and there seems no obvious tendency. Whenchanges from 60˚ to 90˚, the pressure spectrum become larger. There is no significant difference as the leg lengthchanges from 77m to 154m.

Fig.8 Wave pressure spectrum calculated at P1 (α=60˚).

Fig.9 Wave pressure spectrum calculated at P2 (α=60˚).

Fig.10 Wave pressure spectrum calculated at P1 (α=90˚).
5 Conclusions
The structural response in random seas can be estimated using wave pressures on the structure. The wave pressures can be used to calculate wave forces and moments, operational stresses, and ultimately to benefit the design for survivability. However, wave pressures are random variables in normal working conditions. In order to determine the statistical characteristics of the pressures, a numerical model is built according to Longuet-Higgins wave model in the linear frequency domain. The objective of the modeling study is to make the spectrum analysis and solve the boundary value problem by finding the velocity potential that satisfies the Laplace equation and four linearized boundary conditions for the free surface, bottom, body surface, and radiation condition.
The numerical solution of the velocity potential at each frequency is obtained in the frequency domain using the finite depth Green function and boundary element method by assuming the flow to be ideal and time-harmonic. The response amplitude operator (RAO) is estimated according to the Bernoulli equation and superposition principle. The wave pressure spectrum is then determined by multiplying the square of RAO and the wave spectrum at each frequency. Following that, the statistical characteristics of pressures are estimated by calculating the corresponding cumulative probability.
The external regular wave pressure is calculated, and the results are consistent with Wamit calculated by Briggs (2001). The calculated pressures are compared to the measured values at a typical point, and the comparison presents the consistent results. The larger angle between legs will correspond to larger pressure response, while the increase in leg length does not have significant influence on pressure. The pressure at the side of head sea is larger than that of back waves. As the incident wave angle changes from 0˚ to 90˚, the pressure at the side of back waves decreases obviously. At the side of head sea, however, the situation is more complicated and there seems no obvious tendency. The concentration of wave energy around low frequencies (long wavelengths) will induce larger wave pressure, and more attention should be paid to this situation for structure safety.
Acknowledgements
This work was supported by the Science Fund for Creative Research Groups of the National Natural Science Foundation of China (Grant no. 51021004), the Research Fund of State Key Laboratory in Ocean Engineering of Shanghai Jiaotong University (Grant no. 1104), and the Scientific Research Foundation of Civil Aviation University of China (Grant no. 09QD08X).
Briggs, M. J., 2001. Analytical and numerical models of the RIBS XM99 ocean-scale prototype., TR-01-19, Washington, DC.
Chang, K.-H., Tsaur, D.-H., and Huang, L.-H., 2012. Accurate solution to diffraction around a modified V-shaped breakwater., 68: 56-66.
Cheng, J. S., Miao, G. P., You, Y. X., and Wang, J. Q., 2005. Analytical research on the wave diffraction on V-type bottom-mounted breakwaters., 39 (5): 813-817.
Dai, Y. S., 1998.. National Defence Industry Press, Beijing, 125-133.
Duan, J. H., Cheng, J. S., and Wang, J. P., 2012. Wave diffraction on arc-shaped floating perforated breakwaters., 26 (2): 305-316.
Elchahal, G., Younes, R., and Lafon, P., 2006. Wave interaction with fixed and floating vertical breakwater based on analytical modeling. In:. Miami,1: 463-472, DOI: 10.1115/FEDSM2006-98348.
Elchahal, G., Younes, R., and Lafon, P., 2007. Numerical modeling of floating breakwaters and shape optimization using a nonlinear programming method. In:. San Diego, 5: 235-240, DOI: 10.1115/OMAE2007-29116.
Elchahal, G., Younes, R., and Lafon, P., 2009. Parametrical and motion analysis of a moored rectangular floating breakwater., 131 (3), 031303, DOI: 10.1115/1.3124125.
Endo, H., 1987. Shallow-water effect on the motions of three-dimensional bodies in waves., 31 (1): 34-40.
Longuet-Higgins, M. S., 1975. On the joint distribution of the period and amplitudes of sea waves., 80 (18): 2688-2694.
Lu, Z. M., Miao, G. P., Zhu, R. C., and Cheng, J. S., 2007. Analytical research on the wave force exerted on V-shaped bottom-mounted breakwaters., 22 (1): 135-140.
MuniReddy, M. G., and Neelamani, S., 2003. Reduction of wave pressures on vertical seawall/caissons due to an offshore breakwater. In:. Cancun, 3: 487-493, DOI: 10.1115/OMAE2003-37074.
Newman, J. N., 1984. Double-precision evaluation of the oscillatory source potential., 28 (3): 151-154.
Newman, J. N., 1985. Algorithms for the free-surface Green function., 19: 57-67.
Newman, J. N., 1986. Distributions of sources and normal dipoles over a quadrilateral panel., 20: 113-126.
Newman, J. N., and Lee, C.-H., 1992. Sensitivity of wave loads to the discretization of bodies. In:, London, Vol. 1, 50pp.
Ohmatsu, S., 1975. On the irregular frequencies in the theory of oscillating bodies in a free surface., Tokyo, No. 48.
Ozeren, Y., Wren, D. G., Asce, A. M., and Work, P. A., 2011. Experimental investigation of cylindrical floating breakwater performance with various mooring configurations., 137: 300-309.
Wang, K., Zhang, Z. Q., and Xu, W., 2011. Transmitted and reflected coefficients for horizontal or vertical plate type breakwater., 25 (2): 285-294.
Yu, Y. X., 2011.Dalian University of Technology Press, Dalian, 47-66.
(Edited by Xie Jun)
DOI 10.1007/s11802-015-2450-2
ISSN 1672-5182, 2015 14 (6): 975-981
© Ocean University of China, Science Press and Springer-Verlag Berlin Heidelberg 2015
(August 1, 2013; revised April 8, 2014; accepted August 24, 2015)
* Corresponding author. Tel: 0086-22-84656945 E-mail: n_ding@163.com
 Journal of Ocean University of China2015年6期
- Journal of Ocean University of China的其它文章
- Inversion Study on Pollutant Discharges in the Bohai Sea withthe Adjoint Method
- Different Responses of Sea Surface Temperature in the North Pacific to Greenhouse Gas and Aerosol Forcing
- The Change Features of the West Boundary Bifurcation Line of the North Equatorial Current in the Pacific
- Dynamic Response of a Riser Under Excitation of Internal Waves
- An Effective Method of UV-Oxidation of Dissolved Organic Carbon in Natural Waters for Radiocarbon Analysis by Accelerator Mass Spectrometry
- Distribution and Cycling of Carbon Monoxide in the East China Sea and the Marine Atmosphere in Autumn