
Spatial and Seasonal Patterns of Ichthyoplankton Assemblages in the Haizhou Bay and Its Adjacent Waters of China
2015-04-01 02:10LIZengguangYEZhenjiangandWANRong
LI Zengguang, YE Zhenjiang, *, and WAN Rong, 2)
Spatial and Seasonal Patterns of Ichthyoplankton Assemblages in the Haizhou Bay and Its Adjacent Waters of China
LI Zengguang1), YE Zhenjiang1), *, and WAN Rong1), 2)
1),,266003,.2),,266237,
Surveys were conducted in five voyages in Haizhou Bay and its adjacent coastal area from March to December 2011 during full moon spring tides. The ichthyoplankton assemblages and the environmental factors that affect their spatial and seasonal patterns were determined. Totally 35 and 12 fish egg and larvae taxa were identified, respectively. Over the past several decades, the egg and larval species composition has significantly changed in Haizhou Bay and its adjacent waters, most likely corresponding with the alteration of fishery resources, which are strongly affected by anthropogenic activities and climate change. The Bray-Curtis dissimilarity index identified four assemblages: near-shore bay assemblage, middle bay assemblage and two closely related assemblages (near-shore/middle bay assemblage and middle/edge of bay assemblage). The primary species of each assemblage principally reflected the spawning strategies of adult fish. The near-shore bay assemblage generally occurred in near-shore bay, with depths measuring <20m, and the middle bay assemblage generally occurred in the middle of bay, with depths measuring 20 to 40m. Spatial and seasonal variations in ichthyoplankton in each assemblage were determined by interactions between biological behavioral traits and oceanographic features, particularly the variation of local conditions within the constraint of a general reproductive strategy. The results of Spearman’s rank correlation analysis indicated that both fish egg and larval abundance were positively correlated with depth, which is critical to the oceanographic features in Haizhou Bay.
ichthyoplankton, composition, horizontal patterns, assemblage, Haizhou Bay
1 Introduction
Haizhou Bay is an open bay in the southwestern Yellow Sea along the coast of Jiangsu and Shandong Provinces, China (Fig.1A). This area has important fishery activity that involves different fishing types and target species, depending on the seasonal variation in species abundance. With characteristics of the temperate zone, the fish community is primarily composed of migratory fish and local fish in Haizhou Bay and its adjacent waters (Tang and Ye, 1990). Because of overfishing and the destruction of habitats, such as spawning grounds, fishery resources have increasingly declined since the 1990s, and at present, there are only small-scale fishing seasons for some economical species, such as,andin this bay (Tang., 2011).
Ichthyoplankton, including fish egg and larva, is the early stage in the fish life history. The abundance of ichthyoplankton can help predict the recruitment of fish populations, which is fundamental for understanding the recruitment mechanism of marine fish. Therefore, ichthyoplankton surveys are important, and these surveys can provide the data faster and cheaper than adult fish surveys. The seasonal changes in the taxonomic composition, abundance and distribution of fish eggs and larvae are always the important criteria for fishery resource research and management (Pattrick and Strydom, 2008). Recruitment variability of marine fish is influenced by the reproductive potential of the stock and the survival of the fish at early life stages, mediated by environmental conditions of both a physical and a biological nature (Hinckley., 2001; Leis, 2007; Hüssy., 2012; Bonanno., 2013). Physical factors, such as temperature and salinity, can modulate egg and larval abundance in two different ways: by either affecting the spawning stock (Sánchez-Velasco., 2002) or influencing larval survival through their effects on growth and development (Johnston., 2001).
A few ichthyoplankton studies have been performed for Haizhou Bay regarding the ichthyoplankton community composition in the 1960s (Jiang, 1964) and the 1990s (Wan and Jiang, 1998). However, neither the commonness of the bay spawning nor the relations between early life history stages and oceanographic conditions have been studied along the oceanic front. Additionally, the response of ichthyoplankton assemblages to decadal changes in environmental factors that may be disturbed by anthropogenic activities and overfishing, has not been assessed. The present study aims to describe the composition and relative abundance of fish eggs and larvae in Haizhou Bay and its adjacent waters, as well as the environmental factors that determine these patterns, to determine the spatial patterns of ichthyoplankton of fishes that use the area as reproductive grounds. The data can be employed as a basis for future studies.
2 Materials and Methods
2.1 Study Area
The topography and submarine geomorphological types of the bay continental shelf are highly variable (Lin, 1989). In the north, the Lunan Trough, off the coast of Shandong Province, is an extension of the Yellow Sea trough. In the south, the Subei Bank is a wide stretch of tidal flats where the water depth is less than 20m, off the coast of the northern region of the Jiangsu Province. The Subei Bank and the Lunan Trough are critical to the circulation in the southwestern Yellow Sea (Wang, 2010), and the current velocities are obviously larger than in other areas (Zhao., 1991) in the Lunan Trough and in Paleo depressions, where the depth varies greatly (Fig.1B).
The Yellow Sea Cold Water Mass (YSCWM), which forms from May to October each year, is a unique hydrographic phenomenon in the Yellow Sea (Oh., 2013), and the boundary of the YSCWM is the main upwelling area (Zhao, 1987a). Continental shelf fronts, which are induced by tidal mixing, correlate well with the boundary of the YSCWM (Zhao, 1987b; Wang., 2013). A natural barrier for migratory fish is often constituted by oceanic fronts because of the large gradient of temperature and salinity, which influences the migration route and the location of fishing grounds. The Yellow Sea Coastal Current (YSCC), which is controlled by the local wind field, is a jet southward along the boundary of the YSCWM (Zhao, 1987a; Quan., 2013) (Fig.1B).
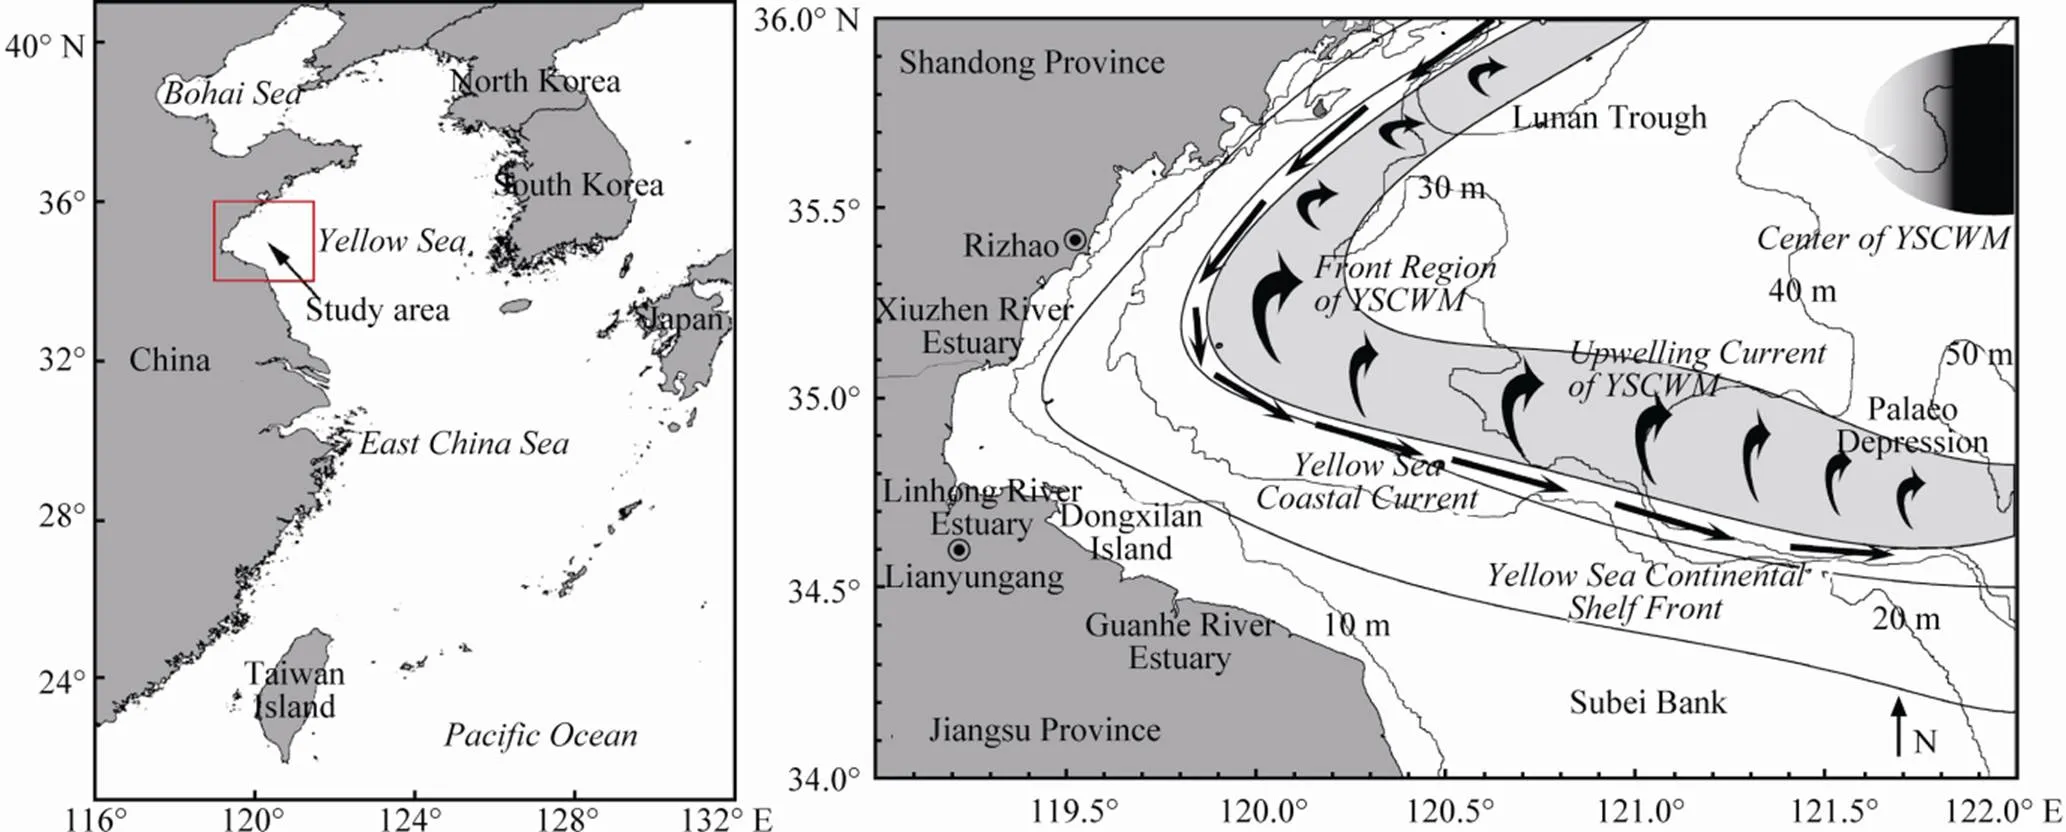
Fig.1 Study area (A) and regional map of oceanic front, shelf circulation and water mass in May (B). YSCWM: Yellow Sea Cold Water Mass.
2.2 Sample Collection and Analysis
Sampling was conducted during five cruises (March 25–27, May 23–25, July 20–22, September 25–26, and December 11–13). Because of the bad weather conditions, sampling was completed only at 14 stations in September. Ichthyoplankton samples were collected using plankton nets (0.505mm mesh size, 50cm in diameter and 145mm in length) that were towed at a 1m depth, with a constant speed of approximately two knots (1knot=1.853kmh−1) for 10min. All sampling were done during daylight hours. The plankton samples were immediately preserved in a 5% buffered formaldehyde seawater solution. Temperature (T, ℃) and salinity (S) were measured using a Seabird XR-420 CTD, and the current was simultaneously measured using a SLC9-2 current meter when the plankton was sampled.
The ichthyoplankton were sorted, counted and identified to the lowest possible taxonomic level under a binocular microscope following the published method (Zhao and Zhang, 1985; Okiyama, 1988; Shao., 2001). Qualitative and quantitative analyses were performed in the laboratory, and the catch in each tow was converted to catch per 10m2of sea surface area for the effects of ocean currents, waves and hauling speed (Wan., 2010).
2.3 Data Analysis
A one-way analysis of variance (ANOVA) was applied to test the differences among the monthly measurements of the sea surface temperature (SST, temperature at 5m depth), sea surface salinity (SSS, salinity at 5m depth), and fish egg and larval abundance. Egg and fish larval abundance were transformed as [log(x+1)] before the ana- lysis. The Student-Newman–Keuls test was used to define homogenous months (Isari., 2008). Missing data were estimated from the mean values of other replicates.
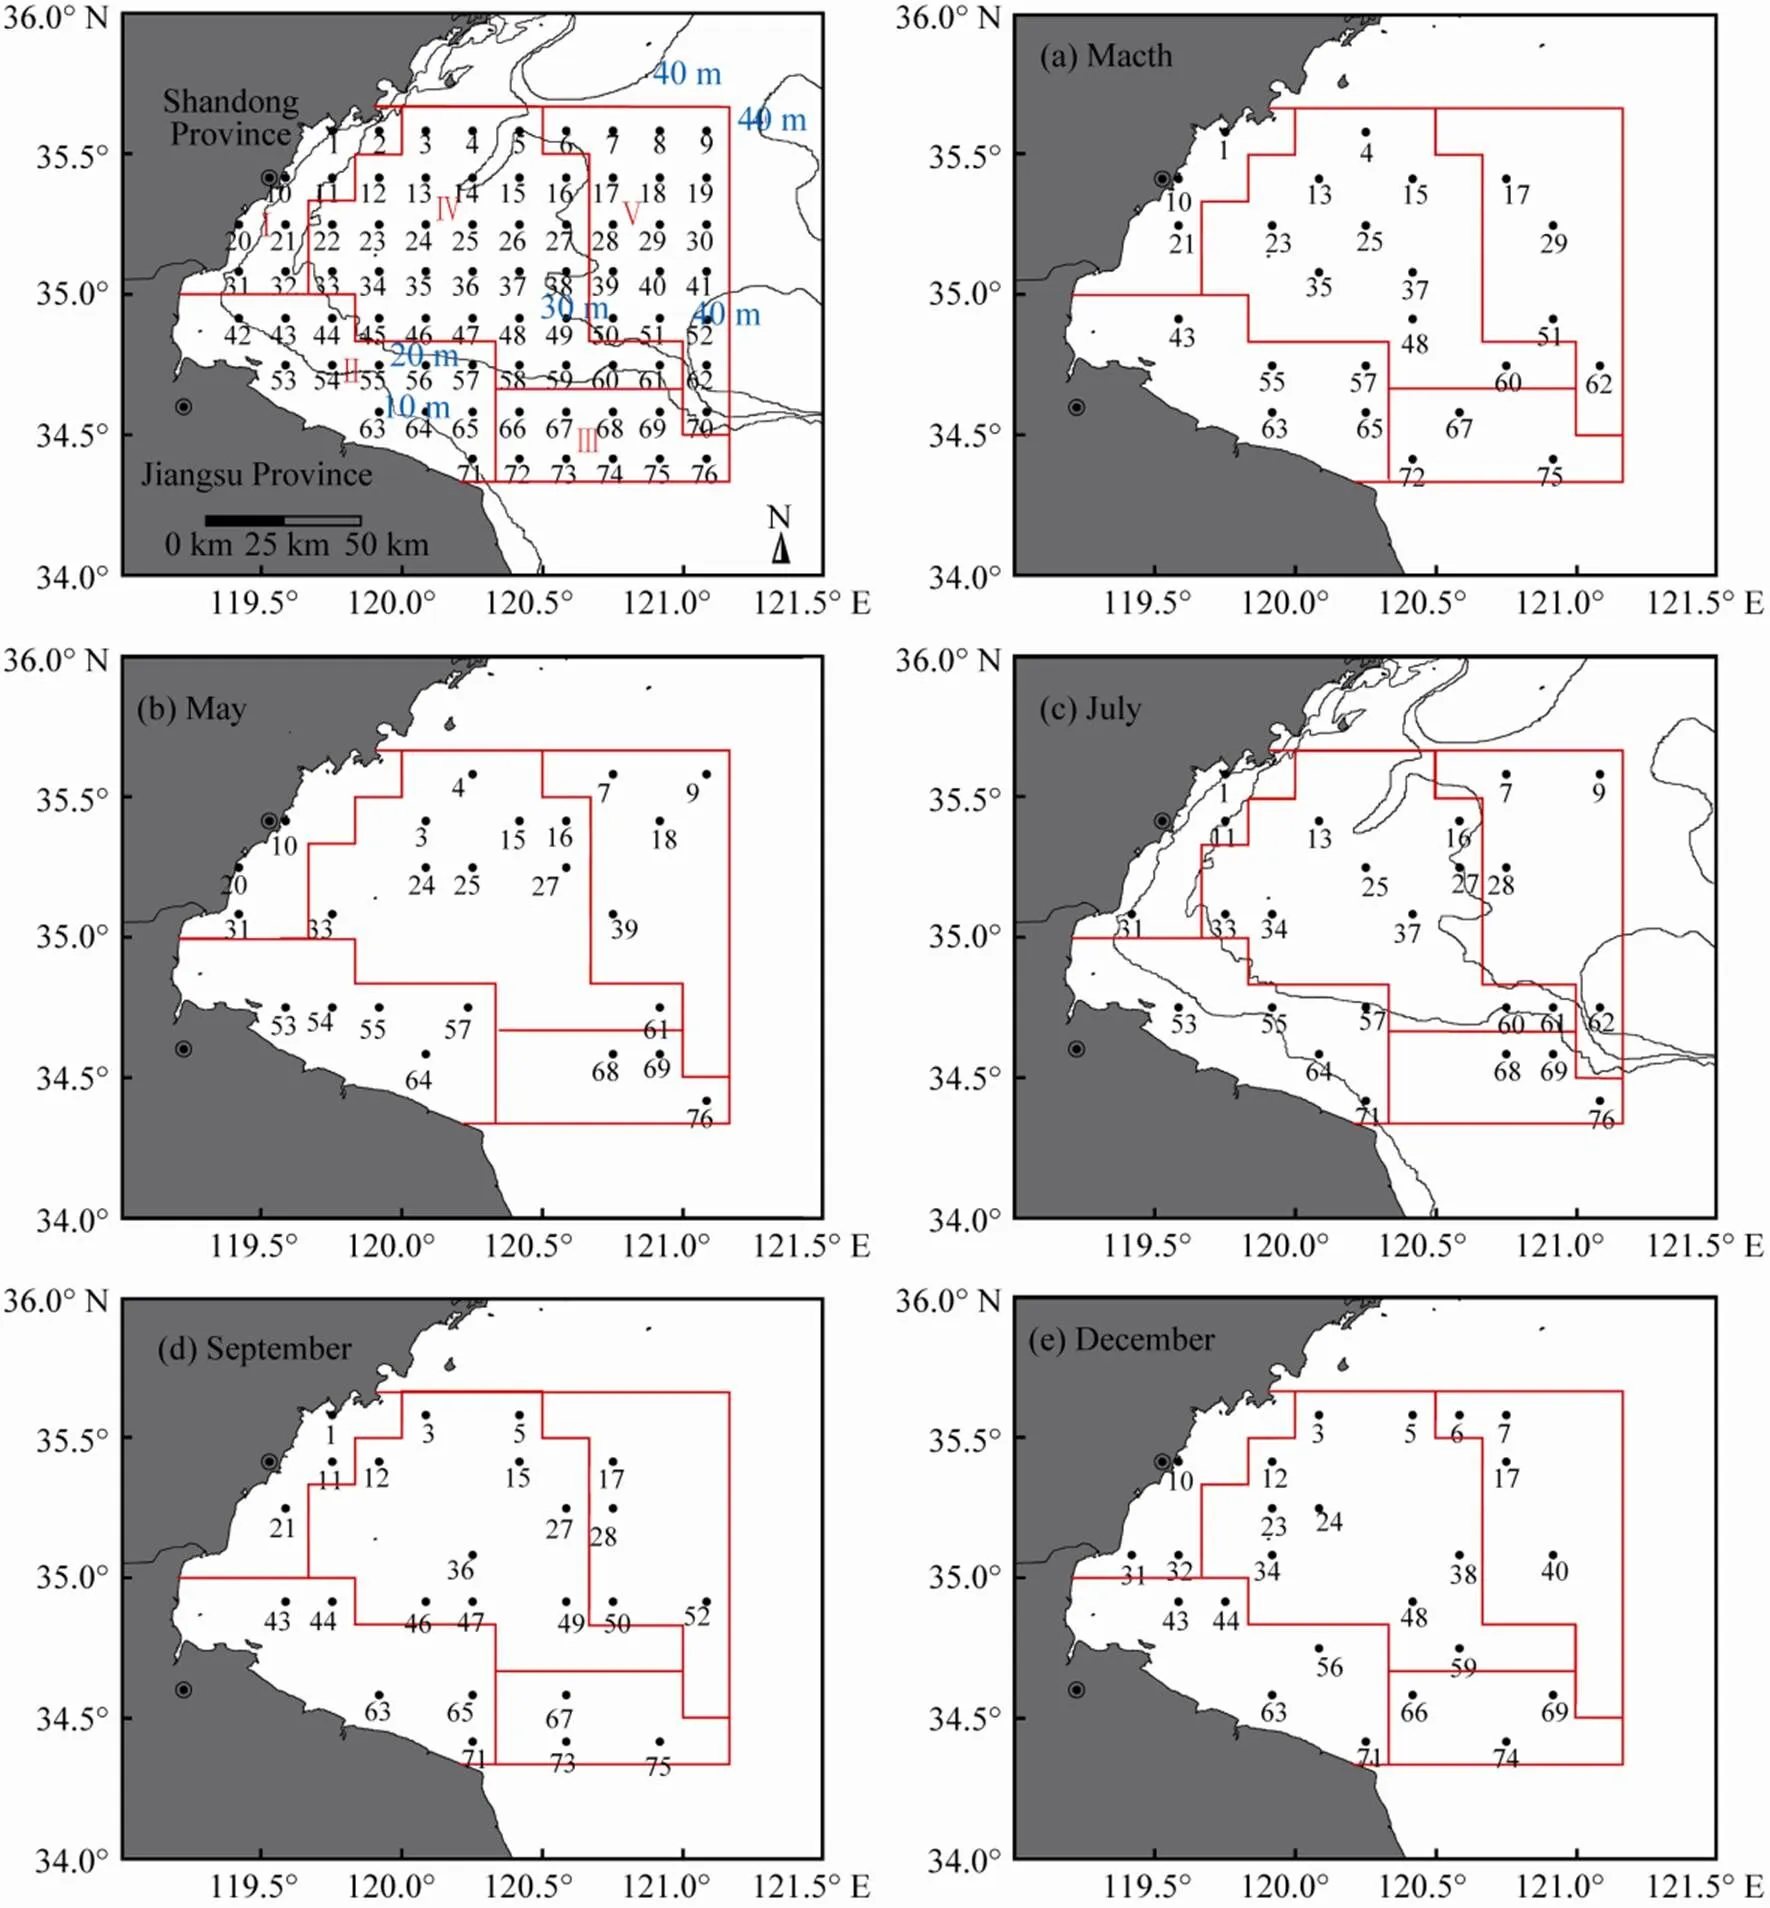
Fig.2 Different regions and all design stations. Stratified random sampling (Chen et al., 2006) was used in our study. The study area was divided into five regions according to the depth and to the relative position. Samples were collected at 24 sampling stations that were randomly selected from a grid with 76 design stations placed at intervals of 10 nautical miles (1n.mi.=1.853km). The numbers of stations that were selected from different regions are different. Three stations were selected from 8 stations in region I, 5 from 12 in region II, 3 from 9 in region III, 9 from 29 in region IV, and 4 from 18 in region V.
A multivariate technique of numerical classification was used to examine the horizontal structure of the ichthyoplankton assemblage. Both the species and stations were classified into different groups. The data of ichthyoplankton that were collected in May and July were separately analyzed. Samples were clustered using the ranked Bray-Curtis index (Bray and Curtis, 1957) according to ichthyoplankton densities at each station. Rare taxa with an occurrence frequency less than 2% were eliminated from the analysis. The data were transformed using the log(+1) function to enhance the contribution of the less abundant species. The relationship between fish egg and larvae abundance and environmental variables (longitude, latitude, depth, SST and SSS) was explored using the Spearman’s rank correlation (Rodriguez., 2009).
Horizontal profiles of SST and SSS were constructed using the Surfer 8.01 software, with kriging (linear vario- gram model) as the gridding method. All the above univariate and multivariate statistical analyses were performed using the SPSS16.0 program, and hierarchical group-average linking using the PRIMER 5.1 program.
3 Results
3.1 Hydrographic Conditions
Contour maps of the surface temperature and the salinity revealed the principal mesoscale oceanographic features in Haizhou Bay (Figs.3 and 4). The surface temperature ranged between 5.15℃and 25.43℃, with the highest value in July. Overall, the surface temperature in March (mean value was 6.33℃) was lowest, and the surface temperatures in July (mean value was 23.00℃) and September (mean value was 22.33℃) were higher than in other months. The closer the distance to the shore, the higher the temperature was in May, July and September; however, the opposite occurred in March and December: the closer the distance to the shore, the lower the temperature. Surface temperature often changed significantly in the waters where the change of depth was great,., in Lunan Trough and Paleo depressions.
The salinity range was 29.54–32.49. The surface salinity near Lunan Trough waters was the lowest in March, May and July. Higher surface temperatures and lower surface salinity were found near the coast in May and July, showing the influence of land water from the various rivers along the coast. Significant differences were detected for surface temperature and salinity among the monthly measurements (Table 1).

Table 1 Average values for sea surface temperature (SST, ℃), sea surface salinity and ichthyoplankton abundance (ind. (10m2)−1)
Notes: F, ANOVA statistic. The standard deviation is given in parentheses.n.s.: Non-significant, *< 0.001;a, b, c: Homogenous groups from a posteriori multiple comparisons (SNK tests).
3.2 Taxonomic Composition and Abundance of Ichthyoplankton
In total, 40 taxa were retained, which represented 7825 eggs and 269 larvae that were collected in 110 plankton tows. Of the 35 classified taxa of fish eggs, belonging to 15 families, 28 were clearly identified to the genus or species level, 6 egg taxa were identified to the family level, and 1 egg taxon was unidentified. In total, 12 larval species were identified, which were distributed in 9 different families. Ten taxa were identified to the species level, 1 taxon was identified to the genus level, and 1 taxon was unidentified.

Fig.3 Egg abundances for all species recorded and contour plots of sea surface temperature (interval of 0.5℃) during the cruises. The symbol size is proportional to the egg abundance (ind./10m2).
The numbers of sampling sites without eggs were as follows: all sites in March, 6 in May, 1 in July, 6 in September and 15 in December (Fig.3). There were 21 species in May, and among these species,was the highest in percentage of quantity(58.64%).andhad the highest percentage (33.33%) of positive stations. Among the 20 species that were found in July,was the highest (60.04%) in percentage of quantity, andspphad the highest percentage (54.17%) of positive stations. There were only 6 and 3 species in September and December, respectively. In September,spp. had the highest percentage of quantity and the highest number of positive stations (76.25% and 35.71%, respectively) in September. In December, Ophichthyidae had the highest percentage of quantity and the highest number of positive stations (57.14% and 29.17%, respectively) (Table A2).
The numbers of sampling sites with larvae were 4 in March, 6 in May, 7 in July, only 2 in September and 5 in December (Fig.4). There was only 1 species in March;appeared in the southeast area.had the highest percentage of quantity (60%) among 5 species that generally occurred near the shore, with depths <20m in May. Only 1 species was found in September;occurred in the middle of the bay. Two species occurred in southern coastal waters with low salinity in December, andhad the highest quantity (98.00%) (Table A1).

Fig.4 Larva abundances for all species recorded and the surface distributions of salinity (interval of 0.2 units) during the cruises. The symbol size is proportional to the larval abundance (ind.(10m2)−1).
3.3 Classification of Ichthyoplankton Assemblages
Three groups of stations were defined for May at a 15% similarity level: near-shore, middle, and edge groups of stations (Fig.5). The near-shore stations that were less than 20m away were characterized by low salinities (31.15±0.31) and high temperatures (16.60±0.69℃). Samples in the middle bay group came from a region of strong horizontal temperature and salinity gradients in the middle of Haizhou Bay (Fig.5b). Salinities in the middle stations ranged 30.12–31.89 (31.50±0.66), and temperatures ranged 12.46–15.97℃ (13.94±1.40℃). The edge bay group of stations encompassed the outermost stations near the Lunan Trough and Paleo depressions with great changes in depth, where the highest salinity (31.69±0.20) and the lowest temperature (13.75±1.95℃) existed.

Fig.5 Relations between station clusters and egg assemblages for the late spring survey (May). Clustering of species and stations was performed using the Bray–Curtis similarity index (Bray and Curtis, 1957) and the group average linkage. The symbol size is proportional to the percentage of positive stations for each taxon in each group of stations (a). Mapping of the groups of stations as defined by the cluster analysis (b). Symbols indicate the membership to groups. NB: near-shore bay; MB: middle bay; EB: edge of bay group of stations; NBA: near-shore bay assemblage; MBA: middle bay assemblage; N/E-BA: near-shore/edge of bay assemblage.
The cluster analysis results of July were similar to the results of May. Three groups of stations were also defined for July at a 15% similarity level: near-shore, middle, and edge groups of stations (Fig.6). The near-shore stations, which were characterized by high salinities (31.07±0.30) and temperatures (23.40±1.10℃), were also in the region where the depth was less than 20 meters. The middle bay stations, which were closer to the near-shore than those in May, were also dispersed in the middle of Haizhou Bay, where the highest salinity (31.38) and the lowest temperature (20.12℃) center existed. Salinities ranged between 29.54 and 31.38 (30.74±0.62), and temperatures ranged between 20.12 and 25.43℃ (22.95±1.62℃). The edge bay group of stations lay outside the study area, where the depth was more than 30 meters. Salinity (30.44±0.51) for this group was the lowest, and the temperature (23.44±0.16℃) was the highest.
Two egg assemblages were defined for May, at 20% similarity level: near-shore and middle bay assemblages (Fig.5a). The middle bay assemblage was defined by,and unidentified species that generally occurred in the middle and northeast area of the bay with high salinity, low temperatures and sandy sediment. The remaining species were grouped in the near-shore bay assemblage, including,,,, Clupeidae,,and so on, which generally occurred in the near-shore area of the bay, with depths <20m and high temperatures. Due to their low relative abundance, some species, such as,,and, were not included in the cluster analysis.
During July, three larval assemblages were defined at 20% similarity level (Fig.6a):andoccurred in the middle/edge bay assemblage, occupying the edge bay and some of the middle bay groups of stations with high temperatures and low salinity., Ophichthyidae andspp. composed the middle bay assemblage, corresponding to the middle bay group with low temperatures and high salinity. The rest of the species principally occurred in the near-shore and middle of bay assemblages, with both high temperatures and salinity. Some species were not included in the cluster analysis due to their low abundance, such as,,and.

Fig.6 Relations between station clusters and egg assemblages for the late spring survey (July). Clustering of species and stations was performed using the Bray-Curtis similarity index (Bray and Curtis, 1957) and the group average linkage. The symbol size is proportional to the percentage of positive stations for each taxon in each group of stations (a). Mapping of the groups of stations as defined by the cluster analysis (b). Symbols indicate the membership to groups. NB: near-shore bay; MB: middle bay; EB: edge of bay group of stations; N/M-BA: near-shore/middle bay assemblage; MBA: middle bay assemblage; M/E-BA: middle/edge of bay assemblage.
In September and December, egg species were few, and their distribution was relatively concentrated. Species clustering that was used in September and December was consistent with those groups that were defined in May and July. Only one egg assemblage was defined in both September and December. The middle bay assemblage was defined by,,, Clupeidae,spp. and Ophi- chthyidae, and generally occurred in the middle area of the bay with high temperatures in September., Cynoglossidae and Ophichthyidae composed the middle bay assemblage that generally occurred in the middle and northeast areas of the bay with high temperatures in December.
Only 11 species of larvae were identified during the five cruises (Table A1). Species clustering that used larval abundance was consistent with those groups that were defined by egg assemblages. Two larvae assemblages were defined near-shore and near-shore/middle bay assemblages. The near-shore/middle bay assemblage was defined by,,spp. and, and the rest of the species composed the near-shore bay assemblage.
The results of the correlation analysis indicated that the fish egg abundance was positively correlated with SST and depth, and larval abundance was negatively correlated with latitude, depth and SSS (Table 2).

Table 2 Spearman’s rank correlation coefficients between ichthyoplankton abundance and the environmental variables
Notes: SST,sea surface temperature; SSS, sea surface salinity.*<0.05;**<0.01.
4 Discussion
In the present study, 35 egg species and 12 larval species were identified, whereas approximately 20 egg taxa were identified by Jiang (1964) and 34 egg species and 19 larval species were identified by Wan and Jiang (1998) in Haizhou Bay. The egg and larval species composition has significantly changed over the past few decades in Haizhou Bay and its adjacent waters. This change most likely corresponds with the alteration of fishery resources, which are strongly affected by anthropogenic activities (Jin and Tang, 1996) and climate change (Lin., 1995; Lynam., 2013), such as the increases of sea water temperature related to the recent climate warming in northern China and the adjacent seas (Lin., 2005).
The egg abundance of some economic fish, such as,, and, has seriously declined and the fishery resources have been overexploited. As one of the most important demersal trawling fish in China,is widely distributed in the Bohai Sea, the Yellow Sea and the East China Sea, and its fishery has undergone a prosperous-decline-recovery chronological development in the past 50 years (Lin., 2008). Spawning grounds ofhave clearly expanded from the near-shore to offshore waters in recent years, and this expansion may be an ecological adaptation strategy to overfishing and environmental changes in nature (Lin., 2011). The ichthyoplankton of,,andwere not found in this survey, which is possibly due to the fewer cruises and the small study area.andhave almost disappeared, andis on the edge of extinction (Su., 2013). Althoughsupported an important fishery of the Yellow Sea in terms of biomass and was one of main spawning fish in the 1990s (Yao., 1989), this species may have disappeared because of increasing fishing pressure and climate change in the Yellow Sea. The egg abundances of some local fishes, such as,and, and some low economic fishes, such asandspp., increased significantly. Compared with 71.67% in the 1960s (Jiang, 1964) and 90.91% in the 1990s (Wan and Jiang, 1998), the proportion ofeggs (17.96% in May and 60.04% in July in our study) is in decline. As one of the small pelagic species,is considered as a key species in the Yellow Sea ecosystem (Huang., 2012). However, in the past two decades, its stock has experienced three stages: under-exploitation, full development and over- exploitation (Xu and Jin, 2005), which tends to cause smaller body length in its community structure and has presumably changed the nutrient cycle in food webs of the Yellow Sea (Huang., 2012).
The NBA was primarily found in near-shore waters with depths <20m only during the May cruise. This group was generally composed of neritic water species, includingand, whose main spawning grounds lie in this bay (Zhao and Zhang, 1985; Chen, 1991).,,and(not included in the analysis due to its small number) most likely have the same reproductive strategy (Zhao and Zhang, 1985; Wan and Jiang, 1998) and belong to the NBA. Our study shows that most of this assemblage is composed of migrant species, which feed and spawn in coastal waters and overwinter in the offshore waters. The river inflow and its influence on the continental shelf front may play a major role in structuring the ichthyoplankton community in the NBA, because they are always the most important factors that regulate the survival and recruitment of ichthyoplankton (Grimes, 2001; Espinosa-Fuentes and Flores-Coto, 2004; Chícharo., 2012). Furthermore, tide-induced residual currents and wind-driven currents tend to reverse river drainage, which enhances the residence time of diluted waters in this region with depths <20m (Wang, 2010), and generate a more retentive environment that may minimize advective losses of ichthyoplankton to the adjacent waters.
The MBA was characterized by the finding that most of its taxa corresponded to organisms that live in oceanic waters in their adult stage, such as,,, as well as Ophichthyidae (Table A2). It is composed of ocean water species () and deep water species () that feed and spawn in the offshore waters with depths above 20m in Haizhou Bay. It has been confirmed that both the current and the cold water mass (Wan., 2008; Hüssy., 2012; Basilone., 2013; Bonanno., 2013) are the main source of environmental variability in structuring the anchovy spawning ground by its influence on both the oceanography and distribution of anchovy eggs. In this study, eggs ofoccurred mainly along the front region of the YSCWM, particularly near the 35˚N section, which is controlled by the YSCC.is a cold-temperate and demersal species, and its peak spawning season is between mid-April and early June, with a short migration between shallow waters and deep water (Jiang, 1980). According to Lin (1965),primarily spawned in the north area of 35˚N; however, Wan and Jiang (1998) stated that this species was not only in the north area of 35˚N, but also in the deep waters of other areas (33˚–35˚N, 123˚–125˚E). Our study suggests that eggs ofare primarily distributed in the area with a depth greater than 20m, which is mostly occupied by the YSCWM (Quan., 2013), with clayey sediment and mixed sediment in the middle of Haizhou Bay (Lin, 1989). These data indicate that the temporal and spatial patterns of oceanographic features (., the YSCWM, the YSCC and the types of sediment) could facilitate egg retention and subsequent larvae growth, thereby affect the population dynamics of fisheries. Some species, such as, have not been included in the cluster analysis. We include these species with the MBA based on their distribution.
From May to July, both the NBA and the MBA extended toward the middle and the edge of the bay, and two closely related assemblages were defined in July: N/M-BA and M/E-BA. N/M-BA was composed of,and, which principally occupied the near-shore and the middle of the bay, and M/E-BA was defined byand, which occupied the edge bay and some of the middle bay groups of stations (Fig.6), with this assemblage most likely extending offshore outside the study area. The area occupied by the NBA and the MBA varied between sampling times, depending on the following bay dynamics: the extension of land water into the marine environment, the shifting of the YSCWM, and fish spawning areas and periods. Fluvial discharge from the Guanhe River, the Linhong River, the Xiuzhen River and so on, results in the formation of a brackish and nutrient-rich front that extends into the oceanic area. During the spring period, when the discharge of the rivers is less than in summer in the Huang-Huai-Hai Plain of China (Zhu, 1987), the area that is occupied by the NBA extended nearly to the 20m isobath (Fig.5b). During the summer cruise, the closely related assemblage, N/M-BA, occupied a wider area that extended toward the middle of the bay. The oceanic front plays an essential role in the convergence and retention processes of ichthyoplankton, determining their spatial heterogeneity and dynamics before the ichthyoplankton become older, stop their passive drift and migrate to nurseries (Rodriguez., 2009). As the YSCWM spread with an eastward shift to the central area of the Yellow Sea trough (Quan., 2013), both the NBA and the MBA extended toward deep waters. This result indicates how fish populations adjust their reproductive tactics to local conditions (bay dynamics in this case) within the constraint of a general reproductive strategy.
The position of the thermocline is an important factor that regulates the distribution of larval fishes, and the stratification of the water column is usually related to low fish larvae density (Smith and Suthers, 1999). In our study, only two larvae assemblages (near-shore and near- shore/middle bay assemblages) were defined. The low larvae densities were recorded in the middle of Haizhou Bay, where the thermocline is strong in summer and descends to deep-lying waters during autumn (Wan., 2009). However, some species,.,,,andspp., occurred in the entire water column, crossing the thermocline. It appears that the spawning strategy of fish is adapted to local conditions (., depth, surface temperature and oceanic fronts), so that the young larvae are transported to water masses for greater production (Ospina-Alvarez., 2012; Lynam., 2013).
Notably, some species were grouped in different assemblages in different months, such asspp, Clupeidae and Cynoglossidae, most likely because these assemblages were composed of more than one species, and these eggs could not be distinguished due to the lack of relevant literature. For example, three species that spawn in Haizhou Bay belong tospp,,and(Zhang., 1955).
Most of the larvae that were found in our study originate from pelagic eggs. Only a few of the teleosts breeding within our study area were spawned from demersal eggs or had parental care (and). The results of the Spearman’s rank correlation analysis indicated that both fish egg and larval abundance were positively correlated with depth, suggesting that the topography, which is critical to the oceanographic features in the southwestern Yellow Sea (Wang, 2010), may play a determinant role in delimiting the near-shore and middle bay assemblages.
In conclusion, this work represents a first attempt to study the multi-species ichthyoplankton assemblages in relation to the multi-environmental variables in Haizhou Bay. The result indicates that the eggs and larvae composition has significantly changed over the last few decades in Haizhou Bay and its adjacent waters. This change most likely corresponds with the alteration of fishery resources, which are strongly affected by anthropogenic activities (., anthropogenic) and climate change (., increases in sea water temperatures). Moreover, the marked spatial heterogeneity in the distribution of fish eggs and larvae was observed in our study area. This heterogeneity seems to be related to the interactions between behavioral traits (., spawning site selection by adults and vertical migrations of larvae) and oceanographic features (., depth, oceanic fronts, currents, water masses and the types of sediment), which allow fishes to take advantage of a food- rich environment for their early life stages. Seasonal variation patterns of ichthyoplankton assemblages show how fish populations adjust their reproductive tactics to local conditions within the constraint of a general reproductive strategy. In this study, bay dynamics is the most important environmental condition, including the discharge of land water into the marine environment, the shifting of the cold water mass, and the changing fish spawning areas and periods.
Acknowledgements
This study was supported by the Fundamental Research Funds for the Central Universities (No. 201022001, 201262004), the Public Science and Technology Research Funds Projects of Ocean (No. 201305030), and the Specialized Research Fund for the Doctoral Program of Higher Education (No. 20120132130001). We greatly appreciate the captain, the chief engineer, the crew and our colleagues for their support in collecting samples. The authors also thank the anonymous reviewers, whose comments have improved the manuscript.
Basilone, G., Bonanno, A., Patti, B., Mazzola, S., Barra, M., Cuttitta, A., McBride, R., 2013. Spawning site selection by European anchovy () in relation to oceanographic conditions in the Strait of Sicily., 22: 309-323.
Bonanno, A., Zgozi, S., Cuttitta, A., El Turki, A., Di Nieri, A., Ghmati, H., Basilone, G., Aronica, S., Hamza, M., Barra, M., 2013. Influence of environmental variability on anchovy early life stages () in two different areas of the Central Mediterranean Sea., 701: 273-287.
Bray, J. R., and Curtis, J. T., 1957. An ordination of the upland forest communities of southern Wisconsin.,27: 325-349.
Chen, Y., Sherman, S., Wilson, C., Sowles, J., and Kanaiwa, M., 2006. A comparison of two fishery-independent survey programs used to define the population structure of American lobster () in the Gulf of Maine., 104: 247-255.
Chícharo, M. A., Amaral, A., Faria, A., Morais, P., Mendes, C., Piló, D., Ben-Hamadou, R., and Chícharo, L., 2012. Are tidal lagoons ecologically relevant to larval recruitment of small pelagic fish? An approach using nutritional condition and growth rate., 112: 265- 279.
Espinosa-Fuentes, M. L., and Flores-Coto, C., 2004. Cross-shelf and vertical structure of ichthyoplankton assemblages in continental shelf waters of the Southern Gulf of Mexico., 59: 333-352.
Grimes, C. B., 2001. Fishery production and the Mississippi River discharge., 26: 17-26.
Hinckley, S., Hermann, A. J., Mier, K. L., and Megrey, B. A., 2001. Importance of spawning location and timing to successful transport to nursery areas: A simulation study of Gulf of Alaska walleye pollock., 58: 1042-1052.
Huang, L., Wu, Y., Wan, R., and Zhang, J., 2012. Carbon, nitrogen and phosphorus stoichiometry in Japanese anchovy () from the Huanghai Sea, China., 31: 154-161.
Hüssy, K., Hinrichsen, H. H., and Huwer, B., 2012. Hydrographic influence on the spawning habitat suitability of western Baltic cod ()., 69 (10): 1736-1743.
Isari, S., Fragopoulu, N., and Somarakis, S., 2008. Interranual variability in horizontal patterns of larval fish assemblages in the northeastern Aegean Sea (eastern Mediterranean) during early summer., 79: 607- 619.
Jin, X., and Tang, Q., 1996. Changes in fish species diversity and dominant species composition in the Yellow Sea., 26: 337-352.
Johnston, I.A., Vieira, V., and Temple, G. K., 2001. Functional consequences and population differences in the developmental plasticity of muscle to temperature in Atlantic herring., 213: 285- 300.
Leis, J.M., 2007. Behaviour as input for modelling dispersal of fish larvae: behaviour, biogeography, hydrodynamics, ontogeny, physiology and phylogeny meet hydrography., 347: 185-193.
Lin, C., Ning, X., Su, J., Lin, Y., and Xu, B., 2005. Environmental changes and the responses of the ecosystems of the Yellow Sea during 1976-2000., 55: 223-234.
Lin, C., Xu, B., and Huang, S., 1995. Long-term variations in the oceanic environment of the East China Sea and their influence on fisheries resources. In: Climate change and northern fish populations (Beamish, R. J., ed.)., 121: 307-315.
Lin, L., Liu, Z., Jiang, Y., Huang, W., and Gao, T., 2011. Current status of small yellow croaker resources in the southern Yellow Sea and the East China Sea., 29: 547-555.
Lynam, C. P., Halliday, N. C., Höffle, H., Wright, P. J., van Damme, C. J., Edwards, M., and Pitois, S.G., 2013. Spatial patterns and trends in abundance of larval sandeels in the North Sea: 1950–2005., 70: 540-553.
Oh, K., Lee, S., Song, K., Lie, H., and Kim, Y., 2013. The temporal and spatial variability of the Yellow Sea Cold Water Mass in the southeastern Yellow Sea, 2009–2011., 32: 1-10.
Okiyama, M., 1988.. Tokai University Publisher, Tokyo, 1154pp.
Ospina-Alvarez, A., Parada, C., Palomera, I., 2012. Vertical migration effects on the dispersion and recruitment of European anchovy larvae: From spawning to nursery areas., 231: 65-79.
Pattrick, P., Strydom, N.A., 2008. Composition, abundance, distribution and seasonality of larval fishes in the shallow nearshore of the proposed Greater Addo Marine Reserve, Algoa Bay, South Africa., 79: 251-262.
Quan, Q., Mao, X., Yang, X., Hu, Y., Zhang, H., Jiang, W., 2013. Seasonal variations of several main water masses in the southern Yellow Sea and East China Sea in 2011., 12: 524-536.
Rodriguez, J. M., Gonzalez-Nuevo, G., Gonzalez-Pola, C., and Cabal, J., 2009. The ichthyoplankton assemblage and the environmental variables off the NW and N Iberian Peninsula coasts, in early spring., 29: 1145- 1156.
Rodriguez, J.M., Moyano, M., and Hernandez-Leon, S., 2009. The ichthyoplankton assemblage of the Canaries-African Coastal Transition Zone: A review., 83: 314-321.
Sánchez-Velasco, L., Valdez-Holguın, J. E., Shirasago, B., Cisneros-Mata, M. A., and Zarate, A., 2002. Changes in the Spawning Environment ofin the Gulf of California during El Niño 1997–1998. Estuarine,, 54: 207-217.
Shao, K. T., Yang, J. S., Chen, K. C., and Lee, Y. S., 2001. An identification guide of marine fish eggs from Taiwan. Institute of Zoology, Academia Sinica, Taipei, 179pp.
Smith, K. A., and Suthers, I. M., 1999. Displacement of diverse ichthyoplankton assemblages by a coastal upwelling event on the Sydney shelf., 176: 49- 62.
Wan, R., Zhou, F., Shan, X., and Sun, S., 2010. Impacts of variability of habitat factors on species composition of ichthyoplankton and distribution of fish spawning ground in the Changjiang River estuary and its adjacent waters., 30: 155-165.
Wang, H., Sun, W., and Zhou, X., 2013. Application of a self adaptive method to the simulation of the tidal front in the Huanghai Sea., 32: 34-41.
Xu, B., and Jin, X., 2005. Variations in fish community structure during winter in the southern Yellow Sea over the period 1985–2002., 71: 79-91.
Chen, D., 1991.. Ocean Press, Beijing, 505pp.
Jiang, Y., 1964. Distribution of economic fish eggs in Haizhou Bay spawning., 18 (5): 100-111.
Jiang, Y., 1980. The early life history of plaice,(Schmidt)., (1): 105- 113.
Lin, J., 1965. A preliminary study on distribution and migratory of ten kinds of flatfish in Yellow Sea and Bohai Sea., 19: 56-86.
Lin, L., Cheng, J., Jiang, Y., Yuan, X., Li, J., and Gao, T., 2008. Spatial distribution and environmental characteristics of the spawning grounds of small yellow croaker in the southern Yellow Sea and the East China Sea., 28: 3485-3496.
Lin, M., 1989. The submarine geomorphological zones and geomorphological types in the Huanghai Sea., 6: 7-15.
Su, W., Xue, Y., and Ren, Y., 2013. Temporal and spatial variation in taxonomic diversity of fish in Haizhou Bay: The effect of environmental factors., 20: 624-634.
Tang, F., Shen, X., and Wang, Y., 2011. Dynamics of fisheries resources near Haizhou Bay waters., 30: 60-65.
Tang, Q., and Ye, M., 1990.. China Agriculture Press, Beijing, 214pp.
Wan, R., and Jiang, Y., 1998. Studies on the ecology of eggs and larvae of Osteichthyes in the Yellow Sea., 19: 60-73.
Wan, R., Wei, H., Sun, S., and Zhao, X., 2008. Spawning ecology of the anchovyin the spawning ground of the Southern Shandong PeninsulaⅠ.Abundance and distribution characters of anchovy eggs and larvae., 54: 785-797.
Wan, R., Zhao, X., and Wei, H., 2009. Function of thermocline for vertical distribution of anchovy eggs in the spawning ground of the southern waters to Shandong Peninsula., 29 (12): 6818-6826.
Wang, B., 2010. The influence of topography on the circulation in the Southwestern Yellow Sea. Master thesis. Chinese Academy of Sciences, 45pp.
Yao, S., Li, F., and Wang, Q., 1989. Study on the population of(T. Ets.) in Yellow Sea region., 13: 215-219.
Zhang, C., Cheng, Q., Zheng, B., Li, S., Zheng, W., and Wang, W., 1955.. Science Press, Beijing, 353pp.
Zhao, B., 1987a. A preliminary study of continental shelf fronts in the western part of southern Huanghai Sea and circulation structure in the front region of the Huanghai Sea Cold Water Mass (HSCWM)., 18: 218- 226.
Zhao, B., 1987b. The continental shelf fronts induced by tidal mixing in the Huanghai Sea., 5: 16-23.
Zhao, B., Limeberner, R., Hu, D., and Cui, M., 1991. Oceanographic characterisics of the southern Yellow Sea and the northern East China Sea in summer., 22: 132-139.
Zhao, C., and Zhang, R., 1985.. Shanghai Scientific and Technical Publishers, Shanghai, 182pp.
Zhu, Y., 1987. The hydrogeology character and the evaluation of ground water resources in Huang-Huai-Hai Plain., 6: 125-129.
(Edited by Qiu Yantao)
Appendix A
Table A1 Larval catch composition recorded in Haizhou Bay, 2011

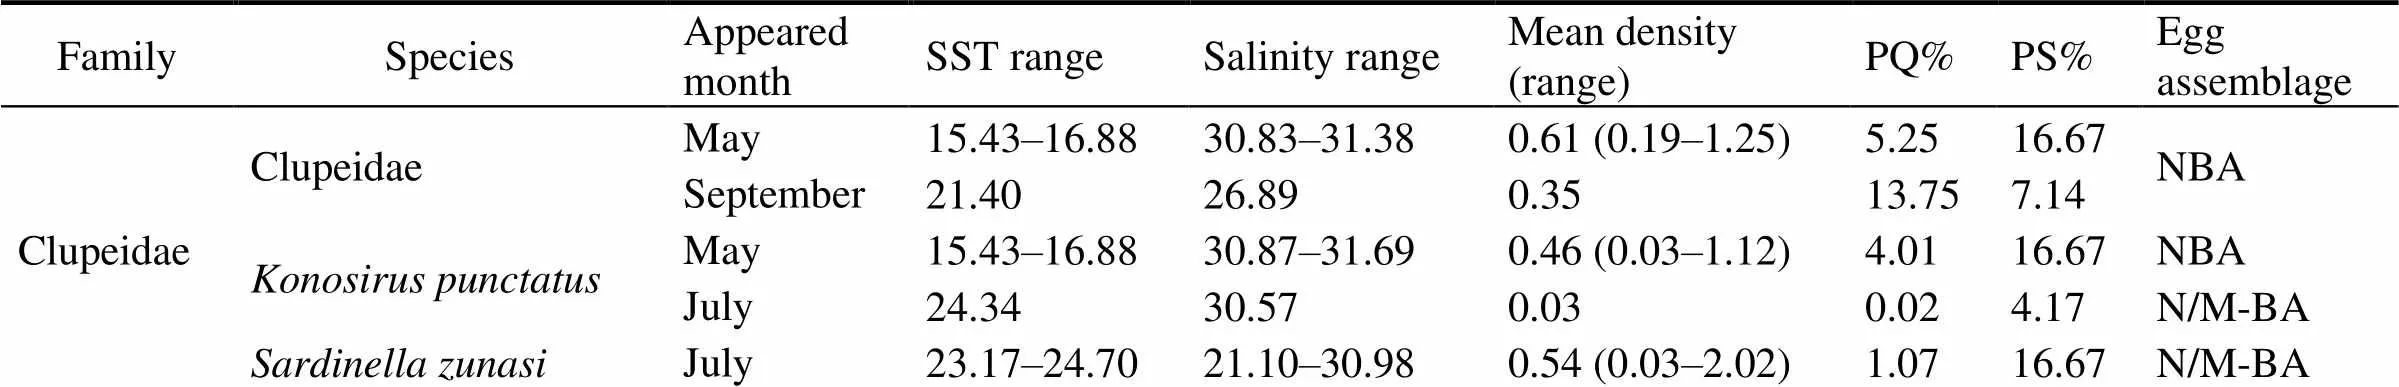
FamilySpeciesAppearedmonthSST rangeSalinity rangeMean density(range)PQ%PS%Larvalassemblage ClupeidaeKonosirus punctatusMay16.8830.95–31.310.05 (0.03–0.06)6.008.33NBA Engraulidae Engraulis japonicusJuly22.91–25.4329.54–30.801.07(0.03–3.33)91.7816.67N/M-BA Stolephorus commersonniiJuly23.1730.980.102.054.17NBA Synodontidae Saurida elongataDecember7.88–11.0727.69–30.710.41 (0.03–0.99)98.0020.83NBA CallionymidaeCallionymus spp.May16.51–17.6930.85–31.690.07 (0.03–0.16)14.0012.50N/M-BA July22.9130.340.061.374.17 PholidaePholis fangiMarch6.39–6.8731.08–31.950.03100.0016.67N/M-BA SciaenidaeCollichthys lucidusMay16.6431.060.106.004.17NBA July23.1730.980.030.684.17 Johnius belengeriJuly23.17–23.3830.98–31.310.08 (0.06–0.10)3.428.33NBA CynoglossidaeCynoglossus joyneriJuly24.4831.060.030.684.17NBA PlatycephalidaePlatycephalus indicusMay16.51–17.6830.85–31.380.32 (0.03–0.87)60.0012.50NBA SyngnathidaeSyngnathus acusMay16.64–16.8831.06–31.310.11 (0.10–0.13)14.008.33N/M-BA September22.56-22.8730.78–60.900.04 (0.03–0.06)100.0021.43 Unidentified spp.December9.6429.750.032.004.17NBA
Notes: Mean density in number per 10 m2. PQ (%), percentage of quantity; PS (%), percentage of positive stations; NBA, near-shore bay assemblage; N/M-BA, near-shore/middle of bay assemblage; N/E-BA, near-shore/edge of bay assemblage.
Table A2 Egg catch composition recorded in Haizhou Bay, 2011
FamilySpeciesAppearedmonthSST rangeSalinity rangeMean density(range)PQ%PS%Eggassemblage ClupeidaeClupeidaeMay15.43–16.8830.83–31.380.61 (0.19–1.25)5.2516.67NBA September21.4026.890.3513.757.14 Konosirus punctatusMay15.43–16.8830.87–31.690.46 (0.03–1.12)4.0116.67NBA July 24.3430.570.030.024.17N/M-BA Sardinella zunasiJuly 23.17–24.7021.10–30.980.54 (0.03–2.02)1.0716.67N/M-BA

FamilySpeciesAppearedmonthSST rangeSalinity rangeMean density(range)PQ%PS%Eggassemblage EngraulidaeEngraulidae May16.5131.380.190.414.17NBA Coilia mystusJuly 17.5428.420.160.084.17N/MBA Engraulis japonicusMay12.46–16.5930.12–31.891.04 (0.03–5.51)17.9633.33MBA July 22.91–25.4322.45–30.8040.22 (0.22–120.03)60.0412.50M/E-BA Setipinna taty July 22.60–24.3430.57–31.380.09 (0.03–0.29)0.2220.83N/M-BA Stolephorus commersonniiJuly 21.47–24.7021.10–31.442.96 (0.06–16.06)10.3229.17N/M-BA Thryssa kammalensisJuly 24.4821.100.190.104.17N/M-BA Thryssa mystaxJuly 21.55–23.5530.08–30.860.66 (0.16–1.15)0.658.33MBA SynodontidaeSaurida elongataJuly 20.60–24.6929.54–31.950.20 (0.03–0.64)0.8033.33MBA September22.06–22.1331.01–31.060.05 (0.03–0.06)3.7514.29 OphichthyidaeOphichthyidaeJuly 21.84–24.6929.54–31.380.63 (0.06–1.44)0.9412.50MBA September22.8131.000.031.257.14 December11.27–13.0830.93–32.490.07 (0.03–0.22)57.1429.17 MugilidaeChelon haematocheilusMay15.43–16.8830.87–30.950.13 (0.03–0.22)0.558.33NBA ApogonidaeApogon lineatusJuly 21.84–27.3322.45–31.380.32 (0.03–0.93)0.9425.00N/M-BA CallionymidaeCallionymus spp.May15.43–17.6830.85–31.380.29 (0.03–0.96)2.4916.67NBA July 20.12–27.3322.45–31.950.40 (0.03–1.67)2.6254.17MBA September22.13–22.8730.78–31.070.33 (0.06–1.03)76.2535.71 SciaenidaeArgyrosomus argentatusMay16.5131.380.641.384.17MBA July 21.84–23.9830.67–30.810.49 (0.03–1.41)0.7312.50M/E-BA Collichthys lucidusMay15.92–16.5131.38–31.480.40 (0.03–0.77)1.738.33NBA Johnius belangeriiJuly 21.55–24.7021.10–31.383.48 (0.03–21.35)15.5737.50N/M-BA September22.7831.070.031.257.14MBA Nibea albifloraMay16.59–16.8830.95–31.690.10 (0.06–0.13)0.418.33NBA July 23.3831.310.030.024.17N/M-BA Pseudosciaena polyactisMay15.97–16.8831.03–31.790.26 (0.03–0.90)2.2116.67NBA ScombridaeScomberomorus niphoniusMay12.16–16.8831.31–31.870.09 (0.03–0.26)0.9720.83NBA July 23.10–27.3322.45–31.380.04 (0.03–0.06)0.0612.50N/M-BA SillaginidaeSillago sihamaJuly 23.10–23.1730.98–31.380.22 (0.03–0.42)0.228.33N/M-BA StromateidaePampus argenteusMay16.51–16.5931.38–31.690.05 (0.03–0.06)0.218.33NBA TrichiuridaeEupleurogrammus muticusJuly 23.18–24.3430.08–31.040.29 (0.03–0.80)0.4312.50N/M-BA Trichiurus haumelaJuly 20.12–24.7030.88–31.310.15 (0.03–0.29)0.3016.67N/M-BA September22.06–22.8130.79–31.060.03 (0.03–0.03)3.7521.43MBA CynoglossidaeCynoglossidaeMay12.16–16.5131.38–31.720.03 (0.03–0.03)0.148.33NBA December13.0831.080.033.574.17 Cynoglossus abbreviatusMay16.5131.380.100.214.17NBA Cynoglossus joyneriMay16.5131.380.060.144.17NBA July 21.47–27.3321.10–31.440.89 (0.03–3.49)4.8745.83N/M-BA ParalichthyidaeCleisthenes herzensteiniMay12.46–15.4330.12–31.923.77 (0.03–8.24)56.8429.17MBA Kareius bicoloratusDecember11.27–13.0830.93–32.490.06 (0.03–0.13)39.2925.00MBA SoleidaeZebrias zebraMay24.7030.880.060.144.17NBA PlatycephalidaePlatycephalus indicusMay12.89–17.6830.85–31.810.25 (0.03–1.19)4.9033.33NBA Unidentified spp.May13.0631.840.030.074.17MBA
Notes: Mean density in number per 10m2. PQ (%), percentage of quantity; PS (%), percentage of positive stations; NBA: near-shore bay assemblage; N/M-BA: near-shore/middle bay assemblage; MBA, middle bay assemblage; M/E-BA, middle/edge of bay assemblage.
DOI 10.1007/s11802-015-2603-3
ISSN 1672-5182, 2015 14 (6): 1041-1052
© Ocean University of China, Science Press and Spring-Verlag Berlin Heidelberg 2015
(February 24, 2014; revised April 21, 2014; accepted August 20, 2015)
* Corresponding author. Tel: 0086-0532-82032605 E-mail: yechen@ouc.edu.cn
 Journal of Ocean University of China2015年6期
- Journal of Ocean University of China的其它文章
- Inversion Study on Pollutant Discharges in the Bohai Sea withthe Adjoint Method
- Different Responses of Sea Surface Temperature in the North Pacific to Greenhouse Gas and Aerosol Forcing
- The Change Features of the West Boundary Bifurcation Line of the North Equatorial Current in the Pacific
- Wave Pressure Acting on V-Shaped Floating Breakwater in Random Seas
- Dynamic Response of a Riser Under Excitation of Internal Waves
- An Effective Method of UV-Oxidation of Dissolved Organic Carbon in Natural Waters for Radiocarbon Analysis by Accelerator Mass Spectrometry