
Aerosol absorption optical depth of fine-mode mineral dust in eastern China
2016-11-23 01:12ZHANGTinHngndLIAOHong
ZHANG Tin-Hngnd LIAO Hong
aState Key Laboratory of Atmospheric Boundary Layer Physics and Atmospheric Chemistry (LAPC), Institute of Atmospheric Physics, Chinese Academy of Sciences, Beijing, China;bUniversity of Chinese Academy of Sciences, Beijing, China
Aerosol absorption optical depth of fine-mode mineral dust in eastern China
ZHANG Tian-Hanga,band LIAO Honga
aState Key Laboratory of Atmospheric Boundary Layer Physics and Atmospheric Chemistry (LAPC), Institute of Atmospheric Physics, Chinese Academy of Sciences, Beijing, China;bUniversity of Chinese Academy of Sciences, Beijing, China
The fine-mode aerosol absorption optical depth (AAOD) retrieved from the Aerosol Robotic Network(AERONET) has been used in previous studies to calculate the radiative forcing of black carbon (BC)aerosol, assuming that the absorption by fine-mode aerosols (diameter ≤ 1 μm) is primarily from BC while the absorption by larger particles (diameter > 1 μm) is principally from dust. In the present study, the Community Earth System Model was used to simulate and quantify the contribution of fine-mode dust to fine-mode AAOD in eastern China (29-41°N, 104-122°E)-an area where concentrations of BC are high. The simulated fine-mode dust concentrations were constrained by observations from nine sites belonging to the Chinese Meteorological Administration Atmosphere Watch Network. Averaged over eastern China, the simulated annual mean fine-mode dust AAOD was 3.6 × 10⁻³, with the maximum AAOD in spring and the minimum value in winter. The contribution of fine-mode dust to the total fine-mode AAOD (sum of fine-mode dust, BC, and organic carbon)in winter, spring, summer, and autumn was 3.4%, 25.2%, 12.5%, and 14.9%, respectively, with an annual mean value of 15.1%. The results indicate the importance of removing fine dust AAOD when the AERONET fine-mode AAOD is used for calculating the radiative forcing of BC in eastern China.
Fine-mode; mineral dust;AAOD; eastern China
由气溶胶自动观测网(AERONET)反演的细模态气溶胶的吸收光学厚度(AAOD)通常被认为是黑碳气溶胶的AAOD,并且通过这种方法得到的黑碳AAOD已经被用在计算黑碳辐射强迫的研究中。但是这种方法是基于如下假设:直径小于1 μm的细模态气溶胶和直径大于1 μm的粗模态气溶胶对光的吸收主要分别归功于黑碳和沙尘。为了定量描述细模态沙尘气溶胶对全部细模态气溶胶的AAOD的贡献,我们利用地球系统交互模式(CESM)模拟了中国东部(104-122°E, 29-41°N)细模态沙尘气溶胶的AAOD。其中,我们根据9个中国气象局大气观测网(CAWNET)站点观测的细模态沙尘地表浓度调整了模拟的细模态沙尘气溶胶的浓度。结果显示,模拟的中国东部年平均细模态沙尘气溶胶的AAOD的值为3.6 × 10⁻³,其中AAOD的最大和最小值分别出现在春季和冬季。细模态沙尘气溶胶对总的细模态气溶胶(细模态沙尘、黑碳和有机碳气溶胶的总和)的AAOD的贡献在春季、夏季、秋季和冬季分别为3.4%、25.2%、12.5%和14.9%,其年平均值为15.1%。这些结果显示当利用AERONET反演得到的细模态气溶胶的AAOD来计算中国东部BC气溶胶的辐射强迫时,去除细模态沙尘粒子的影响显得尤为重要。
1. Introduction
Aerosol absorption optical depth (AAOD) represents column aerosol light absorption and is a key parameter in evaluating aerosol radiative forcing (e.g. Huang et al. 2006; Park and Sohn 2010; Kirillova et al. 2014; Koike et al. 2014) and atmospheric heating (e.g. Lau et al. 2006;Xia et al. 2007; Huang et al. 2009). AAOD is calculated as(1-SSA) × AOD, where SSA and AOD are the column single scattering albedo and aerosol optical depth, respectively. Aerosol species that contribute to AAOD include mineral dust, black carbon (BC), and organic carbon (OC).
AAOD values have been retrieved by the Aerosol Robotic Network (AERONET) (Holben et al. 1998; Dubovik and King 2000), whose datasets provide fine-mode (diameter ≤ 1 μm) and coarse-mode (diameter > 1 μm) AAOD values. By analyzing AERONET datasets over specific regions,Dubovik et al. (2002) reported that fine-mode and coarsemode particles dominate over biomass-burning and desert regions, respectively. Bond et al. (2013) calculated the direct radiative forcing of BC by adjusting the median AAOD in the Aerosol Comparisons between Observations and Models to be consistent with the AERONET fine-mode retrieval. They obtained a global mean AAOD of 0.006.However, such an approach to derive the BC AAOD is positively biased because the AERONET AAOD includes absorption by BC, organic matter, and fine-mode dust(Bond et al. 2013).
Several previous studies have reported the AAOD of total aerosols (fine-mode plus coarse-mode) retrieved from AERONET in dusty weather in China (Yu et al. 2006;Yu et al. 2011; Yu et al. 2013). Yu et al. (2006) presented the average AOD and SSA on dusty days during 2001-2005 at 10 AERONET sites in East Asia. The AAOD values of all aerosol species at 675 nm averaged over four sites in China(Dunhuang, Yulin, Beijing, and Inner Mongolia), three sites in Korea (Gosan, Gwangju, and Anmyon), and three sites in Japan (Osaka, Shirahama, and Noto) were 0.061, 0.032, and 0.023, respectively. Similarly, Yu et al. (2013) showed that the average AAOD of all aerosol species calculated from the observed AOD and SSA from AERONET on dusty days in Beijing during 2001-2010 were 0.186 and 0.084 at 440 and 670 nm, respectively. These studies, however, did not examine the fine-mode dust AAOD.
Large uncertainties exist in simulations of emissions and concentrations of dust (Generoso et al. 2008; Johnson et al. 2012; Ridley et al. 2012). For example, global dust emissions were simulated to be in the range of 514-4313 Tg year-1(Textor et al. 2006; Huneeus et al. 2011). Cakmur et al. (2006) constrained the global emissions of clay dust particles (0.2 μm < diameter < 2 μm) in the ModelE version of NASA Goddard Institute for Space Studies atmospheric general circulation model by using observed AOD retrieved from AERONET, Advanced Very High Resolution Radiometer, and Total Ozone Mapping Spectrometer, as well as the volume particle size distribution retrieved from AERONET. A similar approach can be used to constrain the emissions of fine-mode dust, but it requires size-resolved observations of concentrations or optical properties of mineral dust.
The present study simulated the fine-mode dust AAOD in eastern China (29-41°N, 104-122°E)-where concentrations of BC are high-using the Community Earth System Model (CESM), to quantify the contribution of fine-mode dust to fine-mode AAOD. Section 2 describes the model and numerical experiments. Sections 3 and 4 present the simulated concentrations and fine-mode dust AAOD,respectively. Section 5 examines the contribution of finemode dust to the AAOD of total fine-mode aerosols.
2. Model description and numerical experiments
2.1. Mineral dust in the CESM model
The simulation of mineral dust aerosol was carried out using CESM, version 1.2.0 (http://www2.cesm.ucar.edu/),developed by National Center for Atmospheric Research. The model has a horizontal resolution of 1.9 × 2.5° and 30 vertical layers from the surface to 4 hPa. The simulation of dust in CESM has been described in Liu et al. (2012). The dust emission scheme follows the Dust Entrainment and Deposition Module (Zender 2003), which allows dust emissions over dry and non-vegetated regions with strong winds. Dust emissions are calculated online depending on the simulated meteorological parameters. The three-mode version of the modal aerosol module (MAM-3) scheme used in this work includes the Aitken, accumulation, and coarse modes. Therefore, the emissions of dust were allocated into the accumulation and coarse modes of MAM-3 with cut-off size ranges of 0.1-1.0 and 1.0-10 μm, respectively. Mineral dust was assumed to be internally-mixed with other aerosol species within a mode but externally-mixed with other modes. As described by Ghan and Zaveri (2007), the mass absorption coefficient for each mode at each model layer was calculated using Mie theory as a function of refractive index and the surface mode radius of wet aerosol particles. The AAOD for each mode was the integration of the absorption coefficient (product of mass concentration and mass absorption coefficient)over all model layers. The refractive index of dust in CESM 1.2.0 is 1.53-0.00627i at 550 nm, which was measured in Barbados by Volz (1973).
2.2. Constrained emissions of fine-mode dust
The simulated emissions of fine-mode dust were constrained using the observed annual mean dust concentrations over the two-year period of 2006-2007,averaged over nine sites of the Chinese Meteorological Administration Atmosphere Watch Network (CAWNET)(Zhang et al. 2012). Considering that fine-mode dust can be transported far away to downwind regions (e.g. Han et al. 2004; Chin et al. 2007; Fairlie et al. 2007), the nine sites in eastern China (Figure 1) were selected. Because the observed dust concentrations in Zhang et al. (2012) did not distinguish between fine- and coarse-mode fractions,a mass ratio of fine-mode dust to total dust of 18.2% was obtained by averaging the size-resolved dust concentrations measured during 18 dust events during 2004-2006 in Beijing (Wu et al. 2009). As a result, the emissions of fine-mode dust were calculated as:

Figure 1.Locations of the nine CAWNET sites (black dots) from which observed surface dust concentrations were used to constrain the simulated dust emissions. These nine CAWNET sites were: Gaolanshan (GLS) (36°0′N, 105°51′E); Gucheng (GC) (39°7.8′N, 115°48′E); XiAn(XA) (34°25.8′N, 108°58.2′E); Zhengzhou (ZZ) (34°46.8′N, 113°40.8′E); Taiyangshan (TYS) (29°10.2′N, 111°42.6′E); Jinsha (JS) (29°37.8′N,114°12′E); LinAn (LA) (30°18′N, 119°44′E); Dalian (DL) (38°54′N, 121°37.8′E); and Chengdu (CD) (30°39′N, 104°2.4′E). The mass ratio of fine to coarse dust was obtained from the size-resolved observations of dust at Beijing (BJ) (39°55′N, 116°24′E) (red star). Eastern China was defined as per the red rectangle (29-41°N, 104-122°E).
where Edefaultand Econstrainedare the simulated emissions of fine-mode dust before and after constraining, respectively, over all grid cells with dust emissions. Cmeasuredwas the measured annual mean surface dust concentration averaged of two years' (2006-2007) dust concentrations over the nine CAWNET sites (Zhang et al. 2012), and Csimulatedwas the simulated annual mean surface concentration of fine-mode dust averaged over the same CAWNET sites for the present day. Based on the measurements and model, the ratio of the measured to simulated annual mean surface concentration of fine-mode dust over the nine CAWNET sites was calculated to be 3.29.
2.3. Numerical simulations
CESM was run for six model years to simulate the finemode dust concentrations for the present day, with the initial conditions downloaded from https://svn-ccsm-inputdata.cgd.ucar.edu/trunk/inputdata. The first model year was treated as spin-up, and the model results from the last five years were analyzed.
3. Simulated concentrations of fine-mode dust
Figure 2a shows the simulated surface-layer concentrations of fine-mode dust in China. High concentrations of fine-mode dust were simulated over the northern border of China and western China. Over the Taklimakan and Gobi deserts, concentrations of fine-mode dust ranged between 250 and 350 μg m-3in March-April-May (MAM)and June-July-August (JJA), and between 100 and 250 μg m-3in September-October-November (SON) and December-January-February (DJF). Over eastern China(29-41°N, 104-122°E), the simulated surface-layer concentrations of fine-mode dust gradually decreased from the northwest to the southeast of the domain. Averaged over eastern China, the simulated surface-layer concentrations of fine-mode dust in DJF, MAM, JJA, and SON were 5.0, 31.6,14.2, and 24.1 μg m-3, respectively, with an annual mean value of 19.2 μg m-3. The seasonal distributions in column burdens of fine-mode dust generally reflected those in the surface-layer concentrations (Figure 2b). Note that over the Taklimakan desert the maximum burden occurred in JJA, while the maximum surface-layer concentration occurred in MAM, as a result of the stronger convection in JJA than in MAM. With the emissions of fine-mode dust over the Taklimakan desert simulated as slightly larger in JJA than in MAM, the stronger convection in JJA transported fine-mode dust to higher altitudes.
Figure 3 compares the simulated monthly variations in surface-layer fine-mode dust concentrations with the observations at the nine CAWNET sites in eastern China. Note that the observations from Zhang et al. (2012) were all multiplied by 18.2% to be consistent with the treatment described above. After constraining the emissions, the simulated surface-layer concentrations of fine-mode dust showed two peaks, in spring and autumn. The simulated peak in spring agreed well with observations at all sites, but the second observed peak occurred in different months during September-December. Bias between the monthly mean simulated and observed dust concentrations at aCAWNET site was calculated by normalized mean bias(NMB) defined as:
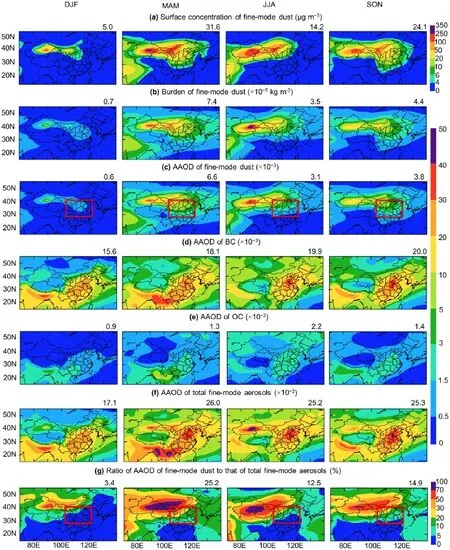
Figure 2.Simulated seasonal mean values of the (a) surface-layer concentrations (μg m-3) of fine-mode dust, (b) column burdens(×10-5kg m-2) of fine-mode dust, (c) AAOD (×10-3) of fine-mode dust, (d) AAOD (×10-3) of BC, (e) AAOD (×10-3) of OC, (f) AAOD (×10-3)of total fine-mode aerosols (sum of dust, BC, and OC), and (g) ratio (×10-2) of fine-mode dust AAOD to that of total fine-mode aerosols(%). Notes: Eastern China (29-41°N, 104-122°E) was defined as per the red rectangles in (c) and (g). The number in the top right-hand corner of each panel is the averaged value over eastern China.

Figure 3.Comparisons of observed and simulated surface-layer fine-mode dust concentrations (μg m-3) at the nine CAWNET sites. Simulated values before and after constraining the emissions both are shown. Notes: NMB1 and NMB2 represent the NMB between the observed and simulated dust concentrations before and after constraining, respectively. R is the correlation coefficient between the observed and simulated monthly dust concentrations after constraining.
where xiand yiwere the simulated and observed dust concentrations, and n represented 12 months. At the sites of XiAn, Zhengzhou, Taiyangshan, Jinsha, LinAn,Dalian, and Chengdu, the NMBs between the simulated and observed surface-layer fine-mode dust concentrations were in the range of -88.2% to -71.3%; whereas,after constraining, the range was -64.9% to -18.1%,indicating that the simulated fine-dust concentrations were improved after constraining at these sites, where BC concentrations were also high. However, at the two sites those were close to dust source regions (Gucheng and Gaolanshan), the NMBs increased from -25.8% and -58.7% to +107.2% and +12.4%, respectively, which can be explained by the fact that the constraining factor was the mean value over the nine sites. With all of the nine sites considered, the NMB increased from -69.2% to -11.9%. With emissions constrained, the correlation coefficients between the monthly simulated and observed fine-mode dust surface concentrations at the nine sites were in the range of +0.4 to +0.81.
4. Simulated fine-mode dust AAOD
Figure 2c shows the simulated fine-mode dust AAOD in China. Over the Taklimakan and Gobi deserts, the finemode dust AAOD reach 10 × 10-3, 40 × 10-3, 50 × 10-3,and 20 × 10-3in DJF, MAM, JJA, and SON, respectively. Over eastern China, the simulated fine-mode dust AAOD values are the highest in MAM, consistent with the highest concentrations and burdens of fine-dust in this season. Averaged over eastern China, simulated fine-mode dust AAOD are 0.6 × 10⁻³, 6.6 × 10⁻³, 3.1 × 10⁻³, and 3.8 × 10⁻³in DJF, MAM, JJA, and SON, respectively, with an annual mean value of 3.6 × 10⁻³. Our simulated annul mean fine-mode dust AAOD is smaller than the observed AAOD values of 6.1 × 10⁻³and 8.4 × 10⁻³of total aerosols in dusty days averaged over four sites in China (Dunhuang, Yulin, Beijing,and Inner-Mongolia) (Yu et al. 2006) and Beijing (Yu et al. 2013), respectively.
5. Contribution of fine-mode dust to the AAOD of total fine-mode aerosols
CESM can perform default simulations of mineral dust, BC,OC, sulfate, and sea-salt aerosols, as described by Liu et al.(2012), which allows us to examine the contribution of finemode dust to AAOD, as compared to all other aerosol types. Fine-mode absorbing aerosols (diameter ≤ 1 μm) in CESM include fine-mode dust, BC, and OC. Figures 2d and 2e present the AAOD of BC and OC simulated in CESM, respectively. Note that the simulation of BC and OC was based on the present day monthly anthropogenic and biomass-burning emissions from the Intergovernmental Panel on Climate Change Fifth Assessment Report emissions datasets(Lamarque et al. 2010). The AAOD values of BC and OC were high over polluted eastern China, with annual mean values of 18.6 × 10⁻³and 1.5 × 10⁻³, respectively. The spatial distributions of the total AAOD of fine-mode aerosols (sum of fine-mode dust, BC, and OC) (Figure 2f) indicate that finemode dust and BC dominate the AAOD of fine-mode aerosols in northwestern China and eastern China, respectively.
Figure 2g shows the ratios of fine-mode dust AAOD to that of all fine-mode aerosols. High ratios were simulated over the northern border of China and western China, corresponding to the high fine-mode dust AAOD. The ratios were high in the northwest corner of eastern China, at approximately 70%-100% in MAM, 50%-70% in JJA and SON, and 30%-50% in DJF. The ratios gradually reduced to less than 5% in the southeast corner of eastern China in all seasons. Averaged over eastern China, the ratios of fine-mode dust AAOD to that of all fine-mode aerosols were 3.4%, 25.2%,12.5%, and 14.9% in DJF, MAM, JJA, and SON, respectively,with an annual mean value of 15.1%. Similarly, the ratios of the AAOD of OC to that of all fine-mode aerosols (not shown)were 5.3%, 5.1%, 8.5%, and 5.7% in DJF, MAM, JJA, and SON,respectively, with an annual mean value of 6.2%. Therefore,if the fine-mode AAOD derived from AERONET is treated as BC AAOD, it would lead to an overestimation of BC AAOD of 21.3% (15.1% plus 6.2%) over eastern China, which would in turn lead to a considerable overestimation of the radiative forcing of BC in these regions.
It should be noted that the uncertainties in the simulated concentrations of BC and OC may influence the conclusion. For example, comparing the simulated surface-layer BC and OC concentrations in the present study with the observations of Zhang et al. (2012) indicates that CESM underestimated the BC and OC concentrations at the nine CAWNET sites in eastern China, with NMBs of 61.6% and 48.2%, respectively. Assuming that concentrations of BC and OC contribute linearly to AAOD, the annual mean AAOD of BC would increase from the value of 18.6 × 10⁻³in this work to 47.9 × 10⁻³, and that of OC would increase from 1.5 × 10⁻³to 2.8 × 10⁻³. Considering that fine-mode dust concentrations were underestimated by 11.9% after constraining emissions, the annual mean fine-mode dust AAOD would increase from 3.6 × 10⁻³to 4.1 × 10⁻³. As a result, the annual mean ratio of fine-mode dust AAOD to that of all fine-mode aerosols averaged over eastern China would decrease from 15.1% to 7.4%.
6. Conclusion
This study simulated the fine-mode dust AAOD in eastern China (29-41°N, 104-122°E) using CESM, version 1.2. The simulated emissions and concentrations of fine-mode dust were constrained using observations from nine CAWNET sites averaged over the twoyear period of 2006-2007. Using these measurement constraints, the simulated fine-mode dust concentrations averaged over eastern China in DJF, MAM, JJA,and SON were 5.0, 31.6, 14.2, and 24.1 μg m-3, respectively, with an annual mean value of 19.2 μg m-3. Considering all of the nine sites with dust measurements in eastern China, the NMB between the simulated and observed monthly mean surface-layer fine-mode dust concentrations was -11.9%, indicating that the model is able to capture the magnitude of fine-mode dust in eastern China.
The horizontal distribution of simulated fine-mode dust AAOD was similar to that of the column burden of finemode dust. Averaged over eastern China, the simulated annual mean fine-mode dust AAOD was 3.6 × 10⁻³. The contribution of fine-mode dust to the AAOD of total finemode aerosols was simulated to be 3.4%, 25.2%, 12.5%,and 14.9% in DJF, MAM, JJA, and SON, respectively, with an annual mean value of 15.1%.
The present results indicate that it is important to remove the contribution of fine-mode dust to AAOD when fine-mode AAOD derived from AERONET is used for the calculation of the radiative forcing of BC. However, it is important to note that this study was limited by the availability of mineral dust aerosol measurements. Simultaneous measurements of size-resolved mineral dust, BC, OC, and AAOD are required to estimate the contribution of finemode dust to the fine-mode AAOD of all aerosols more accurately.
Funding
This work was supported by the National Basic Research Program of China (973 Program, [grant number 2014CB441202])and the Strategic Priority Research Program of the Chinese Academy of Sciences [grant number XDA05100503].
References
Bond, T. C., S. J. Doherty, D. W. Fahey, P. M. Forster, T. Berntsen,B. J. DeAngelo, and M. G. Flanner, et al. 2013. “Bounding the Role of Black Carbon in the Climate System: A Scientific Assessment.” Journal of Geophysical Research 118 (11): 5380-5552. doi:10.1002/jgrd.50171.
Cakmur, R. V., R. L. Miller, J. Perlwitz, I. V. Geogdzhayev, P. Ginoux, D. Koch, K. E. Kohfeld, I. Tegen, and C. S. Zender. 2006. “Constraining the Magnitude of the Global Dust Cycle by Minimizing the Difference between a Model and Observations.” Journal of Geophysical Research 111 (D06207): doi:10.1029/2005JD005791.
Chin, M., T. Diehl, P. Ginoux, and W. Malm. 2007. “Intercontinental Transport of Pollution and Dust Aerosols: Implications for Regional Air Quality.” Atmospheric Chemistry and Physics 7(21): 5501-5517.
Dubovik, O., B. Holben, T. F. Eck, A. Smirnov, Y. J. Kaufman, M. D. King, D. Tanre, and I. Slutsker. 2002. “Variability of Absorption and Optical Properties of Key Aerosol Types Observed in Worldwide Locations.” Journal of the Atmospheric Sciences 59(3): 590-608. doi:10.1175/1520-0469(2002)059<0590:Voaao p>2.0.Co;2.
Dubovik, O., and M. D. King. 2000. “A Flexible Inversion Algorithm for Retrieval of Aerosol Optical Properties from Sun and Sky Radiance Measurements.” Journal of Geophysical Research 105 (D16): 20673-20696. doi:10.1029/2000JD900282.
Fairlie, T. D., D. J. Jacob, and R. J. Park. 2007. “The Impact of Transpacific Transport of Mineral Dust in the United States.”Atmospheric Environment 41 (6): 1251-1266. doi:10.1016/j. atmosenv.2006.09.048.
Generoso, S., I. Bey, M. Labonne, and F. M. Bréon. 2008.“Aerosol Vertical Distribution in Dust Outflow over the Atlantic: Comparisons between GEOS-Chem and Cloud-Aerosol Lidar and Infrared Pathfinder Satellite Observation(CALIPSO).” Journal of Geophysical Research 113 (D24209). doi:10.1029/2008JD010154.
Ghan, S. J., and R. A. Zaveri. 2007. “Parameterization of Optical Properties for Hydrated Internally Mixed Aerosol.” Journal of Geophysical Research 112 (D10201): doi:10.1029/2006JD007927.
Han, Z. W., H. Ueda, K. Matsuda, R. J. Zhang, K. Arao, Y. Kanai,and H. Hasome. 2004. “Model Study on Particle Size Segregation and Deposition during Asian Dust Events in March 2002.” Journal of Geophysical Research 109 (D19205): doi:10.1029/2004JD004920.
Holben, B. N., T. F. Eck, I. Slutsker, D. Tanre, J. P. Buis, A. Setzer,E. Vermote, et al. 1998. “AERONET - A Federated Instrument Network and Data Archive for Aerosol Characterization.”Remote Sensing of Environment 66 (1): 1-16. doi:10.1016/ S0034-4257(98)00031-5.
Huang, J. P., B. Lin, P. Minnis, T. H. Wang, X. Wang, Y. X. Hu, Y. H. Yi,and J. K. Ayers. 2006. “Satellite-based Assessment of Possible Dust Aerosols Semi-Direct Effect on Cloud Water Path over East Asia.” Geophysical Research Letters 33 (L19802): doi:10.10 29/2006GL026561.
Huang, J., Q. Fu, J. Su, Q. Tang, P. Minnis, Y. Hu, Y. Yi, and Q. Zhao. 2009. “Taklimakan Dust Aerosol Radiative Heating Derived from CALIPSO Observations Using the Fu-Liou Radiation Model with CERES Constraints.” Atmospheric Chemistry and Physics 9 (12): 4011-4021.
Huneeus, N., M. Schulz, Y. Balkanski, J. Griesfeller, J. Prospero,S. Kinne, S. Bauer, et al. 2011. “Global Dust Model Intercomparison in AeroCom Phase I.” Atmospheric Chemistry and Physics 11 (15): 7781-7816. doi:10.5194/acp-11-7781-2011.
Johnson, M. S., N. Meskhidze, and V. P. Kiliyanpilakkil. 2012. “A Global Comparison of GEOS-Chem-Predicted and Remotely-Sensed Mineral Dust Aerosol Optical Depth and Extinction Profiles.” Journal of Advance Modeling Earth System 4 (3): 110-117. doi:10.1029/2011ms000109.
Kirillova, E. N., A. Andersson, J. Han, M. Lee, and Ö. Gustafsson. 2014. “Sources and Light Absorption of Water-Soluble Organic Carbon Aerosols in the Outflow from Northern China.” Atmospheric Chemistry and Physics 14 (3): 1413-1422. doi:10.5194/acp-14-1413-2014.
Koike, M., N. Moteki, P. Khatri, T. Takamura, N. Takegawa, Y. Kondo,H. Hashioka, H. Matsui, A. Shimizu, and N. Sugimoto. 2014.“Case Study of Absorption Aerosol Optical Depth Closure of Black Carbon over the East China Sea.” Journal of Geophysical Research 119 (1): 122-136. doi:10.1002/2013JD020163.
Lamarque, J. F., T. C. Bond, V. Eyring, C. Granier, A. Heil, Z. Klimont, D. Lee, et al. 2010. “Historical (1850-2000) Gridded Anthropogenic and Biomass Burning Emissions of Reactive Gases and Aerosols: Methodology and Application.”Atmospheric Chemistry and Physics 10 (15): 7017-7039. doi:10.5194/acp-10-7017-2010.
Lau, K. M., M. K. Kim, and K. M. Kim. 2006. “Asian Summer Monsoon Anomalies Induced by Aerosol Direct Forcing: The Role of the Tibetan Plateau.” Climate Dynamics 26 (7-8): 855-864. doi:10.1007/s00382-006-0114-z.
Liu, X., R. C. Easter, S. J. Ghan, R. Zaveri, P. Rasch, X. Shi, J. F. Lamarque, et al. 2012. “Toward a Minimal Representation of Aerosols in Climate Models: Description and Evaluation in the Community Atmosphere Model CAM5.” Geoscientific Model Development 5 (3): 709-739. doi:10.5194/gmd-5-709-2012.
Park, H.-S., and B. J. Sohn. 2010. “Recent Trends in Changes of Vegetation over East Asia Coupled with Temperature and Rainfall Variations.” Journal of Geophysical Research 115(D14101): doi:10.1029/2009JD012752.
Ridley, D. A., C. L. Heald, and B. Ford. 2012. “North African Dust Export and Deposition: A Satellite and Model Perspective.” Journal of Geophysical Research 117 (D02202): doi:10.1029/2011JD016794.
Textor, C., M. Schulz, S. Guibert, S. Kinne, Y. Balkanski, S. Bauer,T. Berntsen, et al. 2006. “Analysis and Quantification of the Diversities of Aerosol Life Cycles within AeroCom.”Atmospheric Chemistry and Physics 6: 1777-1813.
Volz, F. E. 1973. “Infrared Optical-constants of Ammonium Sulfate, Sahara Dust, Volcanic Pumice, and Flyash.” Applied Optics 12 (3): 564-568. doi:10.1364/Ao.12.000564.
Wu, Z. J., Y. F. Cheng, M. Hu, and B. Wehner. 2009. “Dust Events in Beijing, China (2004-2006): Comparison of Ground-based Measurements with Columnar Integrated Observations.”Atmospheric Chemistry and Physics 9 (18): 6915-6932.
Xia, X., H. Chen, P. Goloub, W. Zhang, B. Chatenet, and P. Wang. 2007. “A Compilation of Aerosol Optical Properties and Calculation of Direct Radiative Forcing over an Urban Region in Northern China.” Journal of Geophysical Research 112(D12203): doi:10.1029/2006JD008119.
Yu, X. N., T. T. Cheng, J. M. Chen, and Y. Liu. 2006. “A Comparison of Dust Properties between China Continent and Korea,Japan in East Asia.” Atmospheric Environment 40 (30): 5787-5797. doi:10.1016/j.atmosenv.2006.05.013.
Yu, X. N., C. Z. Shi, J. Ma, B. Zhu, M. Li, J. Wang, S. Y. Yang,and N. Kang. 2013. “Aerosol Optical Properties during Firework, Biomass Burning and Dust Episodes in Beijing.”Atmospheric Environment 81: 475-484. doi:10.1016/j. atmosenv.2013.08.067.
Yu, X. N., B. Zhu, Y. Yin, J. Yang, Y. W. Li, and X. L. Bu. 2011.“A Comparative Analysis of Aerosol Properties in Dust and Haze-Fog Days in a Chinese Urban Region.”Atmospheric Research 99 (2): 241-247. doi:10.1016/j. atmosres.2010.10.015.
Zender, C. S., H. S. Bian, and D. Newman. 2003. “Mineral Dust Entrainment and Deposition (DEAD) Model: Description and 1990s Dust Climatology.” Journal of Geophysical Research 108(D14): 4416. doi:10.1029/2002JD002775.
Zhang, X. Y., Y. Q. Wang, T. Niu, X. C. Zhang, S. L. Gong, Y. M. Zhang,and J. Y. Sun. 2012. “Atmospheric Aerosol Compositions in China: Spatial/Temporal Variability, Chemical Signature,Regional Haze Distribution and Comparisons with Global Aerosols.” Atmospheric Chemistry and Physics 12 (2): 779-799. doi:10.5194/acp-12-779-2012.
ARTICLE HISTORY 26 April 2015 Accepted 21 September 2015
CONTACT LIAO Hong hongliao@mail.iap.ac.cn
© 2016 The Author(s). Published by Taylor & Francis.
This is an Open Access article distributed under the terms of the Creative Commons Attribution License (http://creativecommons.org/licenses/by/4.0/), which permits unrestricted use,distribution, and reproduction in any medium, provided the original work is properly cited.
猜你喜欢
辐射防护通讯(2019年3期)2019-04-26
四川环境(2019年6期)2019-03-04
中国报道(2018年2期)2018-04-20
学生天地(2017年12期)2017-05-17
高原山地气象研究(2016年2期)2016-11-10
绿色中国(2016年1期)2016-06-05
国外科技新书评介(2014年4期)2014-12-17
 Atmospheric and Oceanic Science Letters2016年1期
- Atmospheric and Oceanic Science Letters的其它文章
- Study on the dependence of the two-dimensional Ikeda model on the parameter
- Characteristics of air quality in Tianjin during the Spring Festival period of 2015
- Change of Arctic sea-ice volume and its relationship with sea-ice extent in CMIP5 simulations
- Calculation of stratosphere-troposphere exchange in East Asia cut-off lows: cases from the Lagrangian perspective
- Evaluation of the individual allocation scheme and its impacts in a dynamic global vegetation model
- Unrealistic treatment of detrained water substance in FGOALS-s2 and its influence on the model's climate sensitivity