
Evaluation of the individual allocation scheme and its impacts in a dynamic global vegetation model
2016-11-23 01:12SONGXingZENGXioDongbndLIFng
SONG Xing, ZENG Xio-Dong,bnd LI Fng
aInternational Center for Climate and Environment Sciences, Institute of Atmospheric Physics, Chinese Academy of Sciences, Beijing 100029,China;bCollaborative Innovation Center on Forecast and Evaluation of Meteorological Disasters, Nanjing University of Information Science & Technology, Nanjing 210044, China
Evaluation of the individual allocation scheme and its impacts in a dynamic global vegetation model
SONG Xianga, ZENG Xiao-Donga,band LI Fanga
aInternational Center for Climate and Environment Sciences, Institute of Atmospheric Physics, Chinese Academy of Sciences, Beijing 100029,China;bCollaborative Innovation Center on Forecast and Evaluation of Meteorological Disasters, Nanjing University of Information Science & Technology, Nanjing 210044, China
The strategies of plant growth play an important role not only in ecosystem structure, but also in global carbon and water cycles. In this work, the individual carbon allocation scheme of tree PFTs and its impacts were evaluated in China with Institute of Atmospheric Physics-Dynamic Global Vegetation Model, version 1.0 (IAP-DGVM1.0) as a test-bed. The results showed that, as individual growth, the current scheme tended to allocate an increasing proportion of annual net primary productivity (NPP) to sapwood and decreasing proportions to leaf and root accordingly, which led to underestimated individual leaf biomass and overestimated individual stem biomass. Such biases resulted in an overestimation of total ecosystem biomass and recovery time of mature forests, and an underestimation of ecosystem NPP and tree leaf area index in China.
ARTICLE HISTORY
Accepted 29 July 2015
IAP-DGVM1.0; individual
allocation scheme; biomass;carbon residence time; China
植物的生长策略不仅影响生态系统结构,而且对全球碳、水循环也起着至关重要的作用。本文以中国科学院大气物理研究所研发的第一代全球植被动力学模式IAP-DGVM1.0为平台,考察森林生态系统中树的个体生长方案及其影响。结果表明,与观测相比,模式高估了个体茎生物量,低估了个体叶生物量,从而进一步高估了中国森林生态系统的总生物量和成熟林受干扰后恢复的时间尺度,低估了生态系统净初级生产力和叶面积指数。
1. Introduction
In recent years, dynamic global vegetation models(DGVMs) have been developed to simulate the distribution of various PFTs and to depict land-atmospheric interactions (Cox 2001; Krinner et al. 2005; Levis et al. 2004; Sitch et al. 2003; Woodward, Lomas, and Lee 2000). However,some studies have shown that existing DGVMs produce a wide variety of simulations or predictions regarding the strength and direction of climate-carbon cycle feedback(Sitch et al. 2008), which may be due to uncertainties and biases from models' dynamic behaviors. In this context,we discuss the individual carbon allocation scheme and its impacts on ecosystem characteristics.
In nature, how plants allocate carbon among different organs is important not only for plant growth but also for decomposition, carbon and nitrogen sequestration, and plant-atmosphere water exchange (Aber et al. 1991). Previous work has shown that light and nutrient competition are the most important factors determining growth strategies (Tilman 1988): individuals growing in regions with high light competition should allocate more of their net primary productivity (NPP) to the stem in order to grow taller and outcompete others for light; while in resource-poor regions, individuals tend to be in favor of germinating new fine roots to acquire belowground resources. Meanwhile, other work has shown that biomass allocation patterns are not too different among species(Chapin 1980). Therefore, based on the dependences of individual allocation in resources, allocation schemes in commonly-used DGVMs fall into three classes: (1)Complete dynamic allocation, such as in the adaptive Dynamic Global Vegetation Model (aDGVM) (Scheiter and Higgins 2009) and Canadian Terrestrial Ecosystem Model(CTEM) (Arora and Boer 2005). In aDGVM, the proportions of allocated annual NPP to leaf, stem, and fine root are relative to the ratio between leaf and total individual biomass,target individual height, and the competitor's height, as well as the water content in root zones, respectively. CTEM adopts a similar allocation scheme as aDGVM, in which allocation is determined by the availability of water insoil layers and the availability of light measured by leaf area index (LAI). (2) Partial dynamic allocation, such as in Community Land Model version 4.5-Carbon-Nitrogen Dynamic Vegetation model (CLM4.5-CNDV) (Oleson et al. 2013). CLM4.5-CNDV adds several carbon pools to distinguish fine root and coarse root, and different parts of the stem, but all of the ratios concerned with allocation are constant except the allocation ratio of new stem and new leaf carbon, which are dependent on annual NPP.(3) Individual allocation based on fixed ratios, such as in the Lund-Potsdam-Jena DGVM (LPJ) (Sitch et al. 2003),Integrated Biosphere Simulator (IBIS) (Kucharik et al. 2000),Organizing Carbon and Hydrology in Dynamic Ecosystems(ORCHIDEE) (Krinner et al. 2005), Ecosystem Demography model (Moorcroft, Hurtt, and Pacala 2001), and CLM3.0-DGVM (Levis et al. 2004), among others. In these DGVMs,annual NPP is allocated to the individual leaf, sapwood,and root based on some fixed ratios or relationships at each time step.

Table 1.Parameters for the individual allocation scheme.
To address the impacts of tree individual growth,Institute of Atmospheric Physics-Dynamic Global Vegetation Model, version 1.0 (IAP-DGVM1.0) (Zeng, Li, and Song 2014) was chosen as a test-bed to discuss the impacts of the individual carbon allocation scheme on ecosystem characteristics in China. Section 2 introduces IAP-DGVM1.0 and its individual carbon allocation scheme, and describes the observational data used in this study. The results are analyzed in Section 3, and further discussion and conclusions are presented in Section 4.
2. Materials
2.1. Model description
IAP-DGVM1.0 was developed by the Institute of Atmospheric Physics, Chinese Academy of Sciences, and adopted concepts from the LPJ DGVM (Sitch et al. 2003)and CLM-DGVM (Levis et al. 2004). It considers photosynthesis, respiration, phenology, individual carbon allocation,competition, survival and establishment, mortality, litter decomposition, soil respiration, and fire disturbance. The main characteristics are the new developments of a shrub sub-model (Zeng 2010; Zeng, Zeng, and Barlage 2008),establishment parameterization scheme (Song 2012; Song and Zeng 2014), and a process-based fire parameterization of intermediate complexity (Li, Zeng, and Levis 2012). A detailed description of IAP-DGVM1.0 is available in Zeng, Li, and Song (2014), and so is repeated here. Because the processes of individual growth are the key points in this work, the corresponding schemes are described in the following subsection.
2.2. Individual allocation scheme for woody PFTs
IAP-DGVM1.0 uses a similar individual carbon allocation scheme as CLM3.0-DGVM, but removes the effects of the water stress factor on the ratio of the individual leaf and root biomasses. In the model, the leaf is the sole organ that produces photosynthesis. In each year, due to turnover, plants will lose half or all of their leaves and roots. Meanwhile, 1/20 of sapwood biomass will be transformed into heartwood (heartwood has no turnover). At the end of each year, the summed NPP in the whole year is allocated to leaf, sapwood, and root after deducting the reproduction cost. The allocation for woody PFTs(including trees and shrubs) follows (Zeng, Li, and Song 2014)

where Aland Asare the individual leaf area and sapwood cross sectional area; Cleafand Crootdenote individual leaf and root biomass, respectively; H, D, and Ω (Ω ≤ 15 m2)represent individual height, stem diameter and crown area, respectively; and kls, klr, ka1, ka2, ka3, and krpare PFT-dependent parameters (Table 1). Furthermore, Aland Cleafmeet:

where ζ is the specific leaf area, a PFT-dependent parameter; and the stem biomass (Cstem) is calculated by:

where ρ is wood density, and Vstemis the stem volume.
2.3. Data

Figure 1.The relationships between individual stem volume (Vstem; m3per individual) and annual allocation proportions of NPP to (a) leaf(Fleaf; %), (c) sapwood (Fsap; %), and (e) root (Froot; %); as well as (g) the frequency distribution of Fleaf(σ; %) from simulation. Panels (b, d, f,and h) are the results from CERN observation data.
Products from the Chinese Ecosystem Research Network(CERN) were used for analysis. The observational methods and analytical standards regarding this dataset are described briefly in Dong et al. (1997). In this study,the observational data were from 1246 quadrats and published in the year 2004 (Luo 1994) (http://159.226.111.42/ pingtai/cernc/). Because IAP-DGVM1.0 considers only natural ecosystems and does not refer to human activities,only data regarding natural forests were selected. The filtered data covered tropical rainforest and monsoon forest, subtropical evergreen broadleaf/coniferous forest,temperate deciduous broadleaf forest, boreal evergreen/ deciduous coniferous forest, and so forth. The forest stand ages ranged from 10 to 350 years, and the mean annual temperature and annual total precipitation were -6.6 to 25.2 °C and 27.6-2989.1 mm, respectively.
3. Results
To evaluate the individual growth dynamics and its effects in IAP-DGVM1.0 coupled with CLM3.0 (CLM-IAP-DGVM1.0),an 800-year regional offline simulation at T-62 resolution was performed, forced with 16 repetitions of 50 years of reanalysis of surface atmospheric fields (1950-1999) from Qian et al. (2006). The variables were averaged over the last 50 simulation years (steady states) for statistical analysis.

Figure 2.Comparisons of (a) PFT-average individual leaf biomass and (b) stem biomass, (c) the relationship between individual stem volume (Vstem; m3per individual) and the ratio of individual stem biomass and leaf biomass (Cstem/Cleaf); and (d) the zonal mean of tree maximum total leaf area index (TLAImax; m2m-2) between simulation and observation.
3.1. The dynamic behaviors of the individual allocation scheme
Stem volume is an important index describing individual size and depicting the net growth rate of a tree. Therefore, the relationships between individual stem volume (Vstem; m3per individual) and annual allocation proportions of NPP to leaf (Fleaf; %), sapwood (Fsap; %),and root (Froot; %) were investigated. In order to focus on the core area of forests, only the cases with the summed fractional coverage of all tree PFTs in each grid cell (Ftree)greater than 20% were considered. It was found that,along with individual growth, Fleafdecreased from 45% to around 28% (Figure 1a), while Fsapgrew from 10% to almost 43% (Figure 1c). However, in the observational data, Fleafand Fsapranged from about 8% to 88% and 8% to 78%, respectively. Furthermore, the indication was that larger individuals could have higher Fleafand lower Fsap(Figures 1b and 1d). In addition, based on the frequency distribution of Fleaf(σ; %), about 86% of the simulated core forest areas had individuals with Fleafbelow 35% in China (Figure 1g), while only about 36% of observational forests had a mean Fleafbelow 35%(Figure 1h). Such results implied that Fleafwas seriously underestimated, and this may be because, in the current allocation scheme, Fleafis inversely related to individual size. As for root, Frootis assumed to be equivalent to Fleafin the model. Compared with observational data (Figure 1f), both the simulated Frootand the observational Frootdecreased with Vstem, but the simulation was higher than the observation.
3.2. Impacts of the individual allocation scheme on individual biomass and tree LAI simulation in China Figures 2a and 2b show the PFT-average level comparisons with respect to individual stem biomass (Cstem; kgC per individual) and leaf biomass (Cleaf; kgC per individual)between simulations and observations in China, respectively. Note that the simulated tree PFTs in China were NEB-Tr (boreal needleleaf evergreen tree), BDB-Tr (boreal broadleaf deciduous tree), NEM-Tr (temperate needleleaf evergreen tree), BDM-Tr (temperate broadleaf deciduous tree), and BEM-Tr (temperate broadleaf evergreen tree),in which BDB-Tr and BEM-Tr did not have associated field measurements. Our analysis (figures omitted) found that the regions dominated by simulated BEM-Tr were mainly subtropical broadleaf evergreen forests (BEST) in observations, so the observational data for BEST were used to evaluate BEM-Tr in this study. As for BDB-Tr, the forest area was small in the simulation and the information about this forest type in CERN data was limited; therefore, only the simulated results are shown. The results showed that IAPDGVM1.0 underestimated Cleaffor all tree PFTs (Figure 2a),and overestimated Cstemfor most of them except NEB-Tr(Figure 2b). According to the statistics, the absolute biases(|observation - simulation|) in Cleafranged from 1.88 kgC per individual for NEM-Tr to 2.16 and 2.79 kgC per individual for BDM-Tr and NEB-Tr, to 3.49 kgC per individual for BEM-Tr; while the relative biases (|observation - simulation|/observation) in Cleafranged from 42.53% for NEM-Tr to 79.50% for NEB-Tr. Furthermore, the biases in Cstemseemed much larger, where the absolute biasesranged from 25.14 kgC per individual for NEB-Tr to 317.62 kgC per individual for BEM-Tr, and the relative biases were from 34.20% for NEB-Tr to 534.61% for BDM-Tr. Such large biases in Cleafand Cstemmay mainly result from higher Fsapand lower Fleaf(Figure 1). Because root has the same allocated proportion of annual NPP and turnover rate as leaf in the model, the result for root biomass was similar to Cleaf;therefore, it is omitted here.
As described above, IAP-DGVM1.0 follows the classical‘pipe model', which assumes sapwood functions as a set of pipes to support root water uptake and canopy transpiration, and its cross-sectional area (conductance) is proportional to total leaf area. Meanwhile, cross-sectional area and leaf area are proportional to sapwood biomass and leaf biomass, respectively, in the model. So, the ratio between individual sapwood biomass (Cstem; kgC per individual) and leaf biomass (Cleaf; kgC per individual) can reasonably reflect Equation (1), to some extent.
However, in the CERN data, the whole stem is divided into branch and trunk (not distinguishing sapwood and heartwood), while the model assumes the individual stem includes sapwood and heartwood. Therefore, the ratio between the biomass of the whole stem (e.g. the summation for sapwood and heartwood in the model vs. the summation for trunks and branches in the observations) and the leaf biomass was used for one-to-one comparisons.
From Figure 2c, the ratio Cstem/Cleafincreased with individual growth, i.e. larger individuals needed more stem biomass to support leaf biomass in unit mass, which was in accordance with observations. However, the simulated ratio Cstem/Cleafwas obviously larger and had faster growth,with Vstemin common interval (2 × 10⁻³≤ Vstem≤ 10 m3per individual), which may also result from high Fsapas well as low Fleaf.
Furthermore, LAI was also evaluated. Because the main research object in this work was forest, tree LAIs of Chinese forests, rather than ecosystem LAIs, were investigated. Figure 2d shows the zonal mean of tree maximum total LAIs (TLAImax; m2m-2) for Chinese forests. Due to underestimated Cleaf, TLAImaxwas extensively underestimated for all forest types in China. The differences in TLAImaxbetween simulations and observations were relatively smaller over 48-53°N, where NEB-Tr was dominant, but much larger in other regions, and the maximum difference reached 8.5 m2m-2at around 20°N. Furthermore, the model did not capture the observed TLAImaxpeaks around 20°N, 28-33°N,42.5°N, and 47°N.
3.3. Impacts of the individual allocation scheme on ecosystem characteristics in China
Next, ecosystem biomass (Ceco; kgC m-2), ecosystem net primary production (NPPeco; kgC m-2yr-1) and the residence time of carbon in living biomass (Teco; yr) were evaluated (Figure 3). It was found that both the simulated Cecoand NPPecoincreased with increasing mean annual precipitation (MAP; mm) and temperature (MAT; °C), i.e. warm and humid subtropical or tropical forests had higher ecosystem biomass and NPP per unit area, which was consistent with observations (Figure 3a vs. 3b; Figure 3c vs. 3d). However, as IAP-DGVM1.0 remarkably overestimated Cstemin general, especially for BEM-Tr and BDM-Tr, the simulated Cecowas higher than observed, and the largest bias existed in temperate regions where MAT and MAP were around 6 °C-12 °C and 1000-1400 mm, respectively (Figure 3a vs. 3b). Meanwhile, leaf is the sole organ that produces photosynthesis in the model. So, underestimating Cleafmay result in an underestimation of gross primary production,and subsequently NPP. From Figures 3c and 3d, the biases in NPP were also mainly from temperate and subtropical forests. The results shown in Figures 3a and 3c together lead to relatively higher residence times of carbon in living biomass (Teco), defined by (Ricklefs 2008).

Overall, the simulated Tecowas larger than observed,except in arid regions, where Tecowas underestimated. Furthermore, in simulations, subtropical or tropical forests had the longest Teco(around 30-50 years), while boreal forests had the shortest one (around 25 years). This was contrary to the results calculated from the CERN data, in which the Tecoof subtropical or tropical forests was about 10-15 years, and the Tecoof boreal forests was about 15-25 years (Figure 3e vs. 3f).
4. Conclusion and discussion
In this paper, IAP-DGVM1.0 was used to investigate the individual carbon allocation scheme and its impacts on forest ecosystem traits (e.g. individual biomass, LAI, etc.). Results showed that, compared with observations, the current individual allocation scheme resulted in low Fleafand high Fsap, which easily led to individuals with low leaf biomass and high stem biomass. Consequently, there was an overestimation of ecosystem biomass as well as carbon residence time in living biomass, and an underestimation of ecosystem NPP and tree TLAI. Such results imply that,although the model can roughly capture the distribution of the percentage coverage of forests (Zeng, Li, and Song 2014), it is incapable of capturing forest ecosystem characteristics and structure, which may lead to biases in landatmosphere interactions.
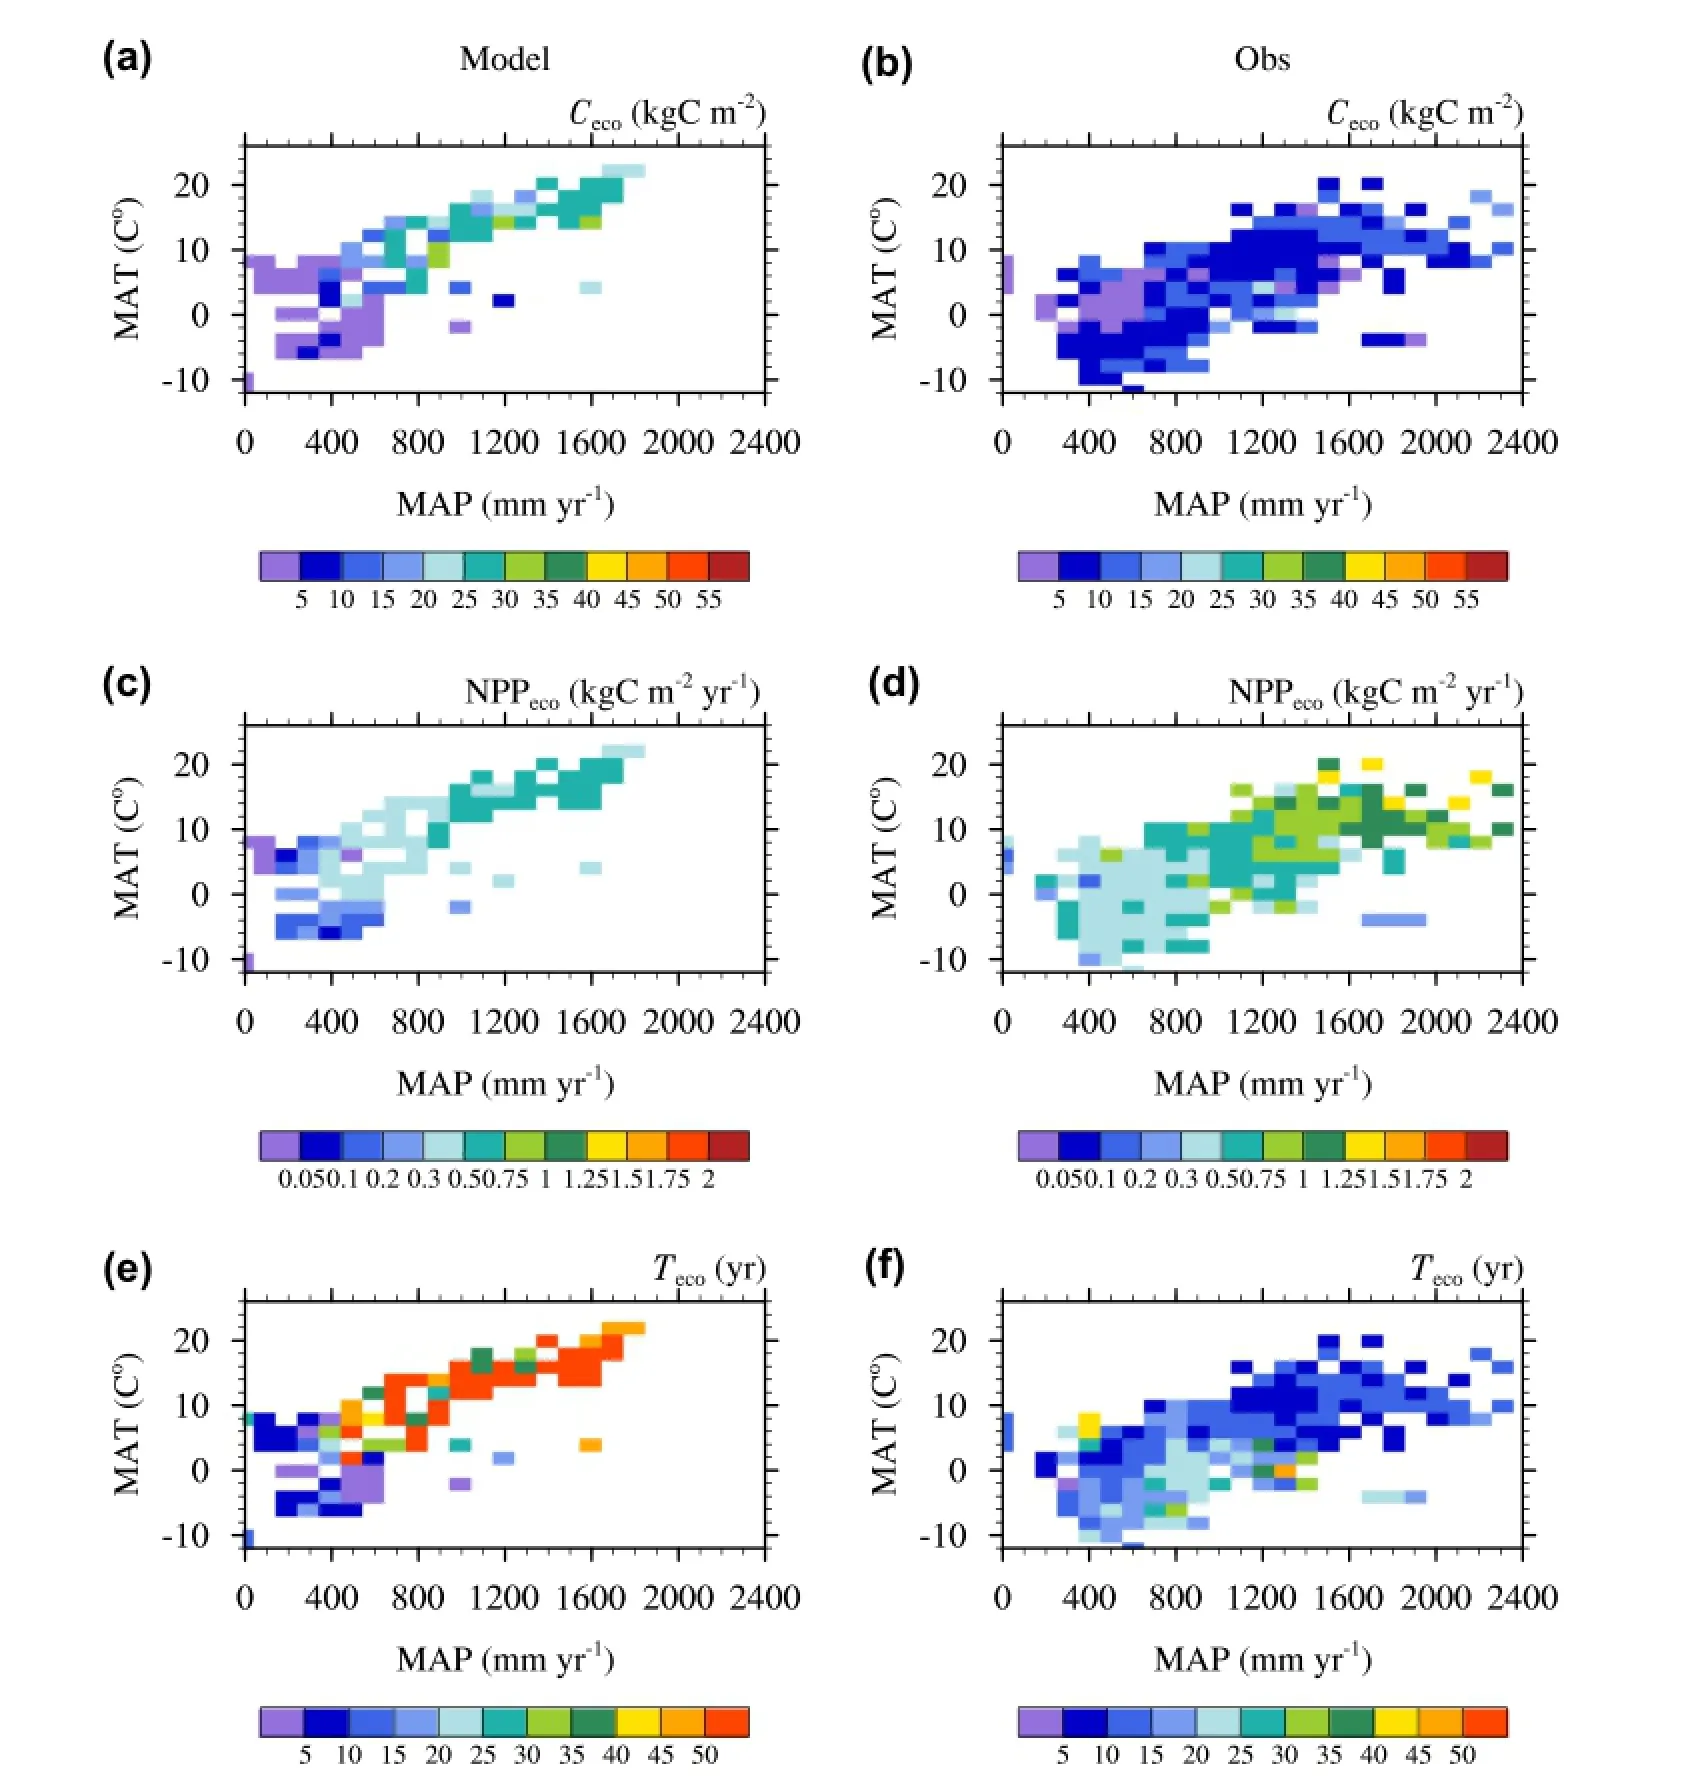
Figure 3.The distribution of the simulated (a) ecosystem biomass (Ceco; kgC m-2), (c) ecosystem net primary production (NPPeco; kgC m-2yr-1), and (e) residence time of carbon in living biomass for the ecosystem (Teco; yr). Panels (b, d, f) refer to the Ceco, NPPeco, and Tecoobtained from CERN data, respectively.
As described above, the bias in individual biomass derives mainly from the overestimated Cstem. In order to reduce Cstem, one approach is to introduce the turnover of heartwood, as in other DGVMs (Scheiter and Higgins 2009). However, we found that, without changing the current allocation scheme, whilst indeed reducing Cstem, only introducing the turnover rate of heartwood also further reduces Cleaf. That is to say, when Cstemreaches reasonable values, Cleafwill become very small, and consequently NPP will be further underestimated and the distributions of fractional coverage for simulated PFTs also will become unreasonable. Therefore, only considering the turnover rate is insufficient.
To improve the simulation of individual biomass,another approach is dynamic individual carbon allocation. Compared with Equation (1), the dynamic individual allocation scheme can change Fleaf, Fsap, and Frootbased on environmental conditions (water stress, light competition, etc.), and the essential difference is that Fleafincreases with individual total biomass in the dynamic individual allocation scheme (e.g. aDGVM). Our work (unpublished data) shows that, when adopting the dynamic allocation scheme and retaining the current turnover rates, a higher proportion of annual NPP would be allocated to leaf or root in the regions with weak light competition. Therefore,high Fleafleads to reasonable Cleaf, while low Fsapdecreases the accumulation rate of stem biomass, and then results in reasonable Cstemfor tree PFTs (similar to the results of Friedlingstein et al. (1999)). Accordingly, the simulated Tecois also improved. However, the underestimation of NPP (Figure 3c) is not improved much when using this scheme. In addition, globally, LAI may be further overestimated in regions with overwhelmingly larger TLAI due to increasing Cleafand underestimated individual crown area. Therefore, individual morphology should also be considered.
Lastly, it should be emphasized that, given this study is based only on IAP-DGVM1.0, it should also be repeated in other DGVMs with similar individual allocation schemes,such as LPJ-DGVM, CLM3.0-DGVM, IBIS, and ORCHIDEE.
Funding
This work was supported by a project of the National Natural Science Foundation of China [grant number 41305098]; Strategic Priority Research Program of the Chinese Academy of Sciences [grant numbers XDA05110103 and XDA05110201].
References
Aber, J. D., J. M. Melillo, K. J. Nadelhoffer, J. Pastor, and R. D. Boone. 1991. “Factors Controlling Nitrogen Cycling and Nitrogen Saturation in Northern Temperate Forest Ecosystems.”Ecological Applications 1(3): 303-315. doi: 10.2307/1941759.
Arora, V., and G. J. Boer. 2005. “A Parameterization of Leaf Phenology for the Terrestrial Ecosystem Component of Climate Models.” Global Change Biology 11: 39-59. doi: 10.1111/j.1365-2486.2004.00890.x.
Chapin, F. S. 1980. “The Mineral Nutrition of Wild Plants.” Annual Review of Ecology and Systematics 11: 233-260.
Cox, P. 2001. Description of the TRIFFID Dynamic Global Vegetation Model. Bracknell: Hadley Centre Tech. Note 24, Hadley Centre,16 pp.
Dong, M., G. M. Jiang, F. Z. Kong, Y. F. Wang, and Z. B. Zhang. 1997. The Observation and Analysis Standards of the Chinese Ecosystem Research Network: The Investigations, Observation and Analysis about Terrestrial Biomes. Beijing: Standards Press of China (in Chinese).
Friedlingstein, P., G. Joel, C. B. Field, and I. Y. Fung. 1999. “Toward an Allocation Scheme for Global Terrestrial Carbon Models.”Global Change Biology 5: 755-770. doi: 10.1046/j.1365-2486.1999.00269.x.
Krinner, G., N. Viovy, N. de Noblet-Ducoudré, J. Ogée, J. Polcher,P. Friedlingstein, P. Ciais, S. Sitch, and I. C. Prentice. 2005. “A Dynamic Global Vegetation Model for Studies of the Coupled Atmosphere-biosphere System.” Global Biogeochemical Cycles 19: GB1015. doi: 10.1029/2003GB002199.
Kucharik, C. J., J. A. Foley, C. Delire, V. A. Fisher, M. T. Coe, J. D. Lenters,C. Young-Molling, et al. 2000. “Testing the Performance of a Dynamic Global Ecosystem Model: Water Balance, Carbon Balance, and Vegetation Structure.” Global Biogeochemical Cycles 14 (3): 795-825. doi: 10.1029/1999GB001138.
Levis, S., G. B. Bonan, M. Vertenstein, and K. W. Oleson. 2004. The Community Land Model's Dynamic Global Vegetation Model(CLM-DGVM): Technical Description and User's Guide. NCAR Technical Note, NCAR/TN-459+IA. Boulder, CO: National Center for Atmospheric Research, 50 pp.
Li, F., X. D. Zeng, and S. Levis. 2012. “A Process-based Fire Parameterization of Intermediate Complexity in a Dynamic Global Vegetation Model.” Biogeosciences 9: 2761-2780. doi: 10.5194/bg-9-2761-2012.
Luo, T. X. 1994. “Patterns of Net Primary Productivity for Chinese Major Forest Types and Their Mathematical Models.” PhD diss., Chinese Academy of Sciences, 230 pp. (in Chinese).
Moorcroft, P. R., G. C. Hurtt, and S. W. Pacala. 2001. “A Method for Scaling Vegetation Dynamics: The Ecosystem Demography Model (Ed).” Ecological Monographs 71 (4): 557-586.
Oleson, K. W., D. M. Lawrence, G. B. Bonan, B. Drewniak, M. Y. Huang, C. D. Koven, S. Levis, et al. 2013. Technical Description of Version 4.5 of the Community Land Model (CLM). NCAR Technical Note, NCAR/TN-503+STR. Boulder, CO: National Center for Atmospheric Research, 434 pp.
Qian, T. T., A. G. Dai, K. E. Trenberth, and K. W. Oleson. 2006.“Simulation of Global Land Surface Conditions from 1948 to 2004. Part I: Forcing Data and Evaluations.” Journal of Hydrometeorology 7: 953-975. doi:http://dx.doi.org/10.1175/ JHM540.1.
Ricklefs, R. E. 2008. The Economy of Nature. 6th ed. New York: W. H. Freeman and Company, 700 pp.
Scheiter, S., and S. I. Higgins. 2009. “Impacts of Climate Change on the Vegetation of Africa: An Adaptive Dynamic Vegetation Modelling Approach.” Global Change Biology 15 (9): 2224-2246. doi: 10.1111/j.1365-2486.2008.01838.x.
Sitch, S., C. Huntingford, N. Gedney, P. E. Levy, M. Lomas, S. L. Piao, R. Betts, et al. 2008. “Evaluation of the Terrestrial Carbon Cycle, Future Plant Geography and Climate-carbon Cycle Feedbacks Using Five Dynamic Global Vegetation Models (DGVMs).” Global Change Biology 14: 2015-2039. doi: 10.1111/j.1365-2486.2008.01626.x.
Sitch, S., B. Smith, I. C. Prentice, A. Arneth, A. Bondeau, W. Cramer,J. O. Kaplan, et al. 2003. “Evaluation of Ecosystem Dynamics,Plant Geography and Terrestrial Carbon Cycling in the LPJ Dynamic Global Vegetation Model.” Global Change Biology 9: 161-185. doi:10.1046/j.1365-2486.2003.00569.x.
Song, X. 2012. “The Research on Population Dynamics in Dynamic Global Vegetation Model.” PhD diss., Institute of Atmospheric Physics, Chinese Academy of Science, 102 pp.(in Chinese).
Song, X., and X. D. Zeng. 2014. “Investigation of Uncertainties of Establishment Schemes in Dynamic Global Vegetation Models.” Advances in Atmospheric Sciences 31: 85-94. doi:10.1007/s00376-013-3031-1.
Tilman, D. 1988. Plant Strategies and the Dynamics and Structure of Plant Communities. Princeton, NJ: Princeton University Press, 360 pp.
Woodward, F. I., M. R. Lomas, and S. E. Lee. 2000. “Predicting the Future Production and Distribution of Global Terrestrial Vegetation.” In Terrestrial Global Productivity, edited by J. Roy,B. Saugier and H. A. Moonie. Cambridge: Academic Press, 573 pp.
Zeng, X. D. 2010. “Evaluating the Dependence of Vegetation on Climate in an Improved Dynamic Global Vegetation Model.”Advances in Atmospheric Sciences 27: 977-991. doi: 10.1007/ s00376-009-9186-0.
Zeng, X. D., F. Li, and X. Song. 2014. “Development of the IAP Dynamic Global Vegetation Model.” Advances in Atmospheric Sciences 31: 505-514. doi:10.1007/s00376-013-3155-3.
Zeng, X. D., X. B. Zeng, and M. Barlage. 2008. “Growing Temperate Shrubs over Arid and Semiarid Regions in the Community Land Model-dynamic Global Vegetation Model.”Global Biogeochemical Cycles 22: GB3003. doi:10.1029/2007 GB003014.
11 May 2015
CONTACT SONG Xiang songxiang@mail.iap.ac.cn
© 2016 The Author(s). Published by Taylor & Francis
This is an Open Access article distributed under the terms of the Creative Commons Attribution License (http://creativecommons.org/licenses/by/4.0/), which permits unrestricted use, distribution, and reproduction in any medium, provided the original work is properly cited.
猜你喜欢
江西农业大学学报(2022年1期)2022-02-04
数学物理学报(2021年6期)2021-12-21
力学学报(2021年7期)2021-11-09
林业资源管理(2021年2期)2021-06-07
江西农业大学学报(2021年2期)2021-05-16
化工管理(2021年7期)2021-05-13
能源工程(2021年1期)2021-04-13
福建农林大学学报(自然科学版)(2020年6期)2020-11-26
小星星·阅读100分(低年级)(2020年4期)2020-05-12
苏州科技大学学报(自然科学版)(2020年1期)2020-04-13
 Atmospheric and Oceanic Science Letters2016年1期
- Atmospheric and Oceanic Science Letters的其它文章
- Study on the dependence of the two-dimensional Ikeda model on the parameter
- Aerosol absorption optical depth of fine-mode mineral dust in eastern China
- Characteristics of air quality in Tianjin during the Spring Festival period of 2015
- Change of Arctic sea-ice volume and its relationship with sea-ice extent in CMIP5 simulations
- Calculation of stratosphere-troposphere exchange in East Asia cut-off lows: cases from the Lagrangian perspective
- Unrealistic treatment of detrained water substance in FGOALS-s2 and its influence on the model's climate sensitivity