
Experimental study of flow field distribution over a generic cranked double delta wing
2016-11-24 02:23MojtabaDehghanManshadiMehdiEilbeigiMohammadKazemSobhaniMehrdadBazazZadehMohammadAliVaziry
CHINESE JOURNAL OF AERONAUTICS 2016年5期
Mojtaba Dehghan Manshadi,Mehdi Eilbeigi,Mohammad Kazem Sobhani,Mehrdad Bazaz Zadeh,Mohammad Ali Vaziry
Department of Mechanical and Aerospace Engineering,Malek Ashtar University of Technology,Shahinshahr 3898,Iran
Experimental study of flow field distribution over a generic cranked double delta wing
Mojtaba Dehghan Manshadi*,Mehdi Eilbeigi,Mohammad Kazem Sobhani,Mehrdad Bazaz Zadeh,Mohammad Ali Vaziry
Department of Mechanical and Aerospace Engineering,Malek Ashtar University of Technology,Shahinshahr 3898,Iran
The flow fields over a generic cranked double delta wing were investigated.Pressure and velocity distributions were obtained using a Pitot tube and a hot wire anemometer.Two different leading edge shapes,namely''sharpquot;and''roundquot;,were applied to the wing.The wing had two sweep angles of 55°and 30°.The experiments were conducted in a closed circuit wind tunnel at velocity 20 m/s and angles of attack of 5°–20°with the step of 5°.The Reynolds number of the model was about 2X10⁵according to the root chord.A dual vortex structure was formed above the wing surface.A pressure drop occurred at the vortex core and the root mean square of the measured velocity increased at the core of the vortices,reflecting the instability of the flow in that region.The magnitude of power spectral density increased strongly in spanwise direction and had the maximum value at the vortex core.By increasing the angle of attack,the pressure drop increased and the vortices became wider;the vortices moved inboard along the wing,and away from the surface;the flow separation was initiated from the outer portion of the wing and developed to its inner part.The vortices of the wing of the sharp leading edge were stronger than those of the round one.
1.Introduction
The interest in flying wings for military and civil application has currently increased.Accordingly,questions on aerody-namics,control and structural efficiency have arisen.Flying wings are of the most efficient configurations,but have some special constraints,compared with the conventional arrangements.1Some advantages of this type of configurations are higher lift to drag ratio,lower drag force and weight saving.2Flying wings generally use delta or lambda shaped wings;hence,understanding the flow behavior of these types of wings becomes an important aspect.A nonslender wing is defined as one with a leading edge sweep angle less than or equal to 55°.3The flow behavior of slender delta wings has been extensively studied,whereas the interest in understanding the flow over nonslender delta wings has increased in the literature.
Luckring4has described flow structure of a sharp edge slender delta wing.By virtue of the sharp leading edge,primary separation is forced to occur at the leading edge,and for the slender wing,this separation rolls up to form the primary leading edge vortex.The primary vortex induces significant spanwise flow on the wing upper surface,resulting in the negative suction peak.After the primary suction peak,the adverse spanwise pressure gradient induces separation of the spanwise boundary layer flow,resulting in a secondary separation and secondary vortex.The secondary vortex induces suction outboard of the primary vortex suction peak.4The primary vortex can have a diameter around 30%of the local semi span.5The primary vortex trajectory for a given sweep angle is relatively insensitive to angle of attack(AOA)α,and is essentially proportional to the wing leading edge angle.5
The vortical flow structure over a sharp edge nonslender delta wing differs substantially from that over a slender delta wing.6Computations of Gordnier and Visbal7for a 50°delta wing have shown a broad wake-like flow which is consistent with the experimental measurements.At upstream locations near the apex,the long and thin shear layer that emanates from the leading edge of the delta wing terminates in the formation of the primary vortex.Further downstream,a second vortex,with vorticity of the same sign of the primary vortex,emerges in the separated shear layer,outboard of the primary vortex,creating a dual vortex structure.This second vortex,which is slightly weaker and smaller than the original one,arises from the interaction of the secondary flow with the primary shear layer.
Feizian8has performed a flow visualization over a 60°delta wing.The observed vortical flow above the surface is shown in Fig.1.Dual vortex structure is well identified in the experiment.
Yayla et al.9have studied flow structure on a nonslender lambda wing,using particle image velocimetry(PIV)technique.The study showed that increasing the angle of attack amplifies the strength of the vortices,velocity fluctuations near the surface,and turbulent kinetic energy.
Konrath et al.10have conducted experiments on a 53°swept lambda wing.The flow field above the wing was investigated by PIV measurements.The results showed the development of three different vortex systems,i.e.,an apex vortex,a thickness-caused vortex and a leading edge vortex.A complete or fractional merging between these co-rotating vortices can be observed above the model,which occurs in dependency of the AOA.
It should also be noted that aerodynamic stability and control may be degraded by the presence of multiple interacting vortices,vortex breakdown and large-scale flow separation.11
Some aerodynamic investigations on cranked double delta wing layouts have started by the authors of the present work.

Fig.1 Formation of the dual vortex structure above a 60°delta wing.8
Accordingly,several wing configurations have been considered.The present work is concentrated on a configuration which is similar to the novel wing planform of the Northrop Grumman X-47B aircraft.
Several wind tunnel experiments have been conducted in a low speed wind tunnel with a model of the aforementioned cranked double delta wing.As the aircraft take-off and landing are performed at low speeds,the present study discusses the behavior of the flow field above the surface at low speeds.The pressure and velocity measurements were performed for two different edge shapes,namely round and sharp,in different cross planes on the upper side of the model.It should also be mentioned that the primary flow structures such as primary vortices and their subsequent breakdown are insensitive to Reynolds number for highly swept lifting surfaces such as delta wings.5,12The resulting data have also provided a basis for evaluating the ability of computational fluid dynamics(CFD)methods to predict the characteristics of the cranked double delta wing configuration at low Mach numbers.
2.Experimental setup
Wind tunnel models were two nonslender cranked double delta wings:one wing with a''sharpquot;leading edge and the other with a''roundquot;leading edge.A planform of the model is shown in Fig.2.The inner wing has a sweep angle of 55°and the outer 30°.The root chord c and the span of the wing are equal to 150 mm and 244 mm respectively with the thickness ratio of 6.7%.The installed model in the wind tunnel is shown in Fig.3.
The tests were undertaken in a closed circuit wind tunnel.The dimensions of the test section of the wind tunnel were 30 cmX40 cm.The flow quality and turbulence intensity across the test section were examined and the y were good enough to perform the experiments.13The turbulence intensity across the tunnel working section was measured and it was obtained between 0.20%and 0.25%.In all measured cases,a free stream velocity of V=20 m/s was applied,which corresponds to a Reynolds number of Re=2X10⁵based on the root chord of the model.The blockage ratio of the model in the test section at maximum AOA with all the measurement instruments was about 5.1%;hence the wall effects were negligible.14

Fig.2 Planform of model with cross plane locations of measurements.

Fig.3 Wind tunnel model in closed test section.
To measure the velocity field over the wing surface,a single normal hot wire probe was used.The diameter of the wire was 5 μm,which was made of tungsten with the length of 1.5 mm.To avoid the collision of the probe to the surface,it was situated 1 mm above surface.Prior to performing the experiments,the hot wire was calibrated in both static and dynamic conditions.The data samples collected by the hot-wire anemometer were converted to the corresponding flow velocities using the calibration data.The data were acquired for 5 s at sample rate of 5 kHz.An additional temperature probe was employed to correct the anemometer output voltages.The free stream velocity in the working test section was measured using a Pitot-static tube which was installed upstream of the model and was connected to a one-channel pressure transducer.
The pressure field above the wing surface was measured by a pitot tube with diameter of 2 mm,which was connected to an accurate pressure transducer.To investigate the flow behavior of the wing,flow visualization was undertaken prior to the main experiments,using smoke and laser sheet shone perpendicular to the wing surface.
To move the holder of the hot wire and Pitot tube,a traversing system with three degrees of freedom and accuracy of 0.1 mm was used.The motion of the probe was spanwise,perpendicular to the wing surface with the displacement of 2 mm so that a cross plane over the wing was scanned.The experiments were performed for 4 sections as seen in Fig.2,corresponding to x/c=0.2,0.4,0.6 and 0.8 at different angles of attack of 5°,10°,15°and 20°.Table 1 shows the conditions of the tests.
The uncertainty of velocity measurement includes uncertainty of constant temperature anemometer,calibration,position of hot wire probe,temperature measurement,etc.The uncertainty of velocity measured by hot wire anemometer in accordance with Jorgensen15and Yavuzkurt16is obtained about 3%.
3.Results
3.1.Vortical flow over wing
Fig.4 shows the flow visualization over the wing at a section prior to the change in leading edge sweep angle,using smoke and laser sheet at the AOA of 5°.As seen in the picture,a dualvortex structure is formed on the wing:the main vortex which is initiated from the wing apex,and the second vortex.The main vortex is larger in size and closer to the wing center line than the second vortex,which is smaller and formed outboard of the main one.

Table 1 Test conditions.

Fig.4 Flow visualization by smoke and laser sheet above wing surface(α =5°,x/c=0.4).

Fig.5 Distribution of pressure coefficient above wing surface(α =5°,10°and 15°,x/c=0.4).
The pressure above the wing surface measured by a pitot tube is non-dimensionalized by 0.5ρ∞V2as follows:

where Cpis the pressure coefficient,p the pressure,p∞the free stream pressure,ρ∞the free stream density.
The measurement location is also non-dimensionalized by the semi span of the wing,s.The pressure coefficient distributions above the wing surface for x/c=0.4 at the AOA of 5°,10°and 15°are plotted in Fig.5.Two individual pressure concentration regions are seen,which are associated with the vortex formation,indicating the main and second vortices respectively.AOA has significant effects on the flow behavior of delta shaped wings.Increasing the AOA increases the size and strength of the vortices,and also leads to intensification of velocity fluctuations near the wing surface,vorticity and tur-bulent kinetic energy.9It is seen in Fig.5 that by increasing the AOA,the pressure drop increases,which means the magnification of the vortex strength.Also the pressure drop region becomes wider,reflecting the expansion of the vortex.
Vortex core location moves outboard and widens in the streamwise direction.12Fig.6 shows the trajectory of the vortices over the wing which is obtained according to the vortex core location above the wing surface.As seen in this figure the vortices move outboard in the streamwise direction.
By increasing the AOA,the strength of the vortices increases and the y tend to move upward.11Fig.7 shows the main vortex core location at different angles of attack.As seen in the figures,increasing the AOA causes the vortex flow to move inboard and upward,which is consistent with the results of Wiggen17,who showed that by increasing the AOA,the main vortex moved inboard and separated further apart from the surface of a lambda shaped wing.
3.2.Instantaneous vortex behavior
The unsteady behavior of the shear layer yields a significant wandering of the vortex core around a mean core location.This unsteady motion of the vortex core results in high values of the fluctuating kinetic energy,k,in the vortex core.3Large velocity fluctuations in the vortex cores are common regardless of geometry and Reynolds number.18By studying the statistical characteristics of velocity fluctuations,a good approximation of the vortex core location can be obtained.The high root mean square(RMS)of velocity indicates the location of the vortex cores.19
The RMS of velocity at a given location is calculated by20:

where V is the average velocity at the point of measurement,Vi(t)the instantaneous velocity at the time t,and n the sample size.

Fig.6 Vortex flow trajectory over wing(α =5°).

Fig.7 Variation of spanwise and vertical location of main vortex core in streamwise direction.

Fig.8 Root mean square of axial velocity above surface(α =5°,x/c=0.4,0.6 and z/s=0.02).
The root mean square of the measured axial flow velocity above the wing surface by the hot wire anemometry is shown in Fig.8.The corresponding values for the vertical section of z/s=0.02 at the AOA of 5°and longitudinal sections of x/c=0.4(before sweep change)and 0.6(after sweep change)are illustrated in the figure.Some peaks in the measured values can be seen for the section x/c=0.4,at the spanwise locations of y/s≈0.25 and 0.3;and for the section x/c=0.6,at the spanwise locations of y/s≈0.35 and 0.50.The pressure coefficient above the wing surface at the same location and AOA is shown in Fig.9.By comparing the figures,one can conclude that at the vortex core a rapid rise in the root mean square of the velocity occurs.This plot also exhibits dual vortex structure above the wing surface.Fig.10 shows the distribution of the root mean square of the axial velocity above the wing surface for the cross plane x/c=0.6.In this contour,the rapid rise of this parameter is seen,which shows the vortex core location,where the fluctuation of the velocity highly increases.The increase occurs at two locations indicating the formation of two separate vortices.

Fig.9 Pressure coefficient above wing surface(z/s=0.02,α =5°,x/c=0.4 and 0.6).

Fig.10 Root mean square of axial velocity distribution above the wing surface(x/c=0.6).

Fig.11 Instantaneous velocity for free stream (x/c=0.6,α =5°).
The instantaneous velocity V/Vmeanat different spanwise locations for the section x/c=0.6 at the α =5°is shown in Fig.11.The magnitude of the velocity fluctuations greatly increases at the vortex core location.Spectral analysis gives the magnitude and the frequencies for structural excitation levels.21,22The power spectrum density(PSD)of velocity fluctuations at the vortex core for the section x/c=0.6 at the α=5°is shown in Fig.12.There are some dominant peaks in the PSD plot in the range off=70–550 Hz,correspond to the Strouhal number St of 0.525–4.125.The maximum value of PSD is obtained at the f=153 Hz(St=1.14).These peaks corresponding to the shear layer instabilities.Gursul18detected a broad dominant peaks in the range of St=1–5,in the shear layer of a 50°swept delta wing at the AOA of 25°.Spectra of velocity fluctuations along the shear layer,at the AOA of 5°are shown in Fig.13.The magnitude of PSD increases strongly in spanwise direction and has the maximum value at the vortex core.Fig.14 shows the distribution of the maximum amplitude of the PSD of the axial velocity above the wing surface for the cross plane x/c=0.6.The rapid increase of this parameter is seen at the vortex core locations.Increasing the AOA increases the value of the maximum amplitude.

Fig.12 Spectra of velocity fluctuations at vortex core(x/c=0.6,α =5°).
3.3.Vortex breakdown

Fig.13 Spectra of velocity fluctuations along shear layer(x/c=0.6,α=5°).

Fig.14 Maximum amplitude of PSD of axial velocity(x/c=0.6).
At a particular AOA(depending on the wing sweep angle),the vortices break down at the trailing edge.As the AOA increases further,the vortex breakdown point moves towards the wing apex.When the breakdown point has reached the wing apex,the flow over the wing is completely separated.23Vortex breakdown is a violent phenomenon involving a rapid deceleration of the vortex core(in the streamwise direction),a rapid increase in the vortex diameter and potentially a kink in the vortex core trajectory,a region of reversed flow and degradation of the vortex to a wake-like turbulent flow with no coherent structure.5The separated flow may have a significant effect,downstream of the flow,on other surfaces such as vertical tail.Understanding and controlling breakdown are important to alleviate structural buffeting loads.5The onset of vortex breakdown is much less abrupt for the nonslender wings,making it much more difficult than slender one to define an exact location of vortex breakdown as done in the high sweep case.3Vortex breakdown causes sudden loss of a major portion of lift and limitation in aircraft maneuverability.
The suction peak at the main vortex core is shown in Fig.15.As can be seen,the pressure coefficient at the vortex core decreases by increasing the AOA up to 15°,indicating increase of the strength of the vortex.At the AOA of 20°,the trend is reversed,and the pressure coefficient increases.The increase in Cpis indicative of the onset of vortex breakdown.This figure also shows the pressure coefficient at the main vortex core at the section x/c=0.8.The same trend is seen for this section,though the value of Cpis less than that of the section x/c=0.4,indicating that the vortex has lost its strength at this location.

Fig.15 Pressure coefficient at vortex core;different angles of attack.
The pressure distributions above the wing surface at the angles of attack of 10°,15°and 20°are shown,respectively,in Fig.16 for cross planes x/c=0.4,0.6 and 0.8.At low angles of attack,the vortices are closer to the wing surface.By increasing the AOA,the vortices become stronger and larger in size,moving away from the surface and inboard on the wing.As the vortex breakdown occurs,a rapid increase in vortex size and pressure value is seen.The flow structure changes and the dual vortex structure over the wing is not distinguishable.
The region of maximum turbulence intensity expands rapidly around the burst vortex core.24The relative turbulence intensity Tu indicates the fraction of total energy of the flow which resides in the turbulent form.The value of relative turbulence intensity is obtained via20:

The turbulence intensity field over the surface at the different angles of attack is shown in Fig.17.The turbulence intensity has a maximum value at the core of the vortex.By increasing the AOA,the maximum value increases up to the AOA of 20°,where the structure of the field is almost destructed,indicating the onset of vortex break down.

Fig.16 Pressure distribution above wing surface at different streamwise locations.

Fig.17 Turbulence intensity distribution above wing surface(x/c=0.8).
3.4.Flow over outer wing
In this type of wing,the outer wing,where the chord is much shorter than the inner wing is very highly loaded,25and the local maximum lift coefficient occurs either near the crank or slightly inboard of the wing tip.26Flow visualization of the outer wing is shown in Fig.18.Over the outboard region of the wing,a wake-like flow is observed at the AOA of 10°.The main and second vortices are formed above the surface and a separation occurs over the outboard wing.The turbulence intensity field above the surface for the cross section x/c=0.8 at α =10°is shown in Fig.19.A region of increased turbulence intensity is observable over the outer part of the wing,indicating the flow separation onset,which is consistent with the flow visualization in Fig.18.
The mean velocity above the surface for the cross section x/c=0.8 at α =10°,15°and 20°is shown in Fig.20.An intense decrease in flow velocity is initiated at the outer wing near the surface and is developed to the inner wing by increasing the AOA.This decrease in velocity indicates flow separation over the wing and is consistent with flow visualization.The flow above the outer wing is almost separated at α =15°and by increasing the AOA to 20°,almost the entire flow above the wing surface is separated.As a consequence,the flow separation on the wing is initiated from the outer wing,and is developed to the inner parts of the wing by increasing the AOA.

Fig.18 Flow visualization by smoke and laser sheet above wing surface(α=10°,x/c=0.8).

Fig.19 Turbulence intensity distribution above wing surface(α=10°).

Fig.20 Mean velocity distribution above wing surface(x/c=0.8,α =10°,15°and 20°).
3.5.Effect of leading edge shape on vortical flow
Modified aerodynamic performance can be tolerated for the multidisciplinary design constraints.For example,low observable constraints can result in smaller leading edge radii than that might be desired from a purely aerodynamic perspective.4Leading edge shape has a strong effect on flow structure of delta wings.4The effect of the leading edge shape on the aerodynamic behavior of slender delta wings is known from early works.Verhaagen et al.6have studied vortical flow structure over different leading edge shapes of delta wings.They showed that the edge shape affects the size and location of the primary vortex.It was shown that the size and strength of the primary vortex tend to reduce with increasing leading edge radius.Compared with the sharp leading edge,the rounded case moved the vortex outboard and closer to the wing surface.6Increasing the leading edge radius improves the longitudinal characteristics by retarding the formation of the leading edge vortex.This also reduces the vortex lift.27

Fig.21 Leading edge(LE)shape effect on pressure coefficient above wing surface(z/s=0.02,x/c=0.6 and α =5°).

Fig.22 Effect of leading edge shape on pressure distribution above wing surface(x/c=0.6,α =10°).
To investigate the effect of leading edge shape on vortical flow of the wing,a rounded leading edge(LE)model was also manufactured and tested.The pressure coefficient above the wing surface at the vertical section of z/s=0.02 and the streamwise plane of x/c=0.6 at α =5°is shown in Fig.21.Similarly with the ''sharpquot;edge case,two separate vortices are formed above the wing with''roundquot;leading edge.The suction peak of the vortex core is,however,higher for the former wing,indicating formation of a stronger vortex over the ''sharpquot;leading edge wing.The pressure distributions above the wing at cross plane x/c=0.6 and α =10°for''sharpquot;and''roundquot;leading edges are illustrated in Fig.22.By comparing the figures,one can conclude that a similar flow pattern for both leading edge shapes is formed above the surface,although the vortices are closer to the wing surface and weaker in strength for round one.

Fig.23 Effect of leading edge shape on pressure coefficient of main vortex core.
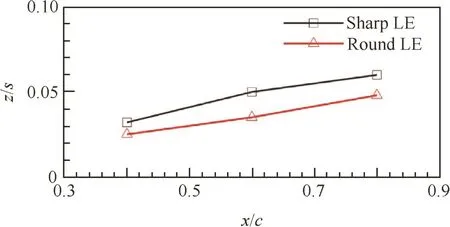
Fig.24 Effect of leading edge shape on height of main vortex core from wing surface(α =10°).
Fig.23 shows the pressure coefficients at the main vortex core against the AOA for''sharpquot;and''roundquot;leading edge shapes.The value of the pressure coefficient for''sharpquot;leading edge is less than that for the ''roundquot;one at all angles of attack;the vortex breakdown,however,occurs above 15°of AOA for both cases.The effect of leading edge shape on the height of the main vortex core from wing surface at α =10°is shown in Fig.24.Compared with the ''sharpquot;leading edge,the vortex which is formed by the shear layer is closer to the surface for''roundquot;case.
4.Conclusions
Pressure and velocity measurements above the surface were conducted on a generic cranked double delta wing using a Pitot tube and a hot wire anemometry in a closed circuit wind tunnel.The main significant results are as follows:
(1)A dual vortex structure was formed on the wing:the main vortex which was initiated from the wing apex and the second one which was smaller and formed outboard of the main vortex.
(2)A pressure drop occurred at the vortex core;by increasing the AOA the pressure drop increased.
(3)Increasing the AOA made the vortices stronger and wider,and moved the vortex flow inboard and upward.
(4)A rapid increase in the root mean square of the axial fluctuating velocity occurred at the vortex core.
(5)The magnitude of PSD increased strongly in spanwise direction,and reached the maximum value at the vortex core.
(6)As the vortex breakdown occurred,a rapid increase in vortex size and pressure value was exhibited.The flow structure changed and the dual vortex structure over the wing was not distinguishable.
(7)The flow separation on the wing was initiated from the outer wing and developed to the inner parts of the wing by increasing the AOA.
(8)Compared with the ''sharpquot;leading edge wing,the vortices were closer to the wing surface and weaker in strength for''roundquot;one.
1.Nangia RK,Palmer ME.A comparative study of two UCAV type wing planforms-performance and stability considerations.Aeronaut J 2006;10:641–58.
2.Martinez-Val R.Flying wings,a new paradigm for civil aviation.Acta Polytech 2007;47:1–12.
3.Gursul I,Gordnier R,Visbal M.Unsteady aerodynamics of nonslender delta wings.Prog Aerosp Sci 2005;41(7):515–57.
4.Luckring J.A survey of factors affecting blunt leading-edge separation for swept and semi slender wings.28th AIAA applied aerodynamics conference.Reston:AIAA;2010.p.1–34.
5.Munro CD,Krus P,Jouannet C.Implications of scale effect for the prediction of high angle of attack aerodynamics.Prog Aerosp Sci 2005;41(3–4):301–22.
6.Verhaagen NG,Elsayed M.Effects of leading edge shape on the flow over 50-deg delta wings.26th AIAA applied aerodynamics conference.Reston:AIAA;2008.p.1–15.
7.Gordnier RE,Visbal MR.Higher-order compact-difference scheme applied to the simulation of the low sweep delta wing flow.41st AIAA aerospace sciences meeting and exhibit.Reston:AIAA;2003.p.1–15.
8.Feizian M.Experimental and numerical flow study on a double delta wing[dissertation].Tehran:Malek Ashtar University of Technology;2013[in Persian].
9.Yayla S,Canopolat C,Sahin B.The effect of angle of attack on the flow structure over the nonslender lambda wing.Aerosp Sci Technol 2013;28(1):417–30.
10.Konrath R,Roosenboom WM,Schro¨der A.Static and dynamic SACCON PIV tests,part II:aft flow field.28th AIAA applied aerodynamics conference.Reston:AIAA;2010.p.1–12.
11.Lynn RJ,Gursul I.Vortex dynamics on a generic UCAV.44th AIAA aerospace sciences meeting and exhibit.Reston:AIAA;2006.p.1–18.
12.Soltani MR,Davari A.Experimental investigation of vortical flow over delta wings.Sci Res Mag Sharif Univ Technol 2002;19:3–10[in Persian].
13.Dehghan AA,Kazemi K,Manshadi MD.Natural ventilation characteristics of one-sided wind catchers:experimental and analytical evaluation.Energy Build 2013;61:366–77.
14.West GS,Aplet CJ.The effects of tunnel blockage and aspect ratio on the mean flow past a circular cylinder with Reynolds numbers between 10000 and 100000.J Fluid Mech 1982;114:361–77.
15.Jorgensen E.How to measure turbulence with hot wire anemometers.Skovlunde:Dantec Dynamics;2002.p.40–4.
16.Yavuzkurt S.A guide to uncertainty analysis of hot wire data.Fluid Eng 1984;106:181–8.
17.Wiggen S,Voß G.Development of a wind tunnel experiment for vortex dominated flow at a pitching Lambda wing.CEAS Aeronaut J 2014;5:477–86.
18.Gursul I.Review of unsteady vortex flows over delta wings.AIAA applied aerodynamics conference.Reston:AIAA;2003.
19.McCormick S,Gursul I.Effect of shear layer control on leading edge vortices.34th AIAA aerospace sciences meeting and exhibit.Reston:AIAA;1996.p.1–23.
20.Tyagi H,Liu R,Ting DSK.Measurement of wake properties of a sphere in freestream turbulence.Exp Therm Fluid Sci 2006;30(6):587–604.
21.Breitsamter C,Laschka B.Velocity measurements with hot-wires in a vortex-dominated flow field.AGARD meeting on wall interference,support interference and flow field measurements.Paris:AGARD;1993.p.1–13.
22.Yaniktepe B,Rockwell D.Flow structure on diamond and lambda planforms:trailing-edge region.AIAA J 2005;43(7):1490–500.
23.Pashilkar A.Surface pressure model for simple delta wings at high angles of attack.19th AIAA applied aerodynamics conference.Reston:AIAA;2001.p.1–11.
24.Breitsamter C.Unsteady flow phenomena associated with leading edge vortices.Prog Aerosp Sci 2008;44(1):48–65.
25.Qin N,Vavalle A,Moigne AL.Aerodynamic considerations of blended wing body aircraft.Prog Aerosp Sci 2004;40(6):321–43.
26.McParlin SC,Bruce R,Hepworth A.Low speed wind tunnel tests on the 1303 UCAV concept.24th AIAA applied aerodynamics conference.Reston:AIAA;2006.p.1–17.
27.Benoliel A.Aerodynamic pitch-up of cranked arrow wings:estimation,trim and configuration design[dissertation].Virginia:Virginia Polytechnic Institute and State University;1994.
Mojtaba Dehghan Manshadireceived his B.S.,M.S.and Ph.D.degrees in aerospace engineering from Sharif University of Technology in 2001,2004 and 2009,respectively.He is currently an associate professor in Department of Aerospace and Mechanical Engineering at Malek Ashtar University of Technology in Shahinshahr,Iran.His research interests include aerodynamic design and optimization,aerohydrodynamics,applied computational fluid dynamics and experimental aerodynamics.
21 July 2015;revised 14 September 2015;accepted 25 December 2015
Available online 26 August 2016
Cranked double delta wing;
Flow field;
Hot wire;
Leading edge shape;
Vortical flow
©2016 Production and hosting by Elsevier Ltd.on behalf of Chinese Society of Aeronautics and Astronautics.This is an open access article under the CC BY-NC-ND license(http://creativecommons.org/licenses/by-nc-nd/4.0/).
*Corresponding author.Tel.:+98 314 5225044.
E-mail address:mdmanshadi@mut-es.ac.ir(M.D.Manshadi).Peer review under responsibility of Editorial Committee of CJA.
 CHINESE JOURNAL OF AERONAUTICS2016年5期
- CHINESE JOURNAL OF AERONAUTICS的其它文章
- Flapping wing micro-aerial-vehicle:Kinematics,membranes,and flapping mechanisms of ornithopter and insect flight
- A new non-linear vortex lattice method:Applications to wing aerodynamic optimizations
- Streamwise-body-force-model for rapid simulation combining internal and external flow fields
- An artificial neural network approach for aerodynamic performance retention in airframe noise reduction design of a 3D swept wing model
- effects of wing locations on wing rock induced by forebody vortices
- Turbulent boundary layer separation control using plasma actuator at Reynolds number 2000000