
An artificial neural network approach for aerodynamic performance retention in airframe noise reduction design of a 3D swept wing model
2016-11-24 02:23ToJunSunGng
CHINESE JOURNAL OF AERONAUTICS 2016年5期
To Jun,Sun Gng
aSchool of Information Science and Technology,Fudan University,Shanghai 200433,China
bDepartment of Aeronauticsamp;Astronautics,Fudan University,Shanghai 200433,China
An artificial neural network approach for aerodynamic performance retention in airframe noise reduction design of a 3D swept wing model
Tao Juna,Sun Gangb,*
aSchool of Information Science and Technology,Fudan University,Shanghai 200433,China
bDepartment of Aeronauticsamp;Astronautics,Fudan University,Shanghai 200433,China
With the progress of high-bypass turbofan and the innovation of silencing nacelle in engine noise reduction,airframe noise has now become another important sound source besides the engine noise.Thus,reducing airframe noise makes a great contribution to the overall noise reduction of a civil aircraft.However,reducing airframe noise often leads to aerodynamic performance loss in the meantime.In this case,an approach based on artificial neural network is introduced.An established database serves as a basis and the training sample of a back propagation (BP) artificial neural network,which uses confidence coefficient reasoning method for optimization later on.Then the most satisfactory configuration is selected for validating computations through the trained BP network.On the basis of the artificial neural network approach,an optimization process of slat cove filler (SCF) for high lift devices (HLD) on the Trap Wing is presented.Aerodynamic performance of both the baseline and optimized configurations is investigated through unsteady detached eddy simulations (DES),and a hybrid method,which combines unsteady DES method with acoustic analogy theory,is employed to validate the noise reduction effect.The numerical results indicate not merely a significant airframe noise reduction effect but also excellent aerodynamic performance retention simultaneously.
1.Introduction
With the progress of high-bypass turbofan and the innovation of silencing nacelle,1engine noise of aircraft has been reduced enormously in recent decades.Airframe noise,which is defined by Crighton2as the ''non-propulsive noise of an aircraft in flightquot;,now has a comparable influence with engine noise on airport noise levels during landing and taking off operations.
For the purpose of reducing airframe noise,research institutions and scholars from all over the world have conducted a large number of projects.3NASA initiated the Quiet Aircraft Technology (QAT) project4in 2001 after the Advanced Subsonic Technology (AST)project5and proposed a noise reduction amount of 5 EPNLdB in short term and 20 EPNLdB in long term.Then,in 2009,NASA started the Environmentally Responsible Aviation(ERA)project6focusing on mature noise reduction techniques applicable in the period from 2020 to 2050.In Advisory Council for Aeronautical Research in Europe (ACARE),7compared with the noise level in 2000,EU anticipated a noise reduction amount of 10 dB before 2020 and a 65%noise decrease before 2050.
Besides the landing-gear,2high lift devices (HLD),such as leading-edge slats and trailing-edge flaps,have beenclearly proved as dominating sources of airframe noise on aircraft.8Thus,decreasing the noise of HLD makes a great contribution to the overall noise reduction of airframe noise.However,as the major lift components,any noise reduction measure for the HLD may result in an adverse impact on high-lift performance.
Taking slat noise as an example,the source of broadband slat noise is attributed to the complex flow in the cove region,which includes a recirculation zone that is subtended by a fluctuating shear layer.Reducing broadband slat noise makes an important contribution to the total noise decrease of the HLD.It is obvious that if the complex flow in the cove region does not appear,the n the relevant noise source will disappear.Such reasoning has brought about the concept of a slat cove filler (SCF),9which aims at forming substantially continuous shape instead of discontinuous slat cusp configuration.With the continuous shape,the generation of the shear layer from the slat cusp is suppressed,and longitudinal vortices in the slat cove should be weakened.Thus,the effect of broadband noise reduction is expected to be achieved.Scholars from all over the world have conducted a series of researches to validate the noise reduction effect of SCF.10–13Choudhari et al.10mounted an SCF to the 2D EET HLD,and measured the effect on airframe noise of the SCF in the Langley Low-Turbulence Pressure Tunnel.Kolb et al.11carried out aeroacoustic wind tunnel measurements on a 2D high-lift configuration and investigated the noise reduction effect of the SCF.Horne et al.12installed a SCF on a 26%scale Boeing 777 model,and measured the effect on airframe noise of the SCF in the 40 ftX80 ft(1 ft=0.3048 m)wind tunnel of NASA Ames.Streett et al.13setup a SCF on the Trap Wing model,and investigated the noise reduction effect of the SCF in the 14 ftX22 ft subsonic wind tunnel of NASA Langley.Results of these researches indicated that SCF can reduce airframe noise effectively.
Nonetheless,other researches14–16have reported that aerodynamic performance,especially the maximum lift coefficient and the stall angle,may be decreased with the SCF.For the purpose of retaining aerodynamic performance of the SCF configuration,some previous researches have been conducted.For 2D HLD,the shape of SCF is generally designed to be the same as the streamline at a specific angle of attack(AOA).Imamura et al.17of JAXA designed two SCF configurations based on two streamlines under relevant AOAs and the n the final design con figuration was determined by wind tunnel experiments, finding out the aerodynamic performance of which is nearest to that of the baseline con figuration.A variety of researches revealed that aerodynamic performance at offdesign AOAs are very difficult to retain.For 3D HLD on a swept wing,it is impossible to design an SCF as the shape of a specific streamline and it has enhanced the difficulty to retain aerodynamic performance.
Since with the SCF,approaches at the current time for retaining aerodynamic performance of 3D HLD on a swept wing,are almost tentative,and systemic design approaches of SCF have not evolved,retaining the aerodynamic performance for 3D case with SCF is much more important and significative worthy of deep investigate.Given this,the artificial neural network is introduced to achieve the aim of retaining the aerodynamic performance of the 3D SCF configuration on a swept wing.For the 3D case,the design work is more difficult and challenging due to the more design variables,which lead to the more difficulties in establishing database and the artificial neural network.
Firstly,a database of SCF configurations is established and the one with the best aerodynamic performance is selected as there ference configuration.Secondly,the direction of optimization is ascertained through confidence coefficient reasoning method and a number of optimized configurations are generated from the reference configuration accordingly.Thirdly,a back propagation(BP)neural network is established and trained by SCF configurations in the database as the training samples,which enables a quick prediction of the aerodynamic performance for all the optimized configurations;Finally,the optimized configuration with the best aerodynamic performance is selected as the final optimized configuration for validating computations.Aerodynamic performance of both the baseline and optimized configurations is evaluated through unsteady detached eddy simulation(DES)method,18while the noise reduction effect is validated through a hybrid method combining unsteady DES method with acoustic analogy theory.
This article is organized as follows.In Section 2,the design approach based on artificial neural network is described.In Section 3,governing equations and numerical methods are introduced.In Section 4,validation of the computational codes is conducted.In Section 5,on the basis of the artificial neural network approach,an optimization process of SCF for HLD on the Trap Wing is presented.In Section 6,validating computations are implemented to investigate the effect of the SCF on both aerodynamic and acoustic performance.Finally,in Section 7,some conclusions are drawn according to the previous results and analyses.
2.Artificial neural network approach
The approach for retaining aerodynamic performance of the SCF configuration is based on artificial neural network and the concrete design steps are set as follows:(A)establish a database of SCF configurations,including both the geometry and aerodynamic parameters for each SCF configuration;(B)in the database,select the SCF configuration with the best aerodynamic performance as the reference configuration and analyze the database through confidence coefficient reasoning method to ascertain the direction of optimization;(C)according to the direction ascertained in step 2,generate a number of optimized configurationson the basis of the reference configuration;(D)setup a BP neural network according to the geometry and aerodynamic parameters and the n train the BP network by taking SCF configurations in the database as the training samples;(E)predict aerodynamic performance of all the optimized configurations quickly by the trained BP network;(F)select the optimized configuration with the best aerodynamic performance as the final optimized configuration and the n conduct validating computations to investigate the effect of the final design SCF on both aerodynamic and acoustic performance.
The database consists of geometry parameters I and aerodynamic parameters O,and it can be written in the form of matrix as follows:

where ai(i=1,2,...,n)is the design variable representing the geometry parameter,while bi(i=1,2,...,m)represents the aerodynamic parameter.The subscript n is the number of geometry parameters,m the number of aerodynamic parameters,and p the number of SCF configurations in the database.For the purpose of retaining aerodynamic performance,target of the optimization is set to make bi(i=1,2,...,m)as superior as possible.
Among all SCF configurations in the database,the SCF configuration with the best aerodynamic performance is selected as the reference configuration for optimization later on.In order to ascertain the direction of optimization,confidence coefficient reasoning method19is adopted to the database.The related coefficient between a geometry parameter and an aerodynamic parameter is expressed as

where ai,biare the two groups of variables,andare arithmetic mean values of aiand bi,respectively.
Thus,according to the value of r(ai,bi),how to vary aito make bimore superior is obtained.In other words,the direction of optimization is ascertained.According to the direction of optimization,a number of optimized configurations are generated on the basis of the reference configuration.
To predict aerodynamic performance of all the optimized configurations quickly,a BP artificial neural network is employed.The BP network shown in Fig.1 is established according to the geometry and aerodynamic parameters in the database.Here n is the number of nodes in the input layer,namely geometry parameters,and m is the number of nodes in the output layer,namely aerodynamic parameters.

Fig.1 Structure of BP artificial neural network.
The BP network should be trained before predicting aerodynamic performance of all the optimized configurations,and SCF configurations in the database are selected as the training samples.After aerodynamic performance of all the optimized configurations is predicted by the BP network,the optimized configuration with the best predicted aerodynamic performance is selected as the final optimized configuration for validating computations.
3.Governing equations and numerical methods
In this study,unsteady simulations based on DES method are performed to investigate aerodynamic performance for both the baseline and optimized configurations.In the DES solver,the DES method is implemented on Spalart-Allmaras (S-A) turbulent model,20and the Roe's scheme21is adopted in spatial discretization while dual time stepping method with a pseudo time sub-iteration21is adopted in time marching.
As is well known,Ffowcs Williams Hawkings (FWH)22equation is widely employed in far field sound pressure level (SPL) prediction and it can be solved through Farassat 1A formula23shown in Eqs.(3)and(4).

where p′is the acoustic pressure,the subscript 'T' and 'L' represent the thickness noise and the loading noise,respectively;ρ0is the constant density,c0is the speed of sound;the dot above the variables represents the time derivative,the subscript 'ret' represents value at the retard time;Miis the local Mach number,niis the local normal,riis the retarded radius,r is the magnitude value of ri,and

Farassat 1A formula is available for calculation of thickness noise and loading noise,but is not applicable for calculation of quadrupole noise in the nonlinear area.For the purpose of calculating quadrupole noise,the FWHpdsequation24with a porous integral surface is employed in acoustic analogy theory.
The FWHpdsequation is expressed as

where

Compared with the classical FWH equation,Uiand Liare redefined here.By redefining Uiand Li,a porous integral surface including nonlinear area is adopted so that quadrupole noise in the nonlinear area is attainable.Since the form of the FWHpdsequation is not different from that of the classical FWH equation,Farassat 1A formula is still available for solving FWHpdsequation.Flow field information on the integral surface is transmitted from the CFD meshes through an isoparametric transformation method.25
4.Validation of computational codes
In order to verify the reliability of the computational codes,3D numerical simulations on both aerodynamic and acoustic performance are performed to EET HLD and the computational results are compared with the experimental results.
Fig.2 shows the schematic of 2D EET HLD,of which the slat and flap deflection angles are both 30°.

Fig.2 Schematic of 2D EET HLD.

Fig.3 2D computational grid of baseline configuration around slat region.
In order to obtain aerodynamic performance of the EET HLD,3D unsteady computations based on DES method are implemented to simulate the complex flow around the HLD,especially near the stall point.Fig.3 shows the 2D computational grid around the slat region;the 3D grid is stretched from the 2D grid along the span direction by 0.05 times of the chord length,and the number of grid nodes is set to be 35 in the span direction.Cell number of the entire computational domain is about 16 million and the computational condition is set as Ma=0.2,Re=9.0X10⁶For the DES simulation,periodic boundary condition is applied to the spanwise direction to allow the development of three-dimensional vortical flow structure inside the slat cove.
The experimental study was conducted in the NASA Langley Low-Turbulence Pressure Tunnel to determine the effects of Reynolds number and Mach number on the EET HLD.26Fig.4 shows the mean-lift curve of the computational results compared with the experimental lift results,26where CLis the lift coefficient,α is the angle of attack.The two lift curves are basically the same,stall angles of the two curves are both 22°,and the maximum lift coefficients of the two curves are very close;the experimental maximum lift coefficient is 4.57 while the computational one is 4.56.
To consider quadrupole noise,a porous integral surface shown in Fig.5 is employed for solving FWHpdsequation.

Fig.4 Lift coefficient curves comparison of EET HLD.26

Fig.5 Porous integral surface of EET HLD for solving FWHpds equation.
The acoustic experiment for EET HLD was conducted in the NASA Langley Low-Turbulence Pressure Tunnel in 1998 to explore some noise-reduction technologies for flap-sideedge noise and the n examine slat noise.27In the experiment,the observer location is positioned a distance d=2c down from the slat trailing edge,where the chord length of EET HLD c=0.55 m.Fig.6 shows the computational 1/12 octave spectrum SPL results compared with the experimental ones,27the maximum computational frequency is 20000 Hz which is also the highest frequency of noise people can hear.As for 1/12 octave spectrum results,the computational results are in agreement with the experimental ones in the computational frequency range,and the maximum error is less than 5 dB within the frequency range of 20000 Hz.Comparing the computational 1/12 octave SPL spectrum with the experimental one,it is shown that both the maximum SPLs and the positions of the maximum SPLs are close to each other in the computational frequency range.The maximum experimental SPL is 85.5 dB at about 1189 Hz in the computational frequency range,while the maximum computational SPL is 84.8 dB at about 1059 Hz in the computational frequency range.
Therefore,as can be seen from Figs.4 and 6,the computational results of both aerodynamic and acoustic performances are in agreement with the experimental ones in the computational range.In other words,the computational codes have a high reliability in evaluating both the aerodynamic and acoustic performances.
5.Optimization process
To verify the artificial neural network approach,a process of SCF design for HLD on the Trap Wing28is presented.Fig.7 shows semi-model of the swept Trap Wing,the model consists of a body and a three-element wing.The deflection angle of the slat and flap are 30°and 25°,respectively.The mean aerodynamic chord length is 1.006 m and the semi span 2.16 m.

Fig.6 Comparison of 1/12 octave SPL spectrum results for EET HLD.

Fig.7 Schematic of swept Trap Wing.
Unlike the 2D HLD,SCF of the 3D HLD is a smooth surface,of which the shape depends on the control sections.Considering twist angle and dihedral angle of the 3D slat,three control sections are configured to ensure smoothness and design efficiency for the SCF.As shown in Fig.8,the three control sections are located at slat root,slat center,and slat tip,respectively,and the SCF surface is shaped by connecting the three SCF curves at the control sections through nonuniform rational B-splines(NURBS)method.29
SCF curve at each control section is connected by six points for the design through cubic spline with the parameter of cumulative chord length.Fig.9 shows the SCF curve at the control section of slat tip,x10,x15,and all coordinates in the y direction are given as conditions of known, x1j(j=1,2,3,4)is the design variable,while xs1j(j=1,2,3,4)is the coordinate in the x direction of the parallel corresponding point on the lower surface of the slat.For SCF curves at control sections of slat center and slat root,the corresponding definitions are also given.It is worth mentioning that all coordinates in the y direction are disposed with normalization.

Fig.8 Locations of three control sections.

Fig.9 SCF curve and control points at control section of slat tip.
During the optimization process,the design variable xij(i=1,2,3;j=1,2,3,4)is set to satisfy the constraints as follows:

In order to acquire aerodynamic performance of the baseline configuration,unsteady DES simulations are implemented.Fig.10 shows the computational grid of the baseline configuration around the model;cell number of the entire computational domain is about 42 million and the computational condition is set as Ma=0.2,Re=4.2X10⁶.
The Trap Wing model was tested in the NASA Langley 14 ftX22 ft Subsonic Tunnel for approximately five doubleshift weeks during the fall of 1998.The test was a joint test between the AST High Lift Program and the AST Airframe Noise Program.The purpose of the test was to establish the characteristics of this model and to obtain an atmosphere,low pressure wind tunnel wall interference data set that could be corrected to free air conditions.30
Fig.11 shows the mean-lift curve of the computational results compared with the experimental ones30for the baseline configuration.The computational curve agrees fairly well with the experimental one,the computational stall angle is 33°while the experimental one is 32.942°and the computational maximum lift coefficient is 3.01 while the experimental one is 2.9955.

Fig.10 Computational grid of Trap Wing baseline configuration around the model.

Fig.11 Lift coefficient curves comparison of Trap Wing baseline configuration.30

Fig.12 Drag coefficient curves comparison of Trap Wing baseline configuration.30
Fig.12 shows the mean-drag curve of the computational results comparing with the experimental ones30for the baseline configuration,where CDis the drag coefficient.In the AOA rangefrom 0°to 30°,the computational drag coefficients are basically the same as the experimental ones,while in the AOA rangefrom 30°to 35°,the computational drag coefficients are slightly greater than the experimental ones.
As can be seen from the lift and drag results,for the Trap Wing baseline configuration,the computational aerodynamic performance agrees well with the experimental one.
As the target of this study is to maintain the aerodynamic performance during noise reduction design,i.e.,the target in this paper is not to find a configuration of the best performance but to find a configuration satisfying the design objective.As stated in the instruction,the most serious aerodynamic problems with the SCF are decrease of the stall angle and the maximum lift coefficient.To retain the stall angle and the maximum lift coefficient,set the design point as α =33°,Ma=0.2,Re=4.2X10⁶,the n the design objective of the SCF is to make lift coefficient of the optimized configuration larger than or very close to that of the baseline con figuration at the design point.
The database shown in Tables 1–4 includes 44 SCF configurations.Tables 1–3 show the geometric parameters of the SCF configurations on the control sections of the slat tip,the slat center and the slat root,respectively,where xij(i=1,2,3;j=1,2,3,4)satisfies constraints Eq.(8).Table 4 shows the aerodynamic parameters of the SCF configurations in the database,where CLdesignis the mean-lift coefficient at the design point.CLdesignfor each configuration is acquired through unsteady DES simulations,and cell number of the entire computational domain is about 39 million for each configuration.
Table 5 shows the related coefficients between CLdesignand xij(i=1,2,3;j=1,2,3,4).As can be seen from the related coefficients,CLdesignhas a strongly negative correlation with x11,x12,x13,x21,x22,x23,x32,x33,x34,and does not have a strong relation with x14,x24and x31.In other words,CLdesignincreases to a great extent with the decrease of x11,x12,x13,x21,x22,x23,x32,x33,x34,and changes little with the variations of x14,x24and x31.Hence,the direction of optimization is confirmed as:decrease x11,x12,x13,x21,x22,x23,x32,x33,x34,and keep x14,x24,x31unchanged.
To predict aerodynamic performance of all the optimized configurations quickly,the BP network is established with 12neurons,namely x11,x12,x13,x14,x21,x22,x23,x24,x31,x32,x33,x34in the input layer,8 neurons in the hidden layer,and 1 neuron,namely CLdesign,in the output layer.

Table 1 Geometric parameters of SCF configurations on control section of slat tip.

Table 2 Geometric parameters of SCF configurations on control section of slat center.
To train the BP network,SCF configurations from No.1 to No.22 in the database are regarded as the training samples,and SCF configurations from No.23 to No.44 in the database are selected to verify the trained BP network.Table 6 shows the comparison of CLdesignbetween the predicted results and the computational results for SCF configurations from No.23 to No.44 in the database;as can be seen,the maximum error is only 0.209%,so the trained BP network has a great capacity for predicting CLdesign.
In the database,CLdesignof configuration No.22 is maximal among all the SCF configurations,so SCF configuration No.22 is selected as the reference configuration.According to the ascertained direction of optimization,a number of optimized configurations are generated on the basis of the reference configuration.

Table 3 Geometric parameters of SCF configurations on control section of slat root.

Table 4 Aerodynamic parameters of SCF configurations in database.
For the convenience of distinguishing all the optimized configurations,function g(x)is defined as follows:

where weight wij(i=1,2,3;j=1,2,3,4)is given by experience considering constraints Eq.(8)and geometrical error,xij(i=1,2,3;j=1,2,3,4)is the design variable of the optimized configuration,while xrij(i=1,2,3;j=1,2,3,4)is the design variable of the reference configuration.
Fig.13 shows the predicted CLdesignof the optimized configurations by BP network.Among all the optimized configurations,the maximal CLdesignis 3.006,which is almost the same as that of the baseline configuration,namely 3.01.Hence,the optimized configuration with the maximal CLdesignis selected as the final optimized configuration for validating computation.

Table 5 Related coefficients between CLdesign and xij.

Table 6 Comparison between predicted and computational results for SCF from No.23 to No.44 in the database.

Fig.13 Predicted CLdesignof optimized configurations by BP network.
6.Validating computations
Unsteady DES simulations are performed to evaluate aerodynamic performance of the optimized configuration.Cell number of the entire computational domain is about 39 million,and the computational condition issetas:Ma=0.2,Re=4.2X10⁶.

Fig.14 Lift coefficient curves of both baseline and optimized configurations.

Fig.15 Drag coefficient curves of both baseline and optimized configurations.

Fig.16 Porous integral surface of Trap Wing for solving FWHpdsequation.
Fig.14 shows the lift results,including experimental lift curve of the baseline configuration,computational mean-lift curve of the baseline configuration and computational meanlift curve of the optimized configuration.As shown in Fig.14,the computational curve of the optimized configuration agrees fairly well with that of the baseline configuration.In view of computational results,stall angles of the baseline and optimized configurations are both 33°,and maximum meanlift coefficient of the optimized configuration is 3.01,which is just the same as that of the baseline configuration.

Fig.17 Three-section locations in span direction.
Fig.15 shows the drag results,including experimental drag curve of the baseline configuration,computational mean-drag curve of the baseline configuration and computational mean-drag curve of the optimized configuration.In view of computational results,in the AOA range from 0°to 31°,drag coefficients of the optimized configuration are basically consistent with those of the baseline configuration,and in the AOA range from 31°to 35°,drag coefficients of the optimized configuration are slightly less than those of the baseline configuration.
Therefore,as can be seen from the lift and drag results,aerodynamic performance of the optimized configuration is basically the same as that of the baseline configuration.In other words,aerodynamic performance is retained.
Based on the hybrid method combining unsteady DES method with acoustic analogy theory,simulations for both the baseline and optimized configurations are performed to verify the noise reduction effect.The computational condition is set as Ma=0.2,α =13°,Re=4.2X10⁶,Δt=2.5X10⁻⁵s.
Fig.16 shows the porous integral surface which is employed for solving FWHpdsequation.The porous integral surface with the body,the three-element HLD and the wake region inside is employed to calculate the quadrupole noise.
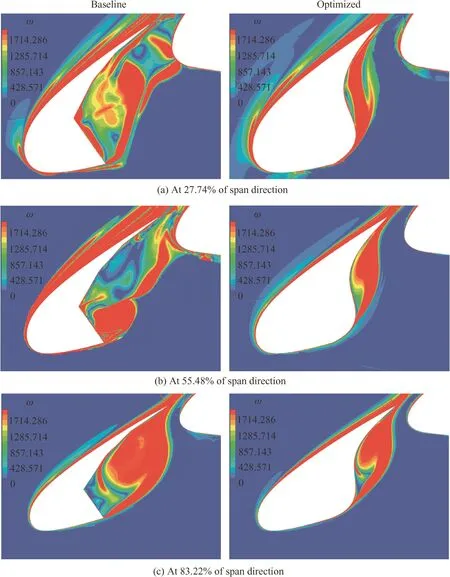
Fig.18 Vorticity magnitude distribution comparison of baseline configuration and optimized configuration.

Fig.19 OASPL directivity comparison between baseline configuration and optimized configuration.
Three sections are selected to observe variations of the flow with the SCF.As shown in Fig.17,the three sections are located at 27.74%,55.48%and 83.22%of the span direction,respectively.Fig.18 shows vorticity magnitude ω distribution comparisons between the baseline configuration and the optimized configuration at t=0.2 s.As for each section of the baseline configuration,there is an obvious shear layer at the slat cusp which leads to a large vorticity magnitude area existing in the slat cove region.By contrast,as for each section of the optimized configuration,the shear layer is suppressed so significantly that the high vorticity magnitude area is compressed greatly,as a result,not only vorticity magnitude in the filled area disappears,but also vorticity magnitude in the rest of the slat cove region is decreased.The shear-layer causes very strong unsteady fluctuations on the leading edge of the wing body and leads to the most intense acoustic source region,and the decrease of the vorticity magnitude in the slat cove region is caused by the reduction of shear-layer impingement.The disappearance of this important acoustic region in the SCF configuration will definitely reduce the airframe noise.Hence,the effect of noise reduction is achieved.
To acquire acoustic directivity comparison between the baseline configuration and the optimized configuration,72 observation points are distributed evenly on a circle,of which the center is the body central point and the radius is 10 m.Fig.19 shows the overall sound pressure level(OASPL)comparisons on the circle between the baseline configuration and the optimized configuration.OASPL directivities of both the baseline and optimized configuration present an approximate quadrupole distribution,but because of the SCF,the directions of the directivities are different from each other.In each direction,OASPL of the optimized configuration is lower than that of the baseline configuration.Among all the 72 directions,noise reduction amount is the most significant in the direction of 205°,which reaches to 18 dB.
For the purpose of investigating the noise reduction effect in the spectrum range,three observation points below the Trap Wing are selected,which are located in the direction of 225°,270°and 315°on the circle.Fig.20 shows the 1/3 octave spectrum SPL comparison between the baseline configuration and the optimized configuration at the three selected observation points.

Fig.20 1/3 octave spectrum comparison of SPL.
Form Fig.20,in the frequency range from 20 Hz to 20000 Hz,SPLs of the optimized configuration are almost all lower than those of the baseline configuration,especially in the low frequency rang.The maximum SPLs of the baseline configuration in the computational range are 81.0 dB,80.3 dB and 81.3 dB,respectively,for the three observer locations,while that of the optimized configuration are 70.9 dB,72.4 dB and 72.3 dB,respectively.From the perspective of the greatest noise reduction amount at the single frequency,the y are 14.4 dB,12.6 dB and 11.5 dB,respectively,for the three observer locations.
For the three selected observation points,the noise reduction effects are significant in the computational frequency range and the maximum SPLs in the computational frequency range are all decreased obviously.
Therefore,as can be seen from the directivity results and spectrum results,the effect of noise reduction is achieved while the aerodynamic performance is retained with the designed SCF.
7.Conclusions
For the purpose of retaining aerodynamic performance of SCF configuration for the 3D HLD on a swept wing,a design approach based on artificial neural network is introduced.First,a database of SCF configurations is established and the n the database is analyzed through confidence coefficient reasoning method to ascertain the direction of optimization.Next,on the basis of the reference configuration selected in the database,a number of optimized configurations are generated according to the direction,the n a BP artificial neural network is established and trained by taking SCF configurations in the database as the training samples.Finally,aerodynamic performance of all the optimized configurations is predicted quickly by the trained BP network,and the optimized configuration with the best aerodynamic performance is selected as the final optimized configuration for validating computations.To verify the artificial neural network approach,a process of designing SCF for HLD on the Trap Wing is presented.
As for the validating computations,unsteady DES simulations are performed to investigate aerodynamic performance of both the baseline and optimized configurations.And the noise reduction effect is verified by a hybrid method combining unsteady DES method with acoustic analogy theory.The simulative results indicate that the aerodynamic performance is retained by the optimized configuration with a significant airframe noise reduction effect.
Acknowledgement
The work was supported by the National Basic Research Program of China(No.2014CB744800).
1.Gorji-Bandpy M,Azimi M.Technologies for jet noise reduction in turbofan engines.Aviation 2012;16(1):25–32.
2.Crighton DG.Airframe noise.Aeroacoustics of flight vehicles:theory and practice.Volume 1:noise sources,vol.1;1991.p.391–447.
3.Deng YJ,Duan ZY,Hou YZ.Current status and future trend for aero-acoustics research on high-lift devices.Adv Aeronaut Sci Eng 2012;4:3[Chinese].
4.Manneville A,Pilczer D,Spakovszky ZS.Preliminary evaluation of noise reduction approaches for a functionally silent aircraft.J Aircraft 2006;43(3):836–40.
5.Janardan BA,Hoff GE,Barter JW.AST critical propulsion and noise reduction technologies for future commercial subsonic engines:separate-flow exhaust system noise reduction concept evaluation.Washington,D.C.:NASA;2000.Report No.:NASA/CR-2000-21003.
6.Collier F.Overview of NASA's environmentally responsible aviation(ERA)project.NASA environmentally responsible aviation project pre-proposal meeting.Washington,D.C.:NASA;2010.
7.Wilfert G,Sieber J,Rolt A.New environmental friendly aero engine core concepts.2007.Report No.:ISABE 1120.
8.Soderman PT,Kafyeke F,Burnside NJ.Airframe noise study of a CRJ-700 Aircraft Model in the NASA Ames 7-by 10-foot wind tunnel No.1.Reston:AIAA;2002.Report No.:AIAA-2002-2406.
9.Lockhard DP,Lilley GM.The airframe noise reduction challenge.Washington,D.C.:NASA;2004.Report No.:NASA-2004-213013.
10.Choudhari MM,Lockard DP,Macaraeg MG.Aeroacoustic experiments in the NASA Langley Low-Turbulence Pressure Tunnel.Washington,D.C.:NASA;2002.Report No.:NASA-2002-211432.
11.Kolb A,Faulhaber P,Drobietz R.Aeroacoustic wind tunnel measurements on a 2d high-lift configuration.Reston:AIAA;2007.Report No.:AIAA-2007-3447.
12.Horne WC,James KD,Arledge TK.Measurements of 26%-scale 777 airframe noise in the NASA Ames 40-by 80 Foot Wind Tunnel.Reston:AIAA;2005.Report No.:AIAA-2005-2810.
13.Streett CL,Casper JH,Lockard DP.Aerodynamic noise reduction for high-lift devices on a swept wing model.Reston:AIAA;2006.Report No.:AIAA-2006-0212.
14.Andreou C,Graham W,Shin HC.Aeroacoustic study of airfoil leading edge high-lift devices.Reston:AIAA;2006.Report No.:AIAA-2006-2515.
15.Shmilovich A,Yadlin Y,Pitera DM.Wing leading edge concepts for noise reduction.27th international congress of the aeronautical sciences;2010.p.5009–20.
16.Shmilovich A,Yadlin Y.High-lift systems for enhanced takeoff performance.28th international congress of the aeronautical sciences;2012.
17.Imamura T,Ura H,Yokokawa Y.Designing of slat cove filler as a noise reduction device for leading-edge slat.Reston:AIAA;2007.Report No.:AIAA-2007-3473.
18.Spalart PR,Jou WH,Stretlets M,Allmaras SR.Comments on the feasibility of LES for wings and on the hybrid RANS/LES approach.Proceedings of the first AFOSR international conference on DNS/LES;1997.p.137–47.
19.Chen J,Sun G,Jin X.Intelligent aerodynamic design for airfoil based on artificial neural network method.The 2nd international conference on computer and automation engineering,vol.5;2010.p.289–93.
20.Liu J,Sun HS,Liu Z,et al.Numerical investigation of unsteady vortex breakdown past 80/65 double-delta wing.Chin J Aeronaut 2014;27(3):521–30.
21.Yang XQ,Cheng SK,Yang AM,Sun G.Time spectral method for numerical simulation of unsteady viscous flow over oscillating airfoil and wing.Acta Aeronaut Astronaut Sin 2013;34(4):787–97[Chinese].
22.Wang X,Sun X.Transfer element method with application to acoustic design of aeroengine nacelle.Chin J Aeronaut 2015;28(2):327–45.
23.Farassat F.Derivation of formulations 1 and 1A of farassat.Washington,D.C.:NASA;2007.Report No.:NASA/TM-2007-214853.
24.di Francescantonio P.A new boundary integral formulation for the prediction of sound radiation. J Sound Vib1997;202(4):191–509.
25.Xu KL.Subsection evolution optimal design of 3D high-lift systems for civil aircraft based on conservative chimera technique[dissertation].Shanghai:Fudan University;2012[Chinese].
26.Morgan HL.Experimental test results of energy efficient transport (EET) high-lift airfoil in Langley Low-Turbulence Pressure Tunnel.Washington,D.C.:NASA;2002.Report No.:NASA/TM-2002-211780.
27.Choudhari MM,Lockard DP,Macaraeg MG.Aeroacoustic experiments in the Langley Low-Turbulence Pressure Tunnel.Washington,D.C.:NASA;2002.Report No.:NASA/TM-2002-211432.
28.Slotnick JP,Hannon JA,Chaffin M.Overview of the first AIAA CFD high lift prediction workshop.Reston:AIAA;2011.Report No.:AIAA-2011-0862.
29.Jin X.Application of intelligent methods in the design of civil aircraft cruise configuration [dissertation].Shanghai:Fudan University;2012[Chinese].
30.Slotnick JP,Hannon JA,Chaffin M.Overview of the first AIAA CFD high lift prediction workshop.Reston:AIAA;2011.Report No.:AIAA-2011-0862.
Tao Junis a post doctor at Department of Aeronautics and Astronautics,Fudan University.His area of research includes flight vehicle design,aeroacoustics and design aerodynamics.
Sun Gangis a professor and Ph.D.supervisor at Department of Aeronautics and Astronautics,Fudan University.His area of research includes flight vehicle design,aero-engine design,computational aerodynamics,design aerodynamics,coating aerodynamics and industrial fluid mechanics.
24 September 2015;revised 10 December 2015;accepted 11 January 2016
Available online 26 August 2016
Aerodynamic performance retention;
Airframe noise;
Artificial neural network;
Noise reduction;
Slat cove filler
©2016 Production and hosting by Elsevier Ltd.on behalf of Chinese Society of Aeronautics and Astronautics.This is an open access article under the CC BY-NC-ND license(http://creativecommons.org/licenses/by-nc-nd/4.0/).
*Corresponding author.Tel.:+86 21 65642740.
E-mail address:gang_sun@fudan.edu.cn(G.Sun).
Peer review under responsibility of Editorial Committee of CJA.
 CHINESE JOURNAL OF AERONAUTICS2016年5期
- CHINESE JOURNAL OF AERONAUTICS的其它文章
- Flapping wing micro-aerial-vehicle:Kinematics,membranes,and flapping mechanisms of ornithopter and insect flight
- A new non-linear vortex lattice method:Applications to wing aerodynamic optimizations
- Experimental study of flow field distribution over a generic cranked double delta wing
- Streamwise-body-force-model for rapid simulation combining internal and external flow fields
- effects of wing locations on wing rock induced by forebody vortices
- Turbulent boundary layer separation control using plasma actuator at Reynolds number 2000000