
Modelling home advantage for individual teams in UEFA Champions League football
2017-09-21 11:54ChrisGoumas
Chris Goumas
Sydney School of Public Health,The University of Sydney,Sydney,NSW 2006,Australia
Modelling home advantage for individual teams in UEFA Champions League football
Chris Goumas
Sydney School of Public Health,The University of Sydney,Sydney,NSW 2006,Australia
Background:Home advantage(HA)is well documented in a wide range of team sports including association football(soccer).Although much attention has been paid to differences in the overall magnitude of HA between football competitions and across time,few studies have investigated HA at the team level.
Methods:A novel method of estimating HA for individual teams,based solely on home performance,was used to compare HA between the highest performing teams and countries in the Union of European Football Associations(UEFA)Champions League over a 10-year period (2003/2004 to 2012/2013).Away disadvantage(AD)was also estimated based on each team’s performance away from home.Poisson regression analysis was used to estimate covariate adjusted HA and AD in terms of the percentage of goals scored at home(HA)and conceded away from home(AD).
Results:When controlling for differences in team ability,HA did not vary signi ficantly between the 13 selected teams.There was evidence (p<0.1),however,of between-team variation inAD,ranging from 45%(away advantage)to 68%(away disadvantage).When teams were grouped into the 11 selected countries,both HA andAD varied signi ficantly(p<0.02)between countries:HA ranged from 52%forTurkish teams to 70% for English teams,while AD ranged from 52%(France)to 67%(Turkey).
Conclusion:Differences in style of play and tactical approaches to home and away matches may explain some of the variation in HA and AD between teams from different countries.
©2017 Production and hosting by Elsevier B.V.on behalf of Shanghai University of Sport.This is an open access article under the CC BY-NC-ND license(http://creativecommons.org/licenses/by-nc-nd/4.0/).
Football;Home advantage;Modelling;Soccer
1.Introduction
Home advantage(HA)is the tendency for sporting teams to perform better at their home ground than away from home,and its existence has been well established in a wide range of team sports including association football.1,2Although much attention has been paid to differences in the overall magnitude of HA between football competitions3–5and across time,2relatively few studies have investigated HA at the individual team level, and this is the focus of the present study.
In a sporting competition where each team plays each other the same number of times both home and away,differences in team ability balance out over the season and therefore do not bias calculations of total HA across the whole competition.6HAfor an individual team,however,will be largely determined by its ability relative to other teams in the competition;that is,a stronger team will be expected to win more matches at home than a weaker team.Team ability therefore needs to be controlled for when estimating HA for individual teams.
In the first comprehensive investigation into HA at the team level in football,Clarke and Norman6compiled 10 years of match data for 94 teams across 4 divisions of English football. HA for individual teams was calculated as a function of home and away goal difference and total HA across the whole division.Although this results in each team’s HA being in fluenced by the HAs of all the other teams in the competition,the authors showed that this method controls for differences in team ability. A regression analysis found some evidence of variation in HA between teams,as well as for London teams having lower HA. There was strong evidence,however,for HA being higher for teams playing on arti ficial pitches,suggesting that home ground familiarity was playing a role.
Another method of estimating HA for individual sporting teams was developed by Pollard and Gomez,7originally for basketball,and subsequently applied to football teams in 4 countries in South-West Europe.8To control for team ability, the raw calculated HA—based on both home and away performance—for each team was regressed on a measure of that team’s ability.The residual value for each team(i.e.,the difference between its observed HA and the expected HA for a team of that ability)was then added or subtracted from the total HA for all teams in the competition.Like the Clarke and Norman6method described above,this approach produces HA estimates which are in fluenced by the HAs of other teams. Highly signi ficant differences in HA between teams were observed in France,Italy,and Portugal,although there was little evidence of variation in HA between Spanish teams.Teams from ethnically and/or culturally distinct locations in France and Italy had greater HA than the rest of the teams in those countries,suggesting that territoriality and/or travel factors may be playing a role.However,such regional effects were not observed for teams in Portugal or Spain.Teams from capital cities in each country except Italy had signi ficantly lower HA than teams from other areas.
The Pollard and Gomez7method of estimating HA for individual teams has also been used in studies of Brazilian and Greek football.In the First Division of the Brazilian football league,signi ficant variation in HA between teams was observed.9In particular,teams in the north and south of Brazil had signi ficantly higher HA than those from the central region; effects of travel and change in climate were suggested as possible explanations.Signi ficant between-team variation in HA was also observed in the Greek Superleague,10with teams based inAthens showing less HA than those in the rest of Greece;the authors suggested that the sense of territorial protection may be less for teams in capital cities.
The present study introduces a novel method of estimating HA for individual teams,based solely on home performance and hence independent of the HAs of other teams in the competition.Away disadvantage(AD)is also estimated,based on a team’s performance away from home.Multivariate regression techniques are used to control for team ability.Ten years of match data from the Union of European Football Associations (UEFA)Champions League—an international club competition featuring the best teams from over 25 European countries—were used to estimate HA andAD for a selection of the highest performing teams and countries over this period.This is the first study to investigate HA for individual teams in the UEFA Champions League.
2.Materials and methods
2.1.Data
The data used in this study were matches from the 2003/ 2004 to 2012/2013 seasons of the UEFA Champions League. Entry into this competition is based on a team’s performance in their domestic league the previous season.The Champions League consists of a round-robin group stage,followed by a knock-out finals stage.All matches except the final are played in pairs,1 at each team’s home ground.Each of the group stage matches is decided on its own,whereas matches in the finals stage(except the final)are decided over 2“legs”.The final match in each season was excluded from the analysis as it was played at a neutral venue where there is no HA to be gained. Matches between AC Milan and Inter Milan(n=2)were also excluded as these teams share the same home ground.Teams playing at least 50 matches over the 10-year study period(13 teams;1058 matches)and countries whose teams played at least 75 matches between them(11 countries;2028 matches)were chosen for the analysis.This selection method maximises the statistical power of the analysis,and results in the highest performing teams and countries being chosen.All match data were downloaded from the of ficial UEFA website(www.uefa. com).
2.2.Analysis
HA for each individual team was estimated as the percentage of goals scored in home matches by that team.For example,if a team scored 50 goals in their home matches and conceded 30,then their unadjusted HA would be 50/(50+30)×100%= 62.5%.Correspondingly,AD for each team was estimated as the percentage of goals conceded in away matches.HA greater than 50%represents superior performance in home matches, whereas AD greater than 50%represents inferior performance in away matches.Since crude calculations of HA and AD are in fluenced by differences in team ability,multivariate regression analysis was used to control for its confounding effect.
To model HA a paired design was used whereby each match contributed 2 observations,1 for the home team and 1 for the away team.A repeated measures regression analysis using loglink Generalised Estimating Equations11in STATA Version 11 (STATA Corp.,College Station,TX,USA)was used to estimate the mean number of goals scored by home and away teams. Repeated measures analysis is used when observations occur in pairs or groups and the outcome of interest is likely to be correlated within each group.In the present study the“groups”were the individual matches and the“observations”were the number of goals scored by each of the 2 opposing teams.As this outcome is a discrete count Poisson errors were speci fied for the regression model.Robust estimation of variance was used,as this produces valid standard errors even if the within-group correlations deviate from the correlation structure speci fied in the model.12An additional advantage of robust variance is that it prevents under-estimation of standard errors when count data are over-dispersed.This modelling strategy has previously been used to investigate HA in terms of goals scored13and disciplinary sanctions issued by referees14in football,and is described in greater detail by Goumas.15
与此同时,2017年5月份,金隆公司安排1次年度检修,期间硫酸课对净化二氧化硫脱吸塔内部分分酸管及填料进行疏通以及更换检查处理,再结合公司化验分析提供的数据显示得知(表3):年修前四月数据中铜砷滤饼中硫含量平均值为56.7%;而年修结束后的四月数据中铜砷滤饼中硫含量平均值为35.1%,而这两个月废酸中As含量却变化不大。
To determine places and seedings in its club competitions, UEFA allocates points to each European football team based on previous performance in these competitions(www.uefa.com/ memberassociations/uefarankings).To control for difference in home and away team ability a linear term for the number of points allocated to each team in each season of the Champions League was added to the regression model described above. Departure from linearity was tested for using quadratic andlogarithmic terms;none were evident.Team ability was also fit as an interaction with match location(0=Away,1=Home)to allow for the fact that ability may express itself differently in home and away matches.Variation in HA and AD across seasons and stages of competition(group,round of 16,quarterfinals,and semi- finals)was controlled for by adding indicator variables for each of these covariates to the regression model as a main effect and interaction with match location.Due to the relatively small number of quarter- final and semi- final matches in the analysis,these 2 categories were combined.
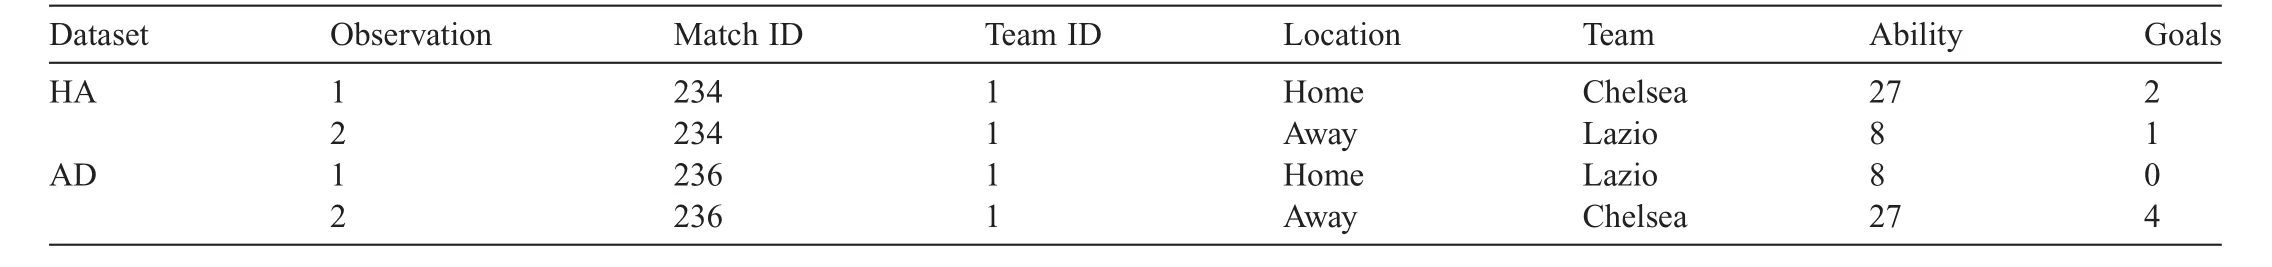
Table 1 Sample observations from the Union of European Football Associations(UEFA)Champions League home advantage(HA)and away disadvantage(AD)datasets.
To estimate HA and AD for individual teams the data were separated into 2 sets:an“HA”dataset including each of the selected team’s home matches;and an“AD”dataset including their away matches.A unique team ID value was assigned to both the home team and away team observations for each home (HA dataset)and away(AD dataset)match played by the selected teams.Table 1 shows sample data for 2 matches played between Chelsea(1 of the selected teams)and Lazio(a nonselected team),1 at each team’s home ground.An indicator variable for each selected team was added to the regression model as a main effect and interaction with match location, with 1 team arbitrarily chosen as the reference.The regression coef ficient for these interaction terms is therefore interpreted as the difference in HA or AD(on the log scale)relative to the reference team.
Linear combinations of equations(“lincom”command in STATA)were used to estimate covariate adjusted HA andAD in terms of the percentage of goals scored in home matches by each team(HA)and the percentage of goals conceded in away matches by each team(AD).Use of the“lincom”command is described in detail in Goumas.1,15HA and AD were derived from the“lincom”regression coef ficient(β)for match location (0=Away,1=Home)for each team using the following equation:

To test for variation in HA and AD between teams,a χ2test of the joint effect of the interaction terms between match location and each team’s indicator variable was carried out.p values less than 0.05 were considered to be signi ficant.
HA and AD datasets for countries were created in the same way as that for teams.However,matches played between teams from the same country were excluded,as the purpose of this part of the analysis was to compare home and away performance between different countries.Covariate adjusted HA and AD were estimated for each country,and tests for variation between countries carried out,in the same way as described above for individual teams.
3.Results
3.1.Teams
Thirteen teams met the inclusion criteria of playing at least 50 matches during the 2003/2004 to 2012/2013 seasons of the UEFA Champions League.Table 2 shows the number of home matches played by each team,goals scored for and against,and crude and adjusted HA.Teams are listed in descending order ofHA after adjusting for team ability,season,and stage of competition.This can be interpreted as the level of HA expected to be gained by each team when playing an opponent of equal ability,and eliminates any between-team variation due to confounding effects of season and stage of competition.All teams except Olympiacos and Inter Milan had a signi ficant(p<0.05)adjusted HA over the period of study. Although HA ranged from 58%(Inter Milan)to 73%(Arsenal), there was no statistical evidence of between-team variation
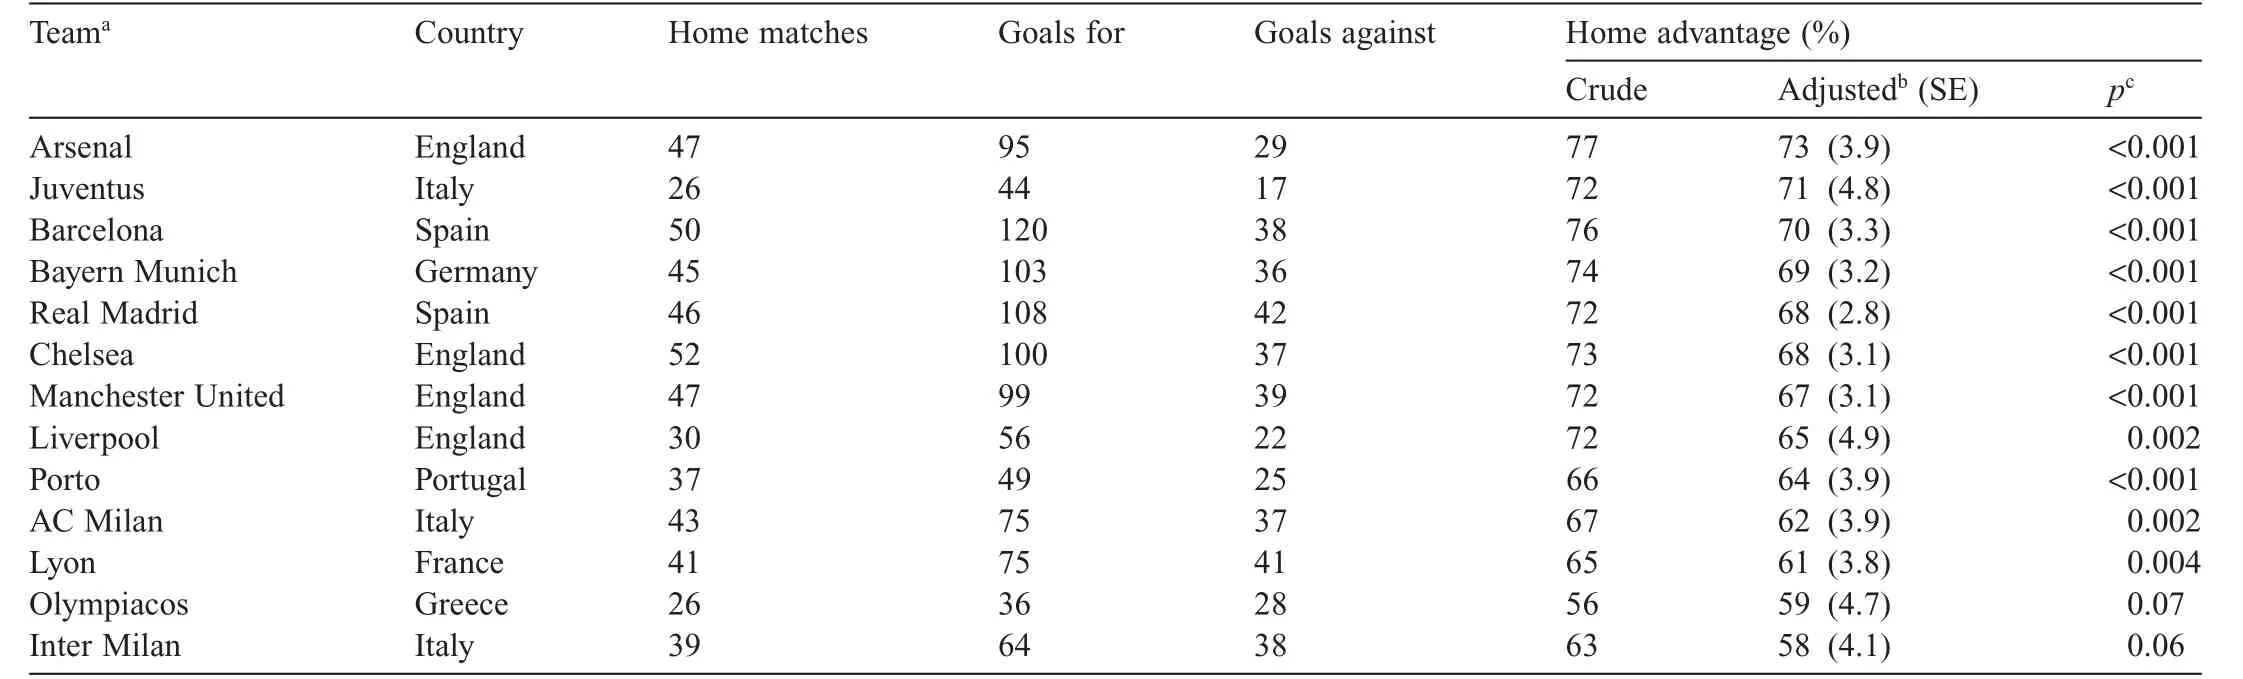
Table 2 Home advantage(%)for individual teams in the Union of European Football Associations(UEFA)Champions League in 2003/2004 to 2012/2013 seasons.
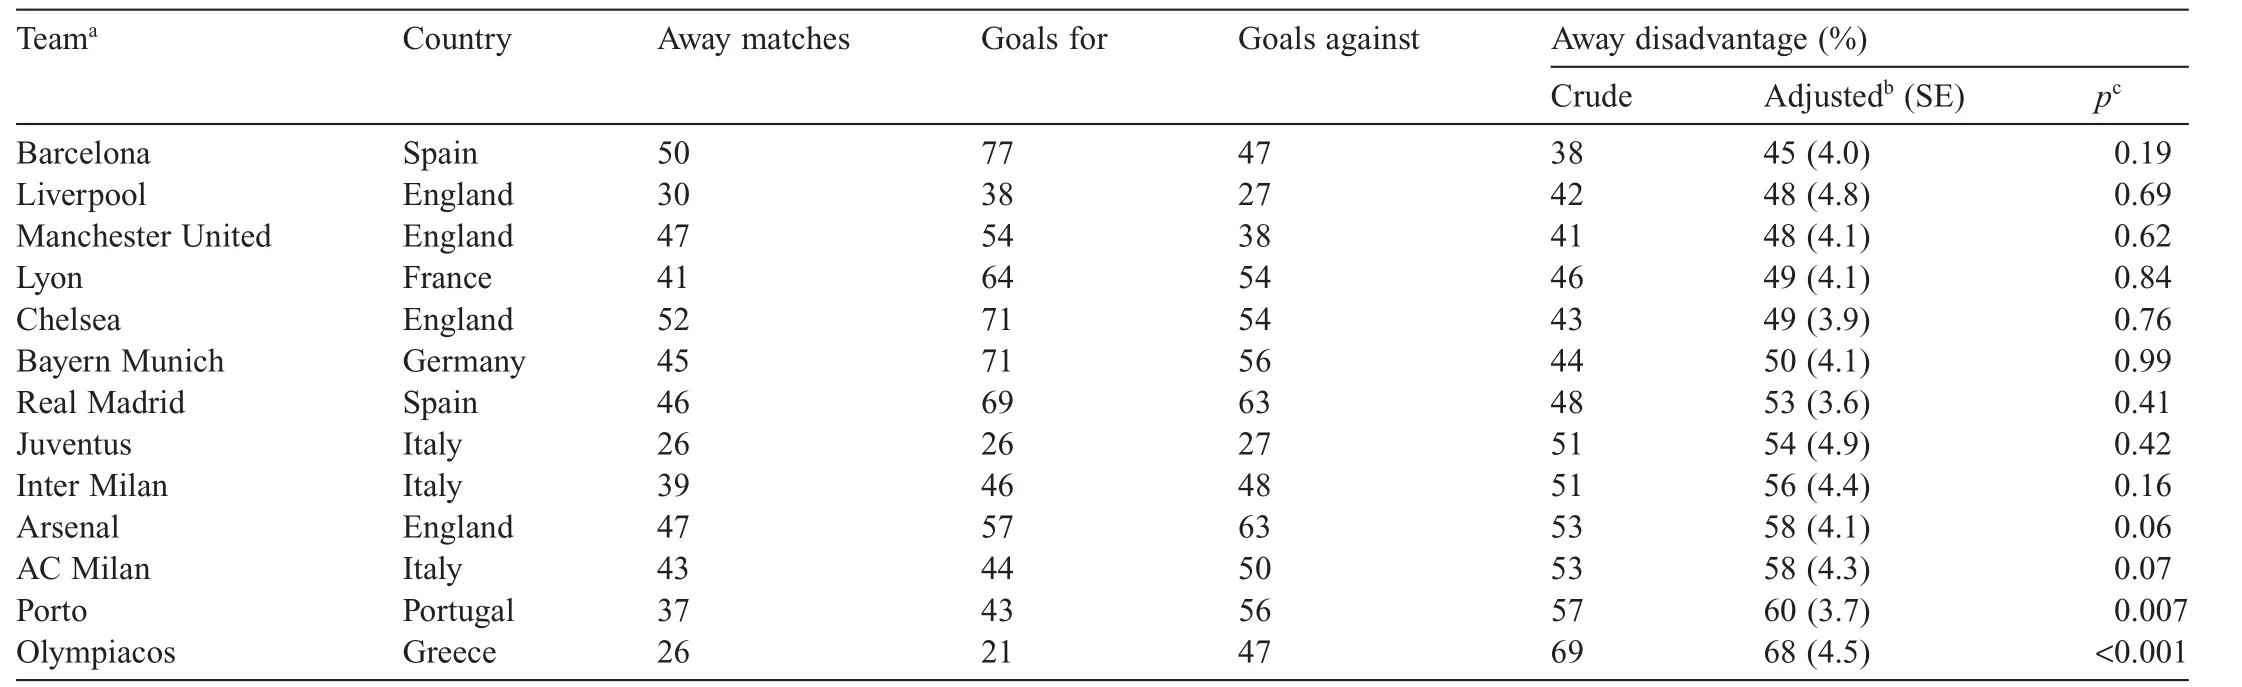
Table 3 Away disadvantage(%)for individual teams in the Union of European Football Associations(UEFA)Champions League in 2003/2004 to 2012/2013 seasons.
Table 3 presents AD for each of the selected teams.Teams are listed in ascending order of AD after adjusting for team ability,season,and stage of competition.Unlike HA,adjusted AD showed evidence(=19. 6;p=0. 09)of between-team variation,ranging from 45%(away advantage)for Barcelona to 68%(AD)for Olympiacos.Porto and Olympiacos were the only teams to have a signi ficant(p<0.05)AD,and no team had a signi ficant away advantage.Teams with higher HA tended to have lowerAD;exceptions includeArsenal who had the highest HA but also relatively highAD,and Lyon who had both low HA and AD.
3.2.Countries
Eleven countries met the inclusion criteria of their teams having played at least 75 matches in the Champions League during the period of study.Table 4 presents results of the home match analysis for each of these countries.All countries except Greece,Netherlands,Russia,and Turkey had a signi ficant (p<0.05)adjusted HA over the period of study.HA varied signi ficantly(=21. 5;p=0. 02)between countries,ranging from 52%(Turkish teams)to 70%(English teams).
Table 5 shows AD for each of the selected countries.After adjustment all countries except England,France,and Spain had a signi ficant(p<0.05)AD.Adjusted AD varied signi ficantly(=22. 7;p=0. 01)between countries,ranging from 52%(French teams)to 67%(Turkish and Greek teams).
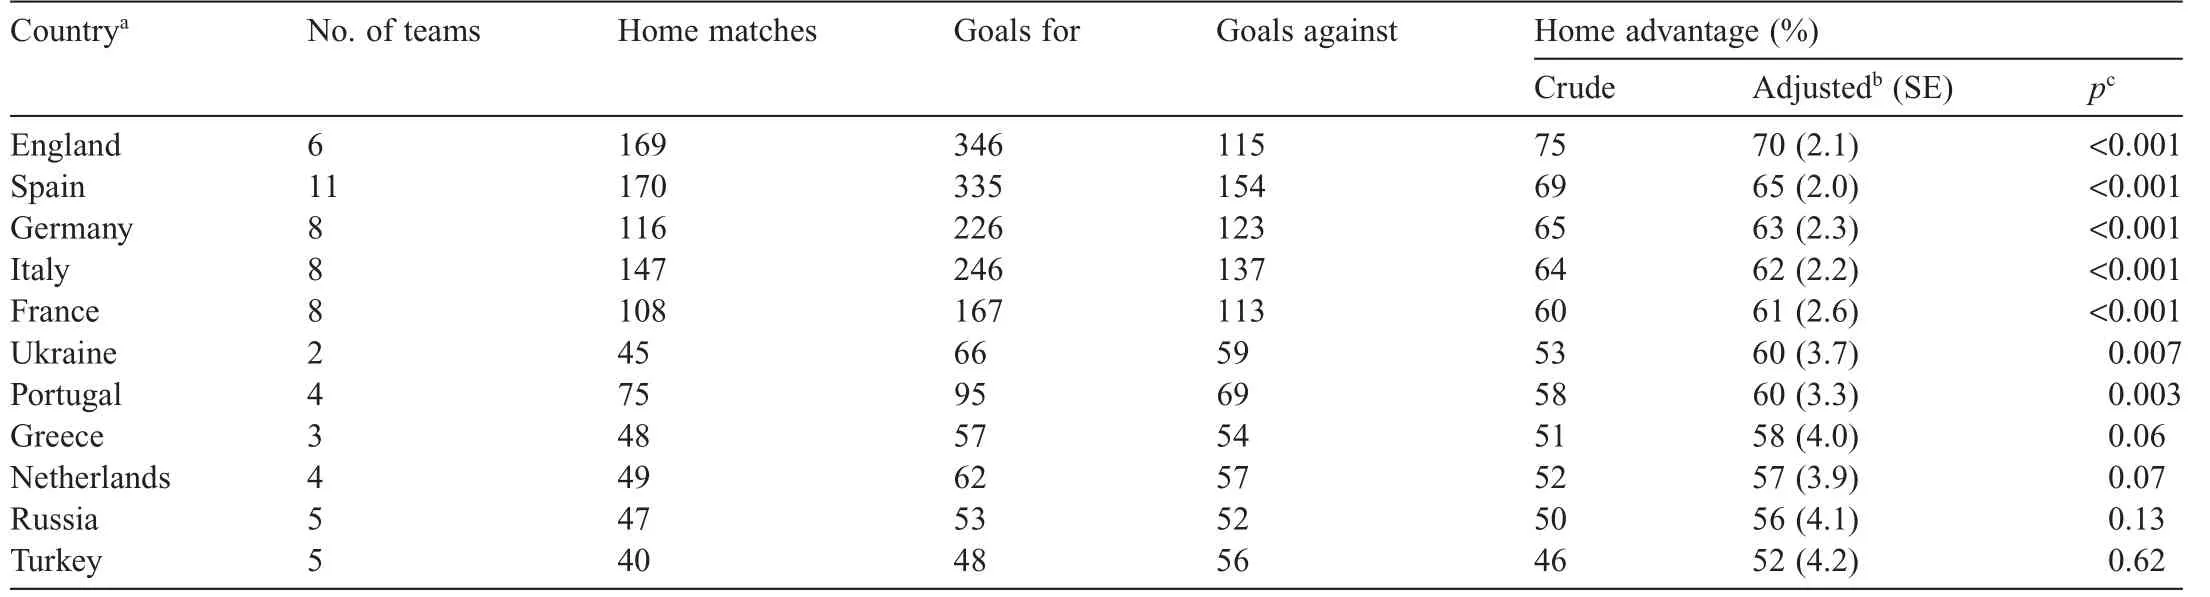
Table 4 Home advantage(%)for individual countries in the Union of European Football Associations(UEFA)Champions League in 2003/2004 to 2012/2013 seasons.
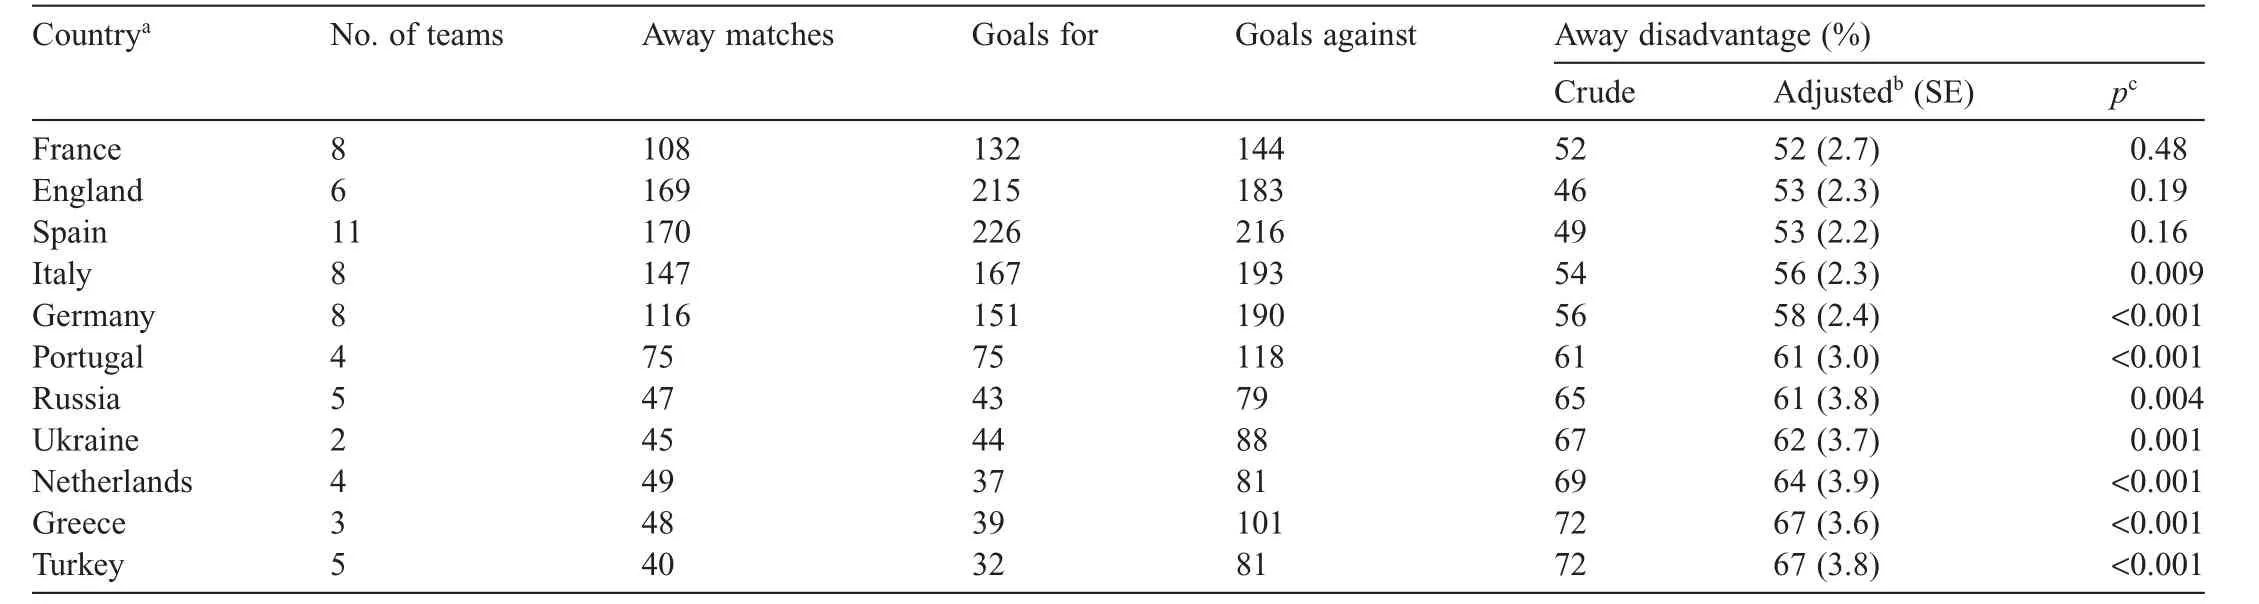
Table 5 Away disadvantage(%)for individual countries in the Union of European Football Associations(UEFA)Champions League in 2003/2004 to 2012/2013 seasons.
4.Discussion
The aims of this study were 2-fold.First,to describe a novel method of estimating HA which is based solely on home performance yet still adequately controls for differences in team ability;and second,to use this method to compare HA and AD between the best performing teams and countries in the UEFA Champions League over a 10-year period.
When adjusting for team ability,season,and stage of competition,HA did not vary signi ficantly between the 13 Champions League teams selected for the analysis,although it did range from 58%to 73%.The lack of statistical signi ficance may be due to the relatively small number of home matches(50 or less)played by each team.The HA estimates for these teams can be(cautiously)compared with those of previous studies which controlled for team ability.Of the 4 English clubs represented in this study,Arsenal had the highest HA(73%),with that for Chelsea,Manchester United,and Liverpool at least 5 percentage points lower.In Clarke and Norman’s6analysis of individual teams in English domestic leagues,which calculated HA in terms of average goal advantage per match,the relative HAs for these 4 clubs were quite different:Manchester United had the highest HA(+0.6),followed closely by Arsenal(+0.5), but with Liverpool and Chelsea much further behind(+0.3).Of course,there are several reasons why relative HAs in the current and previous study may differ.First,there is a 10-year gap separating the 2 respective study periods,and teams are therefore likely to be composed of different players who may respond differently to the factors which contribute to HA(e.g., crowd support).Second,different competitions were investigated in the 2 studies,and teams may vary in their tactical approach to home and away matches in domestic6and international(present study)competitions.Third,and perhaps most important,different methods of estimating HA were used: Clarke and Norman’s6was based on both home and away performance,whereas that in the present study was based on home performance only.
Of the 3 Italian teams selected in the present study,Juventus clearly had the greatest adjusted HA(71%),at least 9 percentage points higher than that for AC Milan and Inter Milan.In Pollard and Gomez’s8study of domestic leagues in South-West Europe,Juventus also had greater HA than the other 2 Italian teams,although the between-team differences were much less than that in the present study.The similar HA for the 2 Spanish teams in the present study(Barcelona:70%; Real Madrid:68%)was also shown in their domestic league, with only a one percentage point difference in HA between these teams.Again it should be pointed out that the South-West Europe study covered a much different time period(from the 1920s to 2000s)than the present study,and different methods of HA estimation were used.
Unlike HA,adjusted AD showed evidence of variation betweentheselectedteams,rangingfrom45%(awayadvantage) to 68%(away disadvantage).Teams with higher HA tended to havelowerAD.AnexceptionisArsenalwhohadthehighestHA butalsorelativelyhighAD,suggestingthatthisteamisunusually dependent on home ground effects(e.g.,crowd support)for its success in the UEFA Champions League.Lyon,on the other hand,who had both low HA andAD,appears to be less affected by home ground factors than most other teams.
Although adjusted HA did not vary signi ficantly between teams,it did so between countries.English teams had clearly the highest HA(70%),at least 5 percentage points higher than teams from any other country,whereas Turkish teams had little or no HA(52%).AD also varied signi ficantly between countries,ranging from 52%(France)to 67%(Turkey and Greece). As with individual teams,countries whose teams had higher HA also tended to have higher AD.The high HA and low AD amongst English teams suggest that there is something unique about football in this country.English football is faced paced and physically demanding compared with that in most other European nations;perhaps a more aggressive playing style combined with home-crowd support is more dif ficult for less aggressive away teams to adjust to than vice versa.Also, English football stadia tend to be designed in such a way that the crowd is much closer to the playing field than football stadia in other countries,which may increase the intensity of homecrowd support,resulting in higher HA.
Differences in tactics may also explain some of the observed variation in HA and AD between teams and countries,especially in the knock-out rounds of the Champions League where away goals can decide outcomes when aggregate scores are tied.16,17Some teams may adopt a cautious approach to away matches,in the hope of gaining most of their points/goals at home,whereas other teams may approach both home and away matches similarly.
A limitation of this study was the relatively small number of matches(100orless)availableforeachoftheteamsselectedfor analysis.This was mainly because a team qualifying the UEFA Champions League is only guaranteed of playing 3 home and 3 away matches that season,with a maximum of 6 home and away matchesplayedifthatteamreachesthesemi- finals.Althoughno signi ficant(p<0.05)between-team variation in HA orAD was observed,the range across teams was similar to that across countries,which did show signi ficant variation probably due to the larger number of matches in the country level analysis.This suggests that signi ficant between-team differences would have been detected if more data were available.
The main advantage of the present method of estimating HA over previously used methods6,7is that it produces HA estimates that are not in fluenced by the HAs of the other teams in the competition.Previous methods have the effect of“regressing”each team’s HA towards the mean HA for all teams combined, and therefore reduce the power to detect differences between teams.
5.Conclusion
The method used in this study to estimate HA for individual teams was based solely on a given team’s performance at home, while effectively controlling for differences in team ability.This has the advantage over previously used methods6,7of not being in fluenced by the HAs of other teams in the competition,and therefore has more statistical power to detect variation between teams.When teams were grouped by country,signi ficant between-country variation in both HA and AD was observed, which may be due to differences in style of play and tactical approaches to home and away matches.
Competing interests
The author declares that he has no competing interests.
1.Nevill AM,Holder RL.Home advantage in sport:an overview of studies on the advantage of playing at home.Sports Med 1999;28:221–36.
2.Pollard R,Pollard G.Long-term trends in home advantage in professional team sports in North America and England(1876–2003).J Sports Sci 2005;23:337–50.
3.Nevill AM,Newell SM,Gale S.Factors associated with home advantage in English and Scottish soccer matches.J Sports Sci 1996;14:181–6.
4.Pollard R.Worldwide regional variations in home advantage in association football.J Sports Sci 2006;24:231–40.
5.Pollard R.Home advantage in soccer:variations in its magnitude and a literature review of the inter-related factors associated with its existence. J Sport Beh 2006;29:169–89.
6.Clarke SR,Norman JM.Home ground advantage of individual clubs in English soccer.Statistician 1995;44:509–21.
7.Pollard R,Gomez MA.Home advantage analysis in different basketball leagues according to team ability.Iber Congr Baske Res 2007;4:61–4.
8.Pollard R,Gomez MA.Home advantage in football in South-West Europe: long-term trends,regional variation,and team differences.Eur J Sport Sci 2009;9:341–52.
9.Pollard R,Silva CD,Medeiros NC.Home advantage in football in Brazil: differences between teams and the effects of distance travelled.Braz J Soccer Sci 2008;1:3–10.
10.Armatas V,Pollard R.Home advantage in Greek football.Eur J Sport Sci 2014;14:116–22.
11.Liang KY,Zeger SL.Longitudinal data analysis using generalized linear models.Biometrika 1986;73:13–22.
12.White H.Maximum likelihood estimation of misspeci fied models. Econometrica 1982;50:1–25.
13.Goumas C.Home advantage in Australian soccer.J Sci Med Sport 2014;17:119–23.
14.Goumas C.Home advantage and referee bias in European football.Eur J Sport Sci 2014;14:243–9.
15.Goumas C.Modelling home advantage in sport:a new approach.Int J Perf Anal Sport 2013;13:428–39.
16.Page L,Page K.The second leg home advantage:evidence from European football club competitions.J Sports Sci 2007;25:1547–56.
17.Lidor R,Bar-Eli M,Arnon M,Bar-Eli A.On the advantage of playing the second game at home in the knockout stages of European soccer club competitions.Int J Sport Exerc Psychol 2010;8:312–25.
21 April 2015;revised 24 July 2015;accepted 8 September 2015
Available online 24 December 2015
Peer review under responsibility of Shanghai University of Sport.
E-mail address:goumas@tpg.com.au
http://dx.doi.org/10.1016/j.jshs.2015.12.008
2095-2546/©2017 Production and hosting by Elsevier B.V.on behalf of Shanghai University of Sport.This is an open access article under the CC BY-NC-ND license(http://creativecommons.org/licenses/by-nc-nd/4.0/).
猜你喜欢
中国石油石化(2022年18期)2022-11-19
中国资源综合利用(2022年9期)2022-10-13
昆钢科技(2022年2期)2022-07-08
中国农业科学(2022年12期)2022-06-28
福建轻纺(2022年4期)2022-06-01
文萃报·周二版(2020年6期)2020-02-18
劳动保护(2019年7期)2019-08-27
智富时代(2019年2期)2019-04-18
智富时代(2019年2期)2019-04-18
中小企业管理与科技·中旬刊(2018年8期)2018-11-12
 Journal of Sport and Health Science2017年3期
- Journal of Sport and Health Science的其它文章
- Time for a paradigm shift in the classi fication of muscle injuries
- Rehabilitation and return to sport after hamstring strain injury
- Risk factors for hamstring injuries in Australian male professional cricket players
- Relationships among hamstring muscle optimal length and hamstring flexibility and strength
- The effect of hamstring flexibility on peak hamstring muscle strain in sprinting
- Motivation dimensions for running a marathon:A new model emerging from the Motivation of Marathon Scale(MOMS)