
Using physical examinations to estimate age in elementary school children: A Chinese population-based study
2017-09-21 11:54LeiShiFanJiangFengxiuOuyangJunZhangXiaomingShena
Lei Shi,Fan Jiang,Fengxiu Ouyang,Jun Zhang,Xiaoming Shena,,*
aXinhua Hospital,Shanghai Jiao Tong University School of Medicine,Shanghai 200092,China
bShanghai Children’s Medical Center,Shanghai Jiao Tong University School of Medicine,Shanghai 200025,China
cMOE-Shanghai Key Laboratory of Children’s Environmental Health,Shanghai 200092,China
Using physical examinations to estimate age in elementary school children: A Chinese population-based study
Lei Shia,c,Fan Jiangb,c,Fengxiu Ouyanga,c,Jun Zhanga,c,Xiaoming Shena,b,c,*
aXinhua Hospital,Shanghai Jiao Tong University School of Medicine,Shanghai 200092,China
bShanghai Children’s Medical Center,Shanghai Jiao Tong University School of Medicine,Shanghai 200025,China
cMOE-Shanghai Key Laboratory of Children’s Environmental Health,Shanghai 200092,China
Background:Designing a simple and accessible approach to age estimation in children and youth is a great challenge in the fields of sports and physical activity(PA).This study was designed to develop and validate a physical-examination-based method of estimating age in young children. Methods:In a cross-sectional study conducted in 2014,we performed physical examinations and assessed PA among 14,970 elementary school children 7–12 years old in Shanghai,China.Additional biological information on the children’s height and birth date was ascertained through their parents.Two indicators were applied to develop a gender-speci fic age estimation equation:The percentage of predicted mature height(PPMH)and theTanner stage.The equation was validated through a k-fold cross-validation approach.To check for estimation accuracy,the association between the discrepancy of estimated age(EA)and chronological age and PA was examined.
Results:The gender-speci fic equations of EA were as follows:EAboy=–6.071+6.559 Tanner 2+13.315 Tanner 3+14.130 Tanner 4+0.190 PPMH–0.071Tanner 2×PPMH–0.146Tanner 3×PPMH–0.155Tanner 4×PPMH;EAgirl=–4.524–1.251Tanner 2+2.504Tanner 3+8.752 Tanner 4+11.893 Tanner 5+0.158 PPMH+0.017 Tanner 2×PPMH–0.024 Tanner 3×PPMH–0.087 Tanner 4×PPMH–0.118 Tanner 5×PPMH.The mean absolute error was 0.60 years for boys and 0.59 years for girls.The discrepancy score was negatively and weakly associated with self-reported moderate-to-vigorous PA in both genders(rboy=–0.09,p<0.001;rgirl=–0.12,p<0.001).
Conclusion:Findings suggest that physical examinations could provide a valid and reliable approach for estimating age in young Chinese children. ©2017 Production and hosting by Elsevier B.V.on behalf of Shanghai University of Sport.This is an open access article under the CC BY-NC-ND license(http://creativecommons.org/licenses/by-nc-nd/4.0/).
Age estimation;Growth and maturation;Physical activity;Physical examination;Skeletal age;Sports
1.Introduction
It is well known that growth and maturation vary considerably among children of the same chronological age(CA). Therefore,it is important that an accurate estimate of age across various developmental stages is available for use in studies of growth and performance in children and youth populations.In the realm of physical activity(PA),age information is often applied in reference to age veri fication in sports,1maturityrelated variation in performance and levels of PA,2,3assessing injury risk,4searching for talented youth athletes,5and seeding (or matching)participants in youth sport competitions.3,6Thus,it is imperative that technically practical,accurate,andscienti fically valid methods of estimating age in children be developed.
There are various methods available for age estimation,5,7including skeletal maturity,dental age,teeth development,and physical examination.The estimation involves somatic growth (e.g.,body height and weight)and sexual maturity.A combined approach that uses both anthropometric measures and skeletal age to derive an estimation for maturity has also proven to be useful.8,9Although skeletal and dental maturity are the most commonly used objective methods,they are expensive and inevitably involve exposure to ionizing radiation,which may be harmful to health.In comparison,physical examination is a noninvasive,inexpensive,and potentially widely accessible assessment approach,and applicable to sports and PA.10,11
In the current study,we combined multiple biological maturity indicators to build an age estimation regression model. Consequently,our primary objective was to develop an ageestimation equation for Chinese elementary school boys and girls using physical examination indicators.Because of the importance of considering PA when estimating age,2,12we also examined the association between levels of PA and CA,estimated age(EA),and discrepancy between CA and EA among Chinese children.
2.Methods
2.1.Study design and population
Forthisstudy,weusedacross-sectional,multistagesampling design,which involved a large-scale elementary school survey conducted in Shanghai,China,in 2014.Using a multistage sampling scheme,in Stage 1 we selected 7 of the 17 districts in the Shanghai metropolitan area.The districts were strati fied based on the socioeconomic characteristics of urban and rural communities.In Stage 2,twenty-six elementary schools within the sampled districts were randomly sampled without strati fication,with a varying number of schools within each of these districts:Jing’an(1 school),Changning(2 schools),Zhabei(2 schools),Jiading(2 schools),Jinshan(3 schools),Pudong(13 schools),and Chongming(3 schools).In Stage 3,classes within the sampled schools were randomly selected.
The target population consisted of elementary school children who were(1)between 7 and 12 years old,(2)able to complete survey questionnaires and anthropometry assessments,and(3)with a height z-score between−3.0 and+3.0. During recruitment,all children in schools that had less than 1000 students were invited to participate whereas in schools that had more than 1000 students only half of the classes in each grade were invited to participate.The study protocol was approved by the Shanghai Children’s Medical Center Human Ethics Committee(SCMCIRB-K2014033),and parents of each participating child provided written informed consent.
2.2.Procedures
Upon completion of the sampling of the districts,schools, and classes,an invitation letter was sent to 17,620 children within the sampled schools and classes.Trained research assistants recruited the participants per study eligibility criteria. After parents consented to have their child participate in the study,assessments were conducted by trained research assistants or physicians in a private room.Assessments were conducted and completed in 2014.
2.3.Measures of sociodemographic characteristics and CA
Parentsofthechildrenwereaskedtocompleteaquestionnaire that included information about the child’s birth date,gender, weight,and height.To reduce the likelihood of overestimating, self-reported parental heights were adjusted according to the following formulas:height=2.803+0.953×(reported height) for women and 2.316+0.955×(reported height)for men.13The CA for each participant was calculated by subtracting the date of birth given on the survey from the date of the physical examination.This age was recorded in years and months and was then converted to years by rounding it to the nearest 2 decimal places.
2.4.Children’s physical examination
Following a standardized protocol,each child’s height(cm) was recorded in duplicate using a calibrated Harpenden stadiometer(Holtain Ltd.,Crosswell,UK).During the assessment,the child was instructed to stand straight on the scale with his or her shoes removed and head positioned against the meter. Measurements were taken in the morning by 2 different physicians and were recorded to the nearest 0.05 cm.The average of 2 values was taken as the child’s height.
Tanner stage for each child was assessed,in a private room, by physicians.The stage of breast development for girls was rated by visual inspection14and the testicular volume for boys was estimated by comparative palpation with the Prader orchidometer(Takeda(China)Holdings Co.,Ltd.,Shanghai, China).15The assessment of breast development included 5 stages representing a progression from immaturity to full maturity.Testicular volume was graded into 4 stages:Stage 1 (<4 mL,prepubertal stage),Stage 2(≥4 to<12 mL,early pubertal stage),Stage 3(≥12 to<20 mL,mid-pubertal stage),and Stage 4(≥20 mL,fully matured stage).16We decided to use breast development levels for girls and testicular volume stage for boys as pubertal maturation indicators because they are the first stages of puberty followed by pubic hair development in the vast majority of children.Both measures have shown a stronger correlation with height growth than with pubic hair appearance.14,17A final rating of Tanner stage was reached by consensus between the 2 physician examiners.
Serving as a major indicator of biological maturity,the percentage of predicted mature height(PPMH)was calculated as the current height of a child divided by his or her predicted mature height,which was calculated by the height for Parental Height formula as follows:45.99+0.78×(midparent height) for boys and 37.85+0.75×(midparent height)for girls.The Parental Height formula has been shown to be a better predictor of mature height inAsian children than other formulas(e.g.,the Corrected Midparental Height).18The midparent height was taken as the average of maternal and paternal current heights.
2.5.Self-reported PA
PA for each child was measured by the Chinese version of the Children’s Leisure Activities Study Survey(C-CLASS), which has been validated with the objectively measured accelerometer data.19The C-CLASS includes leisure-time activities, school physical education classes,and transportation-related activities performed during the previous week.Children’s PA data were categorized into vigorous PA(VPA),moderate-tovigorous PA(MVPA),moderate PA(MPA),and light PA(LPA), as reported for weekdays and weekends.
2.6.Data analysis
It was likely that the multistage sampling may have resulted in clustered data(i.e.,children were nested with classes,which nested within schools,which nested within districts).Therefore, we first examined the intraclass correlation in the data.Because of the small magnitude in intraclass correlation(0.009)and the lack of sampling weights in the data,we conducted the analyseswithout accounting for clustering.To address whether CA, Tanner stage,and PPMH were related,zero-order Pearson correlations were computed for each gender.A gender-speci fic equation for age estimation was formulated and tested using a generalized linear model in which CA was the dependent variable andTanner stages and PPMH were independent predictors. Because there was a signi ficant interaction between Tanner stage and PPMH in relation to CA,we included the interaction term in the linear models.Tanner Stage 1 was used as the reference group in each model tested.
We used the k-fold cross-validation procedure to evaluate prediction error in the age estimation equation.Speci fically,the total sample was divided into k=5 subsets of equal size,stratified by Tanner stage,to ensure that the proportion of each Tanner stage was equally distributed in the subsets.Four of the 5(k–1)subsets were used as a training set,and the remaining subset was used as a test set to validate the model.This process was repeated 5 times,with each child in the dataset involved in the training set exactly 4 times and the test set once.The fitness of models across all k trials was measured by mean absolute error(MAE)and root of mean standard error(RMSE),with smaller MAE or RMSE values indicating a better fit of the model under scrutiny.Pearson correlations were also computed toexaminetherelationshipbetweenvariouslevelsofPAand(1) EA and(2)the discrepancy between EA and CA,across gender.
To ensure accuracy,data on self-reported surveys and anthropometric measurements were double entered in EpiData 3.1(EpiData as freeware from http://www.epidata.dk),and they were checked for outliers and veri fied by 2 research assistants. Statistical analyses were performed using SPSS Version 20.0 for Windows(IBM Corp.,Armonk,NY,USA).The tests were considered statistically signi ficant at a 2-sided p value<0.05.
3.Results
3.1.Study population characteristics
All 26 of the schools invited to participate in the survey study agreed to participate.Of the 17,620 mailed invitations sent to the children and their families within the study sampling area,16,958 agreed to participate,with a high response rate of 96%.After initial screening,14,970 children(9.3±1.4 years, mean±SD;range:7–12 years)(boys=7997;girls=6973) met the study inclusion criteria and were included in the final analysis.
As can be seen in Table 1,a signi ficant number of the children’s parents reported their own paternal(35.62%)and maternal(36.85%)education at an“undergraduate”level.With respect to the level of PA,7061(88.3%)of the boys and 6340 (90.9%)of the girls reported an average of 0.44 h/day in VPA, 6089(76.1%)of the boys and 5305(76.1%)of the girls reported an average of 1.26 h/day in MPA,5754(72.0%)of the boys and 5078(72.8%)of the girls reported an average of 1.68 h/day in MVPA,and 6754(84.5%)of the boys and 6072 (87.1%)of the girls reported an average of 3.70 h/day in LPA.With respect toTanner stage,a vast majority of the boys(74.5%) were classi fied in Stage 1,followed by Stage 2(23.0%),and Stages 3 and 4 combined(2.5%).Among girls,more than onethirdwereclassi fiedineitherStage1(39.5%)orStage2(31.4%), followed by Stages 3(18.1%),and 4 and 5 combined(11.0%) (Table 2).

Table 1 Demographic characteristics of the study population.

Table 2 Anthropometric measures by Tanner stage in the study population(mean±SD).
3.2.Associations between CA and Tanner stage,and PPMH
Results of the correlational analyses showed a positive relationship between CA and Tanner stage and PPMH,indicating that as age increased,the children’s Tanner stage became more advanced(i.e.,more mature)(rboy=0.60,p<0.001;rgirl=0.66, p<0.001).Likewise,biological maturity was indicated by PPMH(rboy=0.81,p<0.001;rgirl=0.83,p<0.001).There was also a moderate-to-high association between PPMH andTanner stage(rboy=0.57,p<0.001;rgirl=0.73,p<0.001).
3.3.EA equations
Results from the linear regression models of CA are shown in Table 3.The regression analysis using Tanner stage and PPMH data resulted in the following equation to predict the EA for boys and girls:
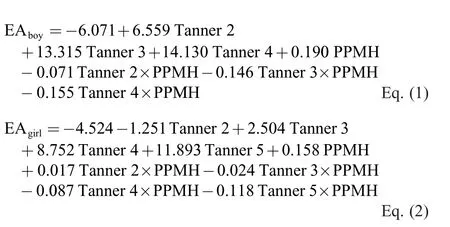
The above equations show that,for boys(Eq.(1)),the mean EA calculated was 9.23 years(95%con fidence interval(CI): 9.21–9.26);for girls(Eq.(2)),the mean EA calculated was 9.26 years(95%CI:9.24–9.29).The MAE value was 0.60 years for boys and 0.59 years for girls,respectively.The RMSE of CA was 0.75 years for boys and 0.74 years for girls,respectively (Tables 4 and 5).
3.4.Cross-validation
Results from 5-fold cross-validation are shown in Table 4 (boys)and Table 5(girls).When evaluated by 1 sample t test, we found that iteration coef ficients yielded from k-foldcross-validation were not statistically different compared to the coef ficients obtained from the total sample,which indicates support for the stability of the predicted values in our EA equation.Additionally,the MAEs and RMSEs in the crossvalidation were shown to be similar to that calculated from the total model,providing further support for the validity of the model developed on the total sample.

Table 3 Estimates(β weights)from the generalized linear regression model of chronological age by gender.

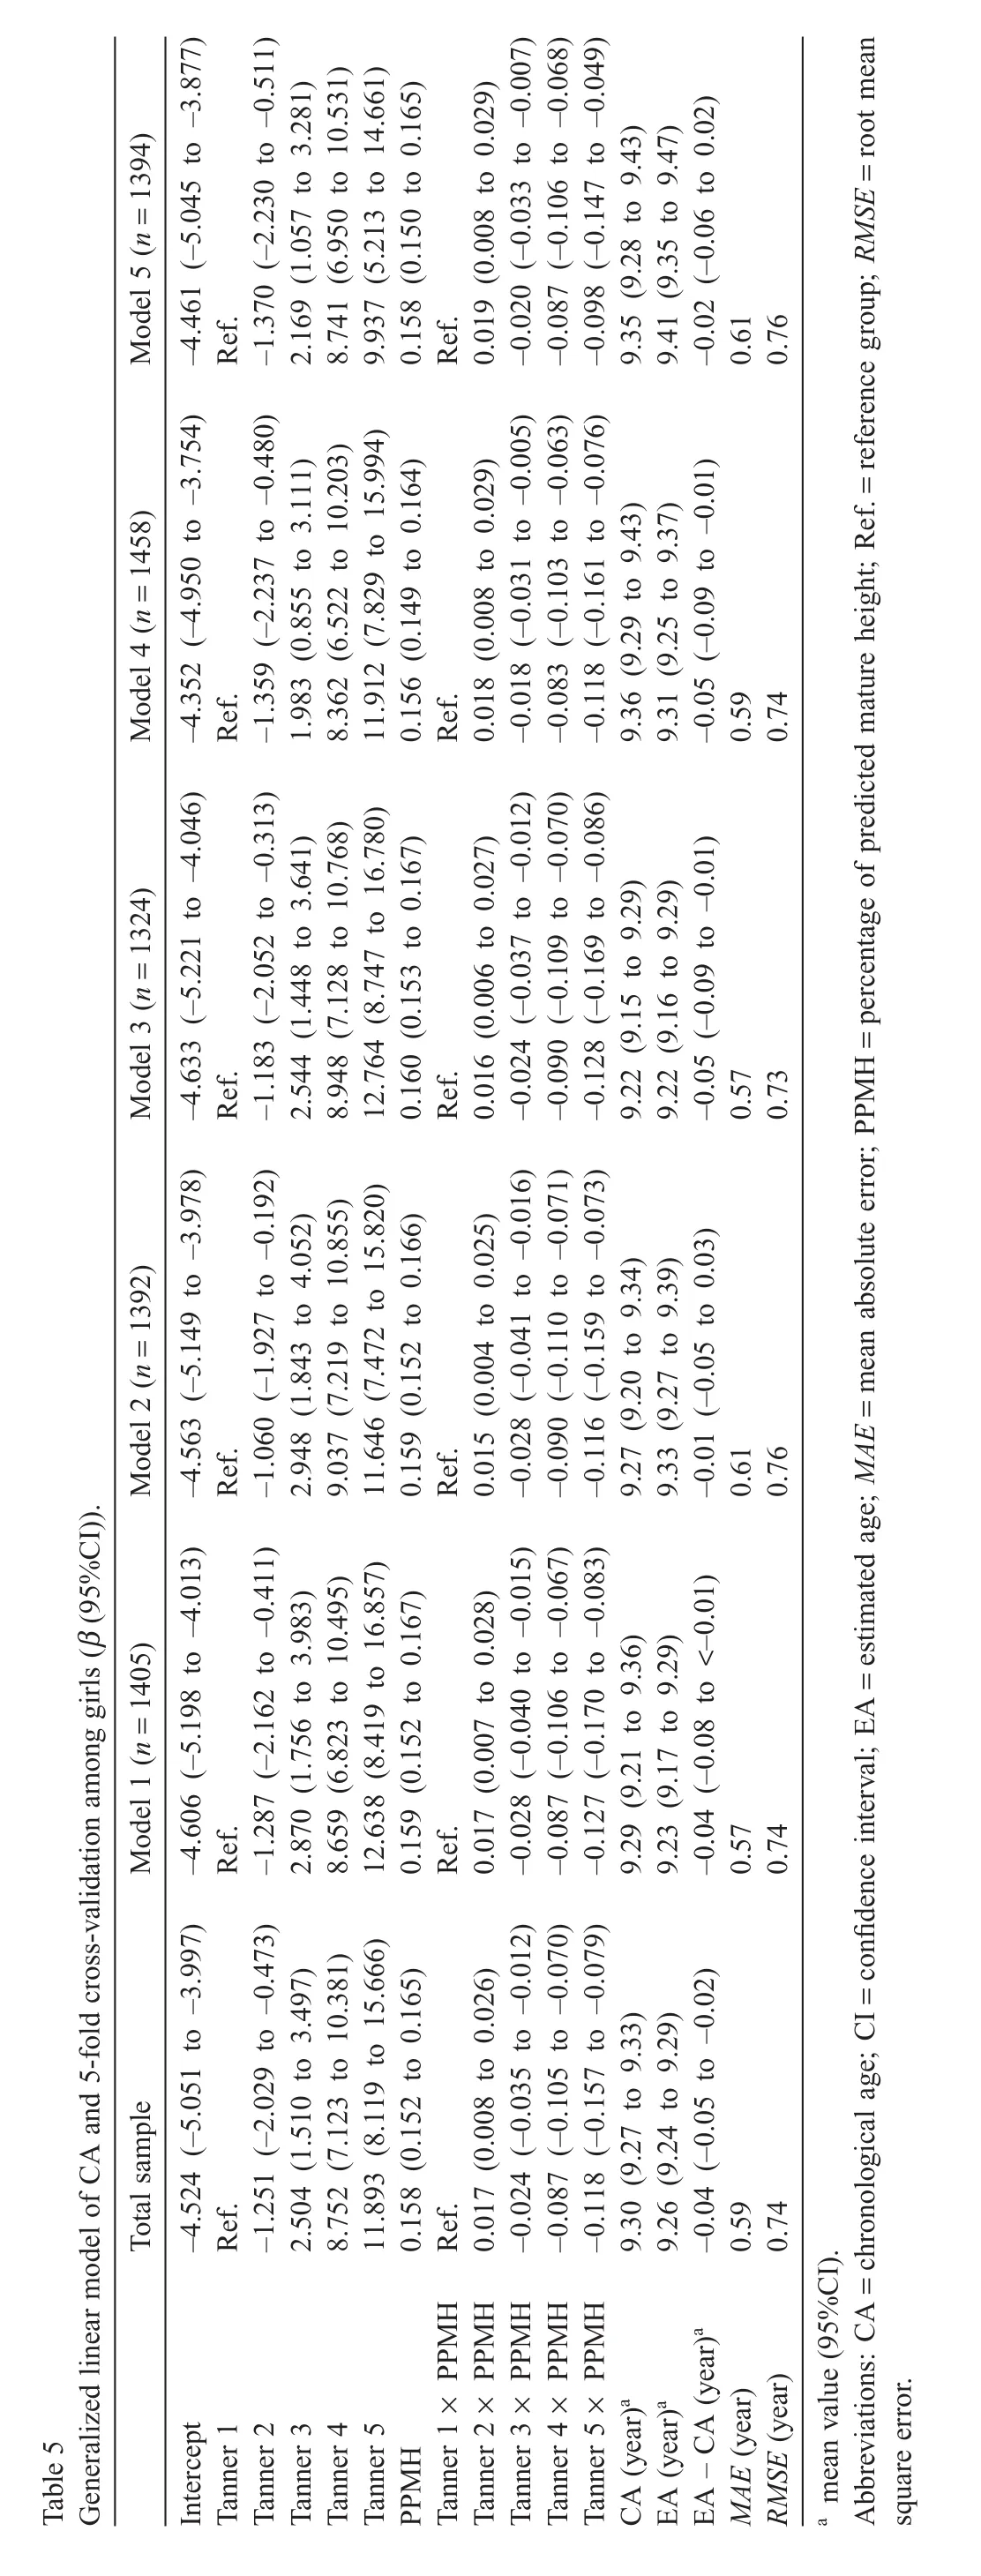
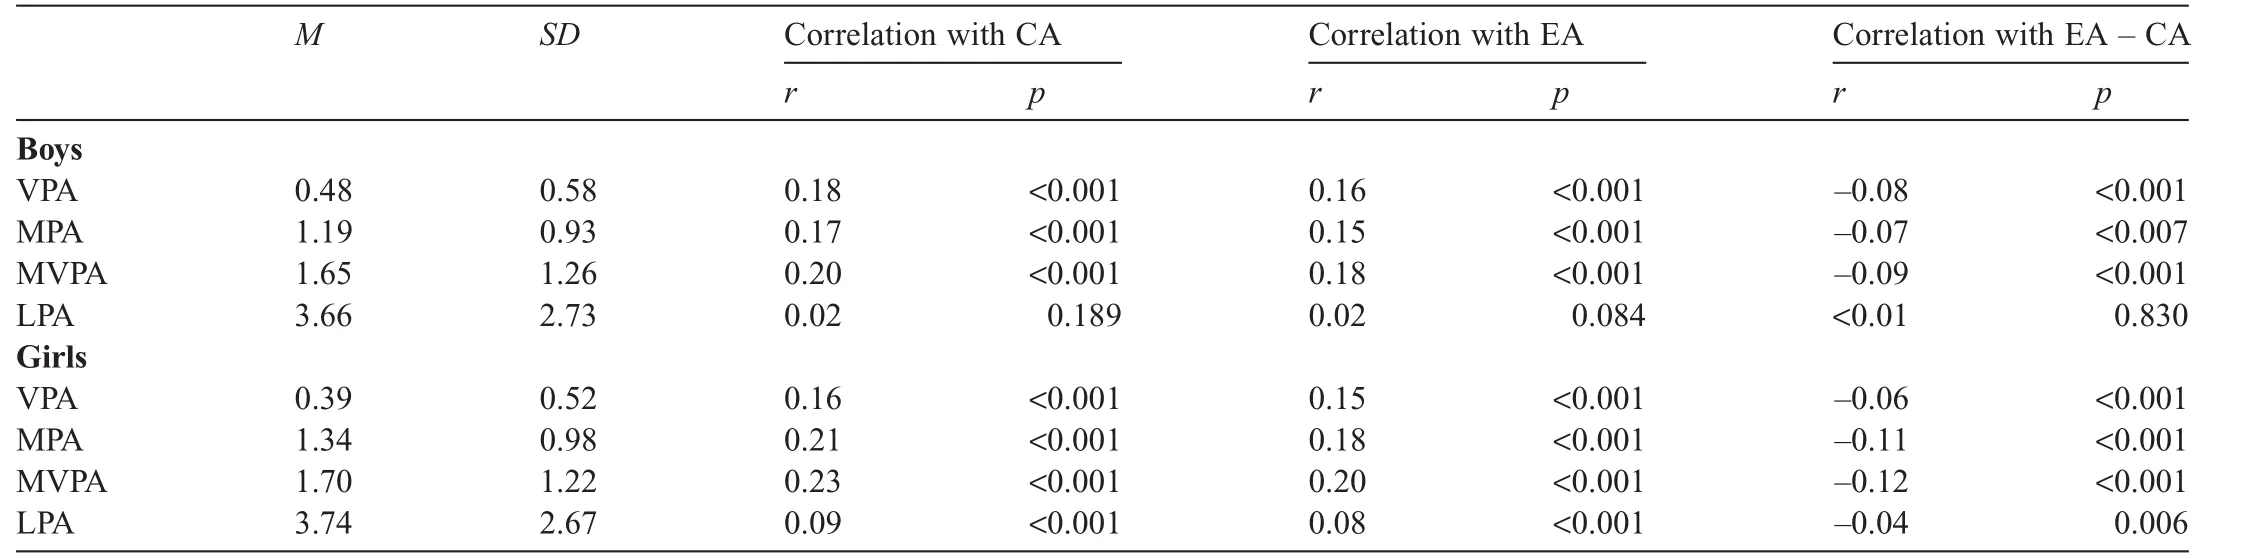
Table 6 Zero-order correlations between PA and CA,EA,and the discrepancy between EA and CA(h/day).
3.5.Relationship between CA and EA and PA
The relationships between levels of PA and CA and EA are shown in Table 6.Results indicate that,although there was a positive relationship between PA and CA across boys and girls, the magnitude of the relationship observed was small,with the largest correlation coef ficient being 0.20 for boys and 0.23 for girls.The same pattern was also found in the relationship between PA and EA,with the largest correlation coef ficient being 0.18 for boys and 0.20 for girls.Table 6 also includes correlations between PA and the discrepancy score(EA–CA). As can be seen,all PA variables except LPA in boys were negatively but weakly correlated with the discrepancy score in both genders,with the largest correlation observed for MVPA (rboy=−0.09,p<0.001;rgirl=−0.12,p<0.001).
4.Discussion
In this large-scale cross-sectional study,we showed that a gender-speci fic age estimation equation,based on physical examination indicators,was able to provide an accurate estimation of age among Chinese school children between 7 and 12 years of age.Results from our cross-validation support both the accuracy and predictability of our equation.To our knowledge,this is the first and largest population-based study of age estimation using combined information on somatic growth (i.e.,body height)and sexual maturity.
In a previous study,20we have shown an estimation error margin of 0.64±0.48 years between skeletal age(as estimated by the Greulich and Pyle method21)and CA among Chinese school children.Estimations derived from the current study improved accuracy and showed an estimated value of 0.6 years observed across both genders in the current study.This suggests that physical examinations may offer an alternative,noninvasive,and inexpensive approach to estimating age when goldstandard methods,such as skeletal measures,are not available.
With respect to the levels of PA,we found a positive but small relationship between levels of PA and EA and CA for boys and girls.A similar pattern of correlations was observed for the relationship between PA and the estimatedchronological discrepancy scores.These findings indicate that although children’s PA is signi ficantly related to the EA values, this relationship is substantively weak in the current study.One possible explanation is that the self-reported PA measure may have in flated this association.Future studies are needed to reassess this relationship using either objectively assessed fitness or physical performance measures to further validate the EA estimation equations.
The study has some notable strengths,including the large sample size(which is representative of the target population of school children)and the use of multiple sources of age information(which was built into the EA question),thus enhancing the validity of our approach.The inclusion of a PA assessment as part of the equation validation process also strengthens the study.The age estimation equation was developed using common physical indicators that can easily be ascertained in practice,without any special equipment.Thus,the process is suf ficiently simple for widespread implementation in a variety of communities and settings.
The study also has some limitations.First,although we included a PA measure(C-CLASS),the use of self-reported measures may have diluted the relationship between PA and EA.In fact,the C-CLASS was shown to overestimate PA, especially in the VPA category among children.19To reduce bias,future studies should consider objectively measured PA, including physical performance-based measures(e.g.,speed, agility,strength,and endurance),because they are more relevant in studying growth and biologic maturation.3Second,our age estimation equation was developed based on a sample of school children who may not be as athletically oriented as other young children in China.Therefore,the equations developed may not be directly applicable to a more athletic population of children.Finally,the precision of the established age equationmay be affected by the fact that we did not control for the potential confounding effect of diet and nutrition on biological maturation.
In the area of studying children’s PA and sports participation,age information is routinely required,for example,to verify age for proper placement in sports,to match opponents in competitive sports,and to better understand maturityassociated variation in physical performance.3,5In this regard, the age estimation equation developed in this study has the potential to be used in applications such as age screening, matching,and placement in sports.Given the increasing prevalence of obesity,hypertension,and metabolic syndromes among school-age Chinese children,22,23and with a growing emphasis on promoting PA among this population,24our equation may be useful in identifying safe and age-appropriate vigorous-intensity activities,such as strengthening or bonebuilding exercises.
5.Conclusion
An age estimation equation based on physical indicators was shown to be accurate and valid in estimating age among Chinese school children 7–12 years old.The equations can easily be derived using common and accessible anthropometric measures and be applied in programs involving participation by school children in PAs and sports.
Acknowledgments
The study was supported by National Natural Science Foundation of China(81422040,81172685);Ministry of Education New Century Excellent Talents(NCET-13-0362),Shanghai ScienceandTechnologyCommission(12411950405, 14441904004,13QH1401800);The fourth round ofThree-Year Public Health Action Plan(2015–2017)(GWIV-36);Shanghai Municipal Education Commission(D1502);The Ministry of Science and Technology(2010CB535000).
Authors’contributions
LS participated in the analysis and drafted the manuscript; XS and FJ designed the study and helped to draft the manuscript;JZ and FO provided critical comments on the manuscript.All authors have read and approved the final version of the manuscript,and agree with the order of presentation of the authors.
Competing interests
The authors declare that they have no competing interests.
1.Malina RM.Skeletal age and age veri fication in your sport.Sports Med 2011;41:925–47.
2.Malina RM.Top 10 research questions related to growth and maturation of relevance to physical activity,performance,and fitness.Res Q Exerc Sport 2014;85:157–73.
3.Beunen G,Malina RM.Growth and biologic maturation:relevance to athletic performance.In:Hebestreit O,Bar-Or O,editors.The young athlete.Oxford:Blackwell Publishing;2007.p.3–17.
4.Malina RM,Ackerman KE,Rogol AD.Growth and the young female athletes.In:Stein CJ,Stracciolini A,Ackerman KE,editors.The young female athlete.Cham:Springer International PublishingAG;2016.p.1–14.
5.Malina RM,Rogol AD,Cumming SP,Coelho e Silva MJ,Figueiredo AJ. Biological maturation of youth athletes:assessment and implications.Br J Sports Med 2015;49:852–9.
6.Timme M,Steinacker JM,Schmeling A.Age estimation in competitive sports.Int J Legal Med 2017;131:225–33.
7.Black S,Aggrawal A,Payne-James J.Age estimation in the living:the practitioner’s guide.Hoboken,NJ:Wiley-Blackwell;2010.
8.MalinaRM,DompierTP,PowellJW,BarronMJ,MooreMT.Validationof a noninvasive maturity estimate relative to skeletal age in youth football players.Clin J Sport Med 2007;17:362–8.
9.Beunen GP,Malina RM,Freitas DI,Maia JA,Claessens AL,Gouveia ER, et al.Cross-validation of the Beunen–Malina method to predict adult height.Ann Hum Biol 2010;37:593–7.
10.Mirwald RL,Baxter-Jones AD,Bdiley DA,Beunen GP.An assessment of maturity from anthropometric measurements.Med Sci Sports Exerc 2002;34:689–94.
11.Müller L,Müller E,Hildebrandt C,Kapelari K,Raschner C.The assessment of biological maturation for talent selection—Which method can be used?Sportverletz Sportschaden 2015;29:56–63.[in German].
12.Manna I.Growth development and maturity in children and adolescent: relation to sports and physical activity.Am J Sports Sci Med 2014;2:48–50. 13.Epstein LH,Valoski AM,Kalarchian MA,McCurley J.Do children lose and maintain weight easier than adults:a comparison of child and parent weight changes from six months to ten years.Obes Res 1995;3:411–7.
14.Marshall WA,Tanner JM.Variations in the pattern of pubertal changes in boys.Arch Dis Child 1970;45:13–23.
15.Zachmann M,Prader A,Kind HP,Ha fliger H,Budliger H.Testicular volume during adolescence.Cross-sectional and longitudinal studies.Helv Paediatr Acta 1974;29:61–72.
16.Tanner JM,Whitehouse RH.Clinical longitudinal standards for height, weight,height velocity,weight velocity,and stages of puberty.Arch Dis Child 1976;51:170–9.
17.Marshall WA,Tanner JM.Variations in pattern of pubertal changes in girls. Arch Dis Child 1969;44:291–303.
18.Luo ZC,Low LC,Karlberg J.A comparison of target height estimated and final height attained between Swedish and Hong Kong Chinese children. Acta Paediatr 1999;88:248–52.
19.Huang YJ,Wong SH,Salmon J.Reliability and validity of the modi fied Chinese version of the Children’s Leisure Activities Study Survey (CLASS)questionnaire in assessing physical activity among Hong Kong children.Pediatr Exerc Sci 2009;21:339–53.
20.Ye X.Research on age estimation in Chinese children.Shanghai:Shanghai Jiao Tong University;2014[Dissertation].[in Chinese].
21.Greulich WW,Pyle SI.Radiographic atlas of skeletal development of the hand and wrist.Redwood City,CA:Stanford University Press;1959.
22.ChenCM.OverviewofobesityinMainlandChina.ObesRev 2008;9(Suppl.1):S14–21.
23.Liu W,Lin R,Liu A,Du L,Chen Q.Prevalence and association between obesity and metabolic syndrome among Chinese elementary school children:a school-based survey.BMC Public Health 2010;10:780. doi:10.1186/1471-2458-10-780
24.Central Committee of the Communist Party of China,State Council of China.“Healthy China 2030”blueprint guide.Available at:http://www. gov.cn/zhengce/2016-10/25/content_5124174.htm;2016[accessed 18.02.2017].
14 December 2016;revised 7 February 2017;accepted 24 February 2017
Available online 16 March 2017
Peer review under responsibility of Shanghai University of Sport.
*Corresponding author.
E-mail address:xmshen@shsmu.edu.cn(X.Shen)
http://dx.doi.org/10.1016/j.jshs.2017.03.005
2095-2546/©2017 Production and hosting by Elsevier B.V.on behalf of Shanghai University of Sport.This is an open access article under the CC BY-NC-ND license(http://creativecommons.org/licenses/by-nc-nd/4.0/).
 Journal of Sport and Health Science2017年3期
- Journal of Sport and Health Science的其它文章
- Time for a paradigm shift in the classi fication of muscle injuries
- Rehabilitation and return to sport after hamstring strain injury
- Risk factors for hamstring injuries in Australian male professional cricket players
- Relationships among hamstring muscle optimal length and hamstring flexibility and strength
- The effect of hamstring flexibility on peak hamstring muscle strain in sprinting
- Motivation dimensions for running a marathon:A new model emerging from the Motivation of Marathon Scale(MOMS)