
Con firmatory factor analysis of VISA-P scale and measurement invariance across sexes in athletes with patellar tendinopathy
2017-09-21 11:54SergioHernanezSanhezFerranAatMarHialgoAntonioCuestaVargasVitorSegarraJoseSanhezIaezAntoniaGomezConesa
Sergio Hernanez-Sanhez*,Ferran Aat,María D.Hialgo,Antonio I.Cuesta-Vargas, Vitor Segarra,Jose M.Sanhez-Iañez,Antonia Gomez-Conesa
aDepartment of Pathology and Surgery,Physiotherapy Area,Miguel Hernandez University,Valencia 03550,Spain
bSports Orthopaedic Surgeon,ReSport Clinic,Barcelona 08017,Spain
cDepartment of Basic Psychology and Methodology,University of Murcia,Murcia 30100,Spain
dDepartment of Physiotherapy,Faculty of Health Sciences,University of Malaga,Malaga 29009,Spain
Con firmatory factor analysis of VISA-P scale and measurement invariance across sexes in athletes with patellar tendinopathy
Sergio Hernandez-Sancheza,*,Ferran Abatb,María D.Hidalgoc,Antonio I.Cuesta-Vargasd, Victor Segarrab,Jose M.Sanchez-Ibañezb,Antonia Gomez-Conesac
aDepartment of Pathology and Surgery,Physiotherapy Area,Miguel Hernandez University,Valencia 03550,Spain
bSports Orthopaedic Surgeon,ReSport Clinic,Barcelona 08017,Spain
cDepartment of Basic Psychology and Methodology,University of Murcia,Murcia 30100,Spain
dDepartment of Physiotherapy,Faculty of Health Sciences,University of Malaga,Malaga 29009,Spain
Background:TheVictorian Institute of SportAssessment–Patella(VISA-P)scale is the most condition-speci fic patient-reported outcome measure used to assess symptom severity in athletes with patellar tendinopathy.Previous exploratory factor analyses have been conducted to evaluate the scale’s dimensionality,with inconsistent results,and the factor structure of the scale remains unclear.The aims of the present study were to determine the factorial structure of the VISA-P scale using con firmatory factor analysis(CFA)and test measurement invariance across sexes. Methods:The study included a convenience sample of 249 Spanish athletes with patellar tendinopathy.CFA was performed to assess factorial validity.Hypothesized 1-and 2-factor models were tested.Measurement invariance across sexes was evaluated via multi-group CFA with several fit indices using EQS 6.1 software.
Results:The internal consistency coef ficient was 0.74.Several CFA models were examined and the 1-factor model in which errors for Items 7 and 8 were correlated showed acceptable fit in terms of comparative fit index(CFI)and goodness-of- fit index(GFI)statistics(CFI=0.93;GFI=0.94; standardized root mean square residual=0.06;root mean square error of approximation=0.10;90%con fidence interval:0.08–0.13).This model was invariant across sexes.
Conclusion:The 1-factor model of the Spanish version of the VISA-P scale(VISA-P-Sp)in which errors for Items 7 and 8 were correlated demonstrated relative fit in CFA.Scores obtained via VISA-P-Sp can be compared between men and women without sexes bias.Further studies should examine the VISA-P scale and other single-score patient-reported outcome measures concurrently.
©2017 Production and hosting by Elsevier B.V.on behalf of Shanghai University of Sport.This is an open access article under the CC BY-NC-ND license(http://creativecommons.org/licenses/by-nc-nd/4.0/).
Jumper’s knee;Measurement invariance;Patient-reported outcome measure;Structural validity
1.Introduction
Patellar tendinopathy is a common overuse injury in sports, particularly in jumping athletes.1In addition to other means of objective measurement,the use of patient-reported outcome measures(PROMs)has become increasingly important in assessing patients’health status in recent years.2For example, structural changes in patellar tendinopathy can be studied using ultrasound or magnetic resonance imaging,but image findingsand clinical symptoms are not always consistent.3In order to capture the patient experience,the use of PROMs in clinical practice and research is highly recommended.4
TheVictorianInstituteofSportAssessment–Patella (VISA-P)scale is the only condition-speci fic scale for patellar tendinopathy.5It has become the most widely used PROM in symptom severity assessment and the monitoring of changes related to injury over time.6Nowadays,several versions of the VISA-P scale are available.7–14
The Consensus-based Standards for the Selection of Health Measurement Instruments(COSMIN)initiative established a set of standards,which are to be followed in studies assessing the psychometric properties of health-related patient-reported outcomes(PROs).15One of these properties is the constructvalidity,de fined as“the degree to which a health-related PRO instrument measures the construct(s)it purports to measure”.
With respect to the validity of theVISA-P scale,the consensus among experts is that it is a good measure of symptom severity in patellar tendinopathy.6The VISA-P scale can differentiate scores from various well-known groups(e.g.,healthy individuals vs.those with tendinopathy)but is not a diagnostic tool.It has been found to be strongly correlated with other standardized instruments used to assess orthopedic knee disorders(Lysholm and Modi fied Blazina scales),in addition to the physical components of the Short Form-36 Health Survey;this indicates good construct validity.11,12
However the factor structure of the VISA-P scale remains unclear.Factor structure can contribute strongly to the assessment of construct validity and is referred to as“the degree to which the scores of a health-related PRO instrument are an adequate re flection of the dimensionality of the construct to be measured.”15In health and sports medicine,PROs are often measured indirectly through their manifestations,also called“latent variables”or“constructs”.4
Since its original publication,the scale has generated a single final score for patellar tendinopathy severity,measuring this phenomenon quanti fied by the set of 8 items.There are no subscales,suggesting a 1-dimensional design and use for this instrument.However,there was no technical information regarding dimensionality provided in the original study.5Controversy surrounds the scale’s underlying factors and item distribution by factor,due to the publication of various cross-cultural adaptations using exploratory factorial analysis(EFA).
Speci fically,4 cross-cultural adaptation studies have analyzed the factor structure of theVISA-P scale but their findings were inconsistent.7,9,11,12In all cases,a 2-factor solution was drawn,allowing explanation of between 64.5%(Dutch)and 85.6%(Greek)of the variance.In Swedish and Dutch studies, factor loadings for the Item 1(no pain while sitting)were incongruent.Therefore,the authors forced a 3-factor solution, accounting for 74.6%and 85%of the variance in the Dutch and Swedish studies,respectively.
Factor descriptions and the assignment of items to factors are also controversial issues:a Spanish study reported that Items 1–6 belong to the first factor(pain during activities),and Items 7 and 8 belong to the second(sport participation).11The distribution was very similar to that of the Dutch VISA-P scale adaptation,with the exception of Item 1,which was assigned to an independent factor(pain while sitting).In the Swedish study, there were 2 factors with single items:sit pain free(Item 1)and currently undertaking sports(Item 7).7The third factor included the 6 remaining items.In their discussion of the results,the Swedish authors suggested that Item 1 may have been an artifact and should be considered in the first factor.In the Greek adaptation study,the first factor was pain/symptoms during functional load and sports participation and included 6 items (Items 2 and 4–8).12A second identi fied factor,symptoms during static loading,included Items 1 and 3.However,they repeated the analysis excluding the other knee injury group from the analysis.In this case,only 1 factor,which explained 80.8%of the total variance,was identi fied,and in a forced 2-factor solution,the second factor included Item 7 alone.
To date,there is no consensus with respect to the number of factors underlying the concept(or construct)of symptom severity in patellar tendinopathy,and assessment of VISA-P scale factor structure is required.
These studies employed EFA(principal components with varimax rotation),a statistical method that provides an initial, or exploratory,indication as to whether the items of a PROM are representative of single or multiple factors or constructs. This EFA process requires a smaller sample and indicates the direction for the more thorough con firmatory factor analysis (CFA),a statistical process that uses assumptions,modeling, and estimations to determine whether a questionnaire has a multifaceted or single unitary structure.16
This variability in the results of the analysis ofVISA-P scale factor structure and the recommendations of the COSMIN initiative suggest that it is necessary to perform new analyses to clarify this attribute of validity.Therefore,the aim of the present study was to determine the factor structure of the VISA-P scale using CFA.As a secondary consideration,and due to the potential sexes differences in pain perception and tolerance reported in the literature,17,18we assessed measurement invariance in VISA-P scale scores across sexes using multi-group con firmatory factor analysis(MGCFA).
2.Methods
2.1.Participants
Across-sectionalconveniencesamplewasrecruited. Between January 2012 and October 2014,data were collected from patients of 5 sports medicine clinics and members of 15 sports teams(volleyball,handball,and basketball)across various geographic zones in Spain.
Consecutive athletes with patellar tendinopathy who had undergone physiotherapy treatment were eligible if they were aged at least 18 years;had a history of continuous pain for at least 3 months or recurrent pain for at least 6 months at the inferior pole of the patella;19were physically active at least 3 times a week prior to the tendinopathy episode;and were able to read and provide written informed consent.We restricted participation to patients who had been clinically diagnosed with patellar tendinopathy,and tendinosis was veri fied via ultrasound or magnetic resonance imaging.We focused on the more severely affected patella in athletes with bilateral patellar tendinopathy.Participants with in flammatory conditions,a history of previous knee surgery,or symptoms other than those of patellar tendinopathy were excluded.
2.2.Instrument
The VISA-P scale was developed in Australia by the Victorian Institute of SportAssessment to quantify symptom severity in athletes with patellar tendinopathy.5This brief,selfadministered questionnaire consists of 8 items;6 are used to evaluate pain levels or disability in daily activities and speci fic functional tests and 2 provide information regarding ability to play sport.Response options for each item areprovided on a numeric rating scale(from 0 to 10),with higher scores indicating lower levels of pain or disability for all items other than 7 and 8,for which options have weighted scores. Item 7 has 4 possible rating levels(0,4,7,and 10).Item 8 is divided into 3 assumptions(A,B,and C),from which only 1 is chosen according to the impact of pain on engagement in sport; this holds greater weight in the final score range(0–30 on a Likert scale).The maximum score possible is 100 points and represents an asymptomatic athlete who can fully engage in sports.The theoretical minimum is 0 point.
2.3.Procedure
Participants completed a questionnaire,which recorded demographic and clinical data related to patellar tendinopathy, and the VISA-P scale during the first visit to medical staff members employed by the clinics and sports teams.Each patient was fully informed of the con fidentiality of their responses and the voluntary nature of their participation. Written informed consent was obtained from the participants before data collection.Ethical approval for the study was granted by the Ethics and Experimental Research Committee at Miguel Hernandez University.
2.4.Statistics
The normality,or distribution,of the VISA-P scale item scores was examined by obtaining univariate skewness and kurtosis values.According to Finney and DiStefano,20univariate skewness of greater than 2 and kurtosis of greater than 7 indicate non-normal distribution.Moreover,Mardia’s normalized multivariate kurtosis coef ficient was calculated,whereby a value greater than 3 indicates non-normal distribution.21In addition,Cronbach’s α was used to estimate the internal consistency of the scale.
Subsequent to these analyses,CFA was performed to investigate the internal structure of VISA-P scale items in a Spanish sample;the maximum likelihood estimation method was used to evaluate the fit of 2 hypothesized models.The first was an original 1-factor model used in clinical practice to determine symptom severity via the VISA-P scale;5this method was also used by Korakakis et al.12in their exploratory analysis.The second was an alternative 2-factor model that has been considered in other exploratory studies,with a second dimension, sport participation,containing Items 7 and 8.11,12MGCFA was used to examine the equivalence(measurement invariance)of the VISA-P scale across sexes.The present study adhered to the sequence recommended in other invariance studies22,23as follows: (1)test the CFA model separately in each group,(2)conduct the simultaneous test of equal form(form invariance),(3)assess the equality of factor loadings,(4)assess the equality of intercepts, (5)assess the equality of errors,(6)assess the equality of factor variance,and(7)assess the equality of latent means.
The extent of factorial invariance was determined using χ2differences between 2 nested models,via a based likelihood ratio test.A nonsigni ficant result indicates that there is no difference in fit between the constrained and unconstrained models.However,the χ2test is fairly sensitive to sample size; therefore,the adequacy of the fit of the model was evaluated using the following fit indices:24,25relative chi-squared(χ2/df), comparative fit index(CFI),goodness-of- fit index(GFI),standardized root mean square residual(SRMR),and root mean square error of approximation(RMSEA)including con fidence interval.Further,when the Cfidifference(ΔCFI)was larger than 0.01,model mis fit was identi fied.26Conventional guidelines suggest that a good fit is indicated with Cfivalues between 0.90 and 0.95 and SRMR values of less than 0.08.27RMSEA values of less than 0.06 indicate a good fit,and those of 0.08 or more indicate a reasonable fit.28The criterion for acceptance of a model was a χ2/df ratio of less than 3;however,this cutoff value varies across studies,ranging from greater than 2 to less than 5.28,29In all cases,results were considered statistically signi ficant when the probability value was less than or equal to 0.01.Statistical analyses were performed using EQSVersion 6.1 (Structural Equation Modeling Software,Encino,CA,USA)for CFA and MGCFA and SPSS Version 17.0(SPSS Inc.,Chicago, IL,USA)for descriptive statistics.
There are no absolute guidelines regarding the minimum sample size required for CFA.30Some authors have reported sample sizes of approximately 100–150 or 10 participants per questionnaire item.31Nevertheless,a sample size of at least 200 participants has also been recommended,and a considerably higher number of participants may be required for models involvingmanyvariables,latentfactors,orestimated parameters.16In this study,thresholds of at least 10 participants per VISA-P scale item and no fewer than 100 overall were applied for CFA,as suggested by Gorsuch.32
3.Results
3.1.Descriptive statistics
The sample population was predominantly male(59.4%);the participants’mean ages were 30.2±8.2 years for men and 27.5±7.8 years for women.The majority of the participants (75.5%)were recruited from sports medicine clinics.Participants’(n=249)descriptiveandclinicalcharacteristicsareshown in Table 1.Cronbach’s α was 0.74 for all VISA-P scale items. 3.2.Multivariate normality and assumptions
Table 2 shows the range of values for univariate skewness and kurtosis,as well as Mardia’s normalized multivariate kurtosis values.Univariate skewness and kurtosis values indicated univariate normality.There was no evidence of multivariate non-normality.
3.3.CFA
3.3.1.Evaluating 1-and 2-factor solutions
CFA was conducted to evaluate the fit of 2 hypothesized models.The results obtained for these models are shown in Table 3.The data indicated that the 1-factor model obtained a relative fit,and the errors for Items 7 and 8 were correlated(i.e., not independent).Therefore,an alternative 1-factor model that allowed for correlation of the errors for Items 7 and 8 was tested (Fig.1).The 1-model fit with errors correlated was adequate with respect to the Gfiand Cfistatistics,which was also thecase for the 2-factor model.The error,in terms of the RMSEA statistic,was within the upper accepted limits.However,χ2values for the model remained signi ficant,suggesting some degree of mis fit.
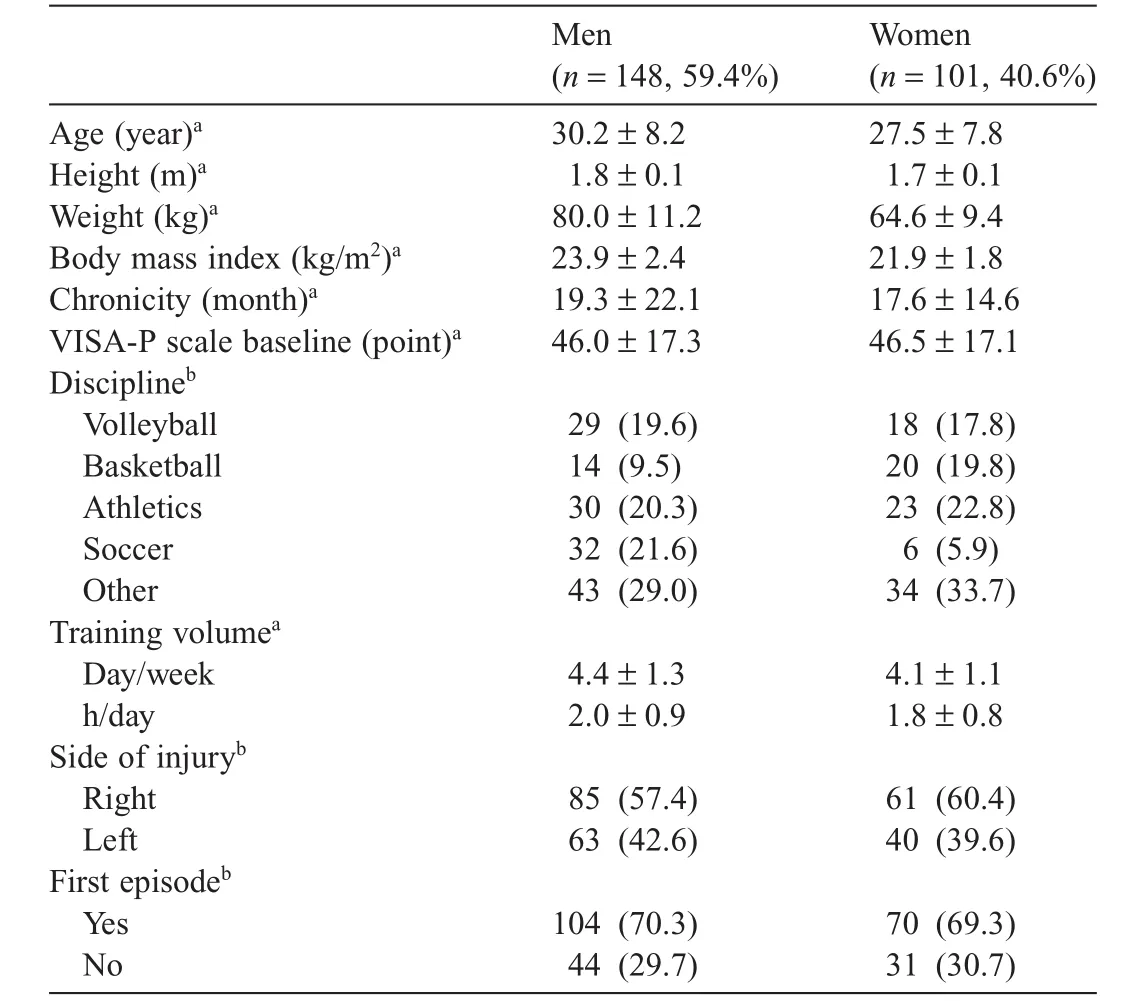
Table 1 Descriptive characteristics of the study population(n=249).

Table 2 Values for the normality tests of the Victorian Institute of Sport Assessment–Patella scale scores.

Table 3 GFIs in the con firmatory factor analysis of the VISA-P scale for all sample (n=249).

Fig.1.The 1-factor model with errors of Items 7 and 8 correlated( final model).VISA-P scale=Victorian Institute of Sport Assessment–Patella scale.
This indicates that Items 7 and 8 are closely interrelated(i.e., they share more with each other than they do with the remaining 6 items),which suggests that the items may not all measure the same construct.This could be the reason why the 1-factor model with correlation of the errors for Items 7 and 8 fits equally as well as the 2-factor model.Nevertheless,a factor with only 2 indicators appears weak,as it is generally accepted that de finition of a factor requires at least 3 variables.31,33
Factor loadings for 1-factor model modi fied related to the VISA-P scale scores for the total sample are shown in Table 4. 3.3.2.Measurement invariance across sexes
Subsequent to identi fication of theVISA-P scale model with the best fit,and considering the parsimony model principle, measurement invariance was assessed across sexes for the 1-factor adjusted model(with correlation of the errors for Items 7 and 8),using the sequential strategy described by Meredith and Teresi.23
One-factor theoretical model was assessed separately for each level of the sexes variable.Initial testing of the hypothesized model for both men and women indicated a marginallygood fit to the data.A review of the Lagrange Multiplier(LM) test results(i.e.,indices of model mis fit)revealed that the error covariance between Items 7 and 8 was markedly misspeci fied. Given the obvious relationship between Items 7 and 8,the model was respeci fied and re-estimated with the error covariance included.This reparametrization resulted in an improvement in the fit of the model(Table 5).Factor loadings across sexes are shown in Table 4.

Table 4 Factor loadings for the latent variables of the Victorian Institute of Sport Assessment–Patella scale for all samples and across sexes.
Con figural or factorial invariance analysis was conducted across sexes to determine whether the factor structure of the VISA-P scale was the same for both men and women.
A baseline model(M1)with no equality constraints across sexes subsamples was tested,revealing that the model fit the data reasonably well,with a Cfivalue of almost 0.95,an SRMR value of almost 0.07,and an RMSEA value of less than 0.10 (Table 6).Thereafter,all free factor loadings were constrained to be equal across groups(M2).The fit of this model was also reasonable.Therefore,the χ2difference test(Δχ2)indicated a nonsigni ficant difference between the model with factor loadings constrained and the modi fied baseline model(p>0.01). The factor loadings and intercepts were both constrained to be equal across groups(M3).The Δχ2test for M3 and M2 indicated that the factor loadings and intercepts were equivalent across groups(p>0.01).The model with factor loadings,intercept,and error variance constrained(M4)was fit to the data;the Δχ2test indicated a nonsigni ficant difference between this model and M3.The models with factor variances(M5)and factor means(M6)constrained were then fit to the data; nonsigni ficant differences between M4 and M5 and M5 and M6were observed.All GFIs indicated that all of the tested models that assumed different degrees of invariance were acceptable. None of the factor loading differences between sexes were statistically signi ficant.Moreover,nonsigni ficant differences in latent means between men and women were observed.Therefore,formal and measurement invariance across sexes was evidenced for the VISA-P scale.
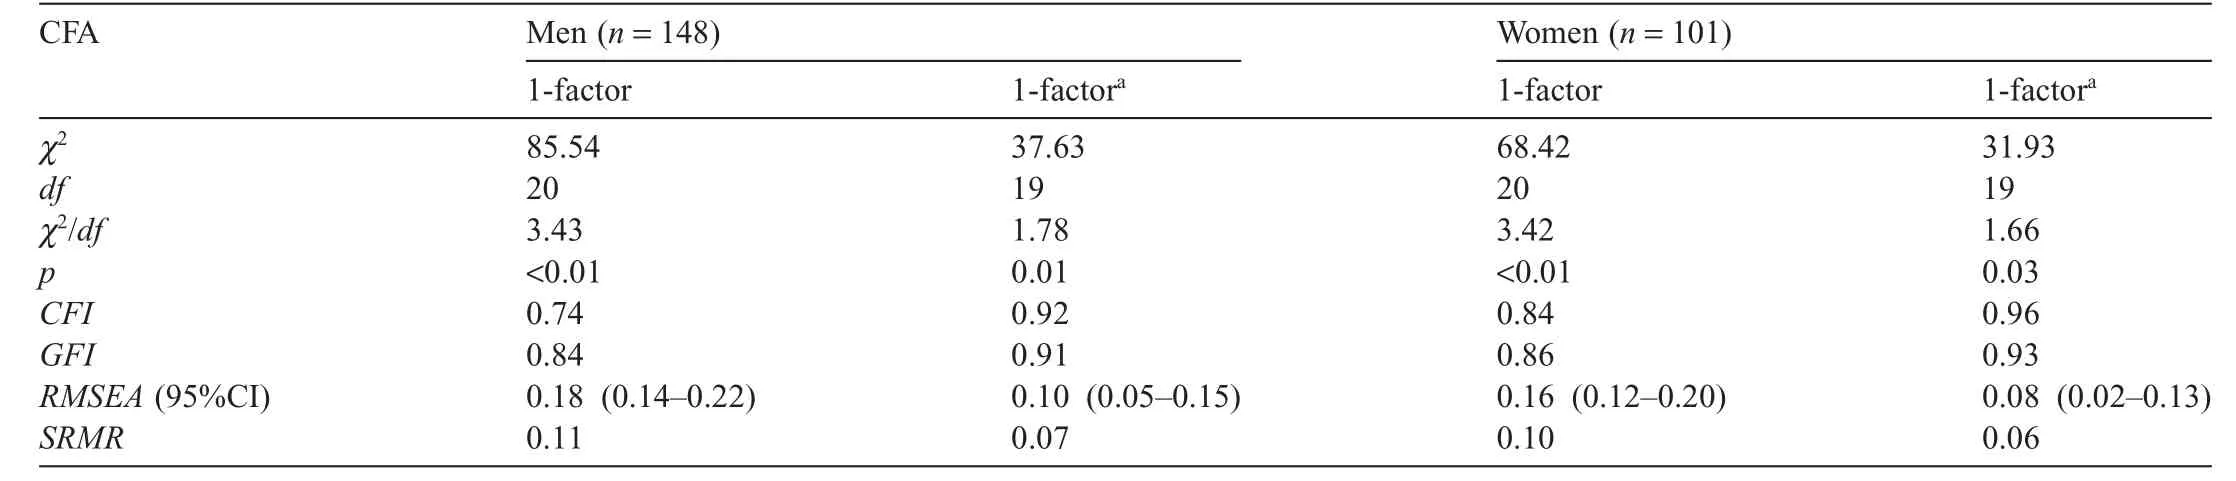
Table 5 GFIs in the con firmatory factor analyses of the VISA-P scale across sexes.
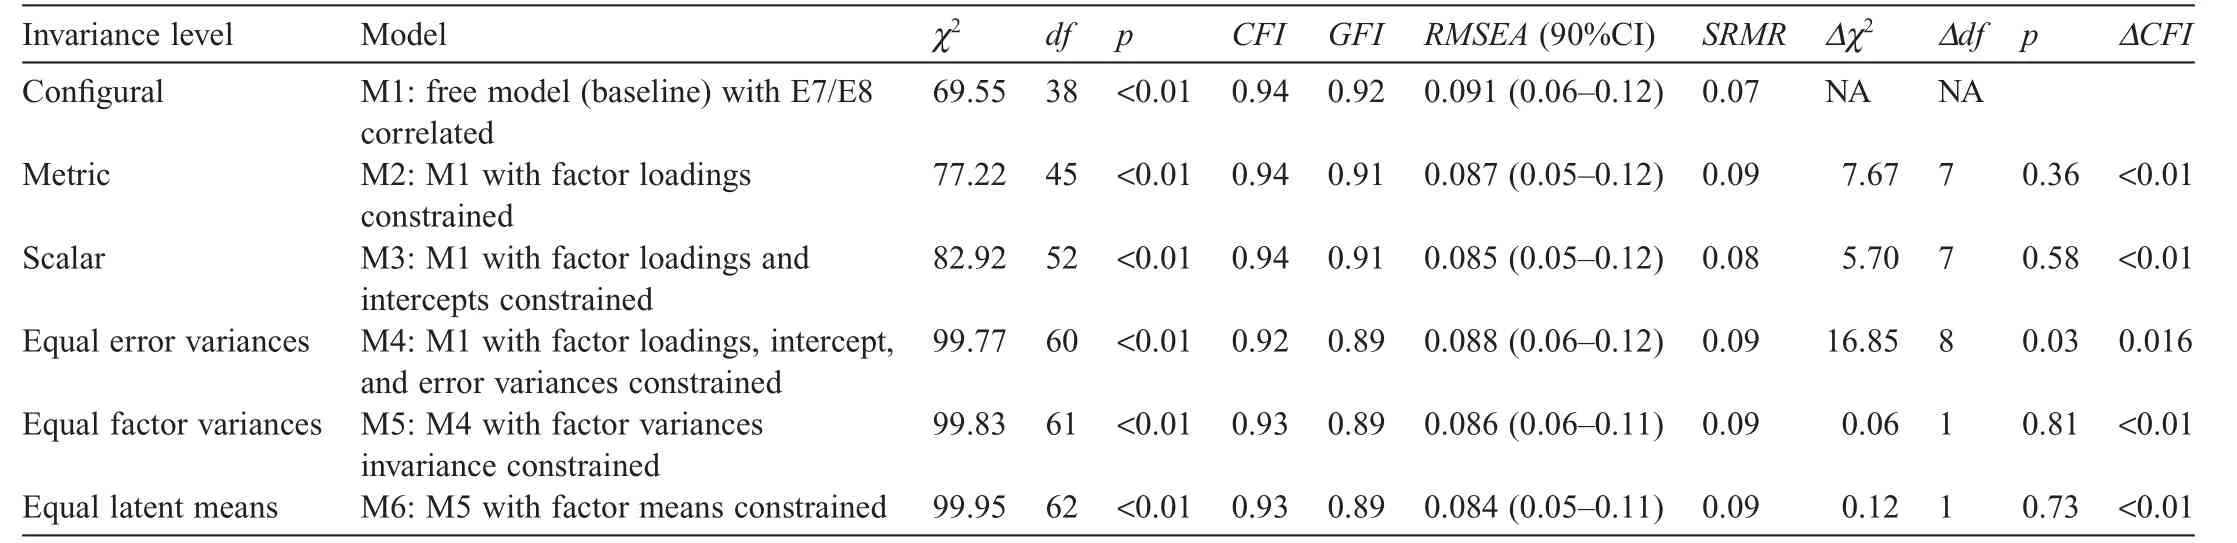
Table 6 Invariance constraints across sexes.
4.Discussion
The VISA-P scale is a condition-speci fic questionnaire that is used as a 1-dimensional tool.5In clinical practice,the final VISA-P scale is used to monitor clinical severity and the progress of symptoms in athletes with patellar tendinopathy34and is even used as a criterion for return to play sport.35Results of previous EFA7,9,11,12of the VISA-P scale have not reached consensus with respect to the dimensions underlying the severity of symptoms quanti fied by the scale.
This study represents a first attempt to examine the factor structure of the VISA-P scale using CFA,which is a multivariate statistical method that contributes to robust determination of the latent factors underlying clinical concepts.24
Our findings support the 1-dimensional model of the VISA-P scale.This result is congruent with that of a study conducted by Korakakis et al.,12in which a 1-factor solution was obtained when participants with other knee injuries were excluded from EFA.This single-factor solution explained a very high proportion of the variance.As suggested by the authors,the existence of different symptom/severity constructs in the other knee injury group may have affected factorial validity.For this reason,the current sample consisted solely of athletes with patellar tendinopathy.
Some of the results about dimensionality study require attention.In the adjusted 1-dimensional model,the factor loading for Item 7 appeared to indicate different behavior from that of the other items.Korakakis et al.12considered this possibility when they forced a 2-factor solution in their exploratory analysis.It appears that Item 7 was the main indicator in the scale for reporting“sports participation”.The con flicting CFA results for this item may have occurred as a result of the scoring formula. Four values(0,4,7,or 10)are used to rate Item 7,and this could affect the variability of the scores,in that the item is unable to re flect variability in athletes’responses or situations.Future validity studies could focus on different ways to rate this item or test various response formats to clarify this issue.
With respect to the choice of the resultant model with correlated errors in CFA,considering the statistical principle of parsimony,when 2 models have similar fit indices,the model with fewer free parameters is preferred.36Therefore,the results of this study support a single-factor model for theVISA-P scale and suggest that it should be considered a 1-dimensional instrument.However,as the scale reports on pain and disability as well as sports participation and the limitation thereof,it may re flect the impact of patellar tendinopathy on athletes’activity (disability)more realistically.Given these results,it would be interesting,as well as consistent with the International Classification of Functioning,Disability and Health(ICF),to explore more indicators of sports participation6and resubmit the scale to new analyses.Some recently published PROMs,such as the Lower Limb Functional Index,have already addressed this aspect of participation.37
Previous research has reported sexes differences in pain intensity,tolerance,duration,and thresholds.17,18In addition, Knobloch et al.38observed a gender-speci fic differential response to 12 weeks of eccentric training in patients with Achilles tendinopathy:VISA-Achilles scores revealed that, relative to men,symptomatic women reported lower pain reduction and less improvement.Taking these sexes differences and their potential in fluence on VISA-P scale pain item scores into account,the second aim of the present study was to examine measurement invariance in the model with the best fit. According to Cheung and Rensvold,26a difference of<0.01 in Cfivalues indicates that the invariance hypothesis should not be rejected,and de finite differences exist when differences in Cfivalues are>0.02.Considering this rule,manifest mean levels,latent mean comparisons,and results indicating that VISA-P scale items have the same meanings across sexes suggest that comparison across sexes is meaningful.This is an important finding,as differences in observed scores between men and women may not be directly comparable without evidence of measurement invariance across sexes.39
There is a possibility that the sexes differences in pain reported in the literature are less pronounced in athletes.40The physical effort,coping strategies,greater motivation,and increased pain tolerance and thresholds inherent in athletes may contribute to homogeneous behavior in men and women.41Nevertheless,VISA-P scales were not affected by sexes in our study.
The following limitations should be considered when interpreting these results.We employed a convenience sample of Spanishinjuredathletes,whichmaynothavebeenrepresentative of all athletes with patellar tendinopathy.It is unclear whether these results could be generalized to other populations in terms of ethnicity,sport discipline,or geographical area.With a larger sample size,it would be interesting to examine the factorial invariance of the VISA-P scale across ages(e.g.,adolescents, adults,and older adults)and severity subgroups(e.g.,competitiveand recreational athletes)to identify potentialdifferences in latent variables.In addition,the lack of assessment of different subgroups according to clinical characteristics and psychologicalandsocio-demographicstatusisanotherpotentiallimitation. Accordingly,such measurement of invariance would be desirable to avoid misinterpretation of differences in VISA-P scale between athletes from different countries and cultures.
5.Conclusion
The results of the present study indicated that the original 1-factor model of the VISA-P scale showed relative fit in a sample of Spanish athletes with chronic patellar tendinopathy. However some data suggested that additional factors could represent the underlying structure of the scale more accurately; therefore,further research is required.In addition,the 1-factor VISA-P scale structure with correlation of the errors for Items 7 and 8 was invariant across sexes,which indicates that men and women share a uniform structure of symptom severity,and theirVISA-P scale can be compared while avoiding sexes bias. Further larger studies are required to examine theVISA-P scale and other PRO measures with a single score concurrently.
Authors’contributions
SHS conceived of the study,contributed to the acquisition of data,and wrote the first draft of the manuscript;MDH andACV carried out the statistical analyses and helped to draft the manuscript;FA,JMSI,andVS contributed to data collection from the sports medicine and physiotherapy clinics and provide critical comments on the manuscript.All authors have read and approved the final version of the manuscript,and agree with the order of presentation of the authors.
Competing interests
The authors declare that they have no competing interests.
1.Lian OB,Engebretsen L,Bahr R.Prevalence of jumper’s knee among elite athletes from different sports:a cross-sectional study.Am J Sports Med 2005;33:561–7.
2.Davidson M,Keating J.Patient-reported outcome measures(PROMs):how should I interpret reports of measurement properties?A practical guide for clinicians and researchers who are not biostatisticians.Br J Sports Med 2014;48:792–6.
3.Fischer D,Stewart AL,Bloch DA,Lorig K,Laurent D,Homan H. Capturing the patient’s view of change as a clinical outcome measure. JAMA 1999;282:1157–62.
4.Davis JC,Bryan S.Patient reported outcome measures(PROMs)have arrived in sports and exercise medicine:why do they matter?Br J Sports Med 2015;49:1545–6.
5.Visentini PJ,Khan KM,Cook JL,Kiss ZS,Harcourt PR,Wark JD.The VISA score:an index of severity of symptoms in patients with jumper’s knee(patellar tendinosis).J Sci Med Sport 1998;1:22–8.
6.Scott A,Docking S,Vicenzino B,Alfredson H,Murphy RJ,Carr AJ,et al. Sports and exercise-related tendinopathies:a review of selected topical issues by participants of the second International Scienti fic Tendinopathy Symposium(ISTS)Vancouver 2012.Br J Sports Med 2013;47:536–44.
7.Frohm A,Saartok T,Edman G,Rënstrom P.Psychometric properties of a SwedishtranslationoftheVISA-Poutcomescoreforpatellar tendinopathy.BMC Musculoskelet Disord 2004;5:49.
8.Maffulli N,Longo UG,Testa V,Oliva F,Capasso G,Devaro V.VISA-P score for patellar tendinopathy in males:adaptation to Italian.Disabil Rehabil 2008;30:1621–4.
9.Zwerver J,Kramer T,van der Akker-Scheek I.Validity and reliability of the Dutch translation of VISA-P questionnaire for patellar tendinopathy. BMC Musculoskelet Disord 2009;10:102.doi:10.1186/1471-2474-10-102
10.Lohrer H,Nauck T.Cross-cultural adaptation and validation of theVISA-P questionnaire for German-speaking patients with patellar tendinopathy.J Orthop Sports Phys Ther 2011;41:180–90.
11.Hernandez-Sanchez S,Hidalgo MD,Gomez A.Cross-cultural adaptation ofVISA-P score for patellar tendinopathy in Spanish population.J Orthop Sports Phys Ther 2011;41:581–91.
12.Korakakis V,Patsiaouras A,Malliaropoulos N.Cross-cultural adaptation of the VISA-P questionnaire for Greek-speaking patients with patellar tendinopathy.Br J Sports Med 2014;48:1647–52.
13.Wageck BB,de Noronha M,Lopes AD,da Cunha RA,Takahashi RH, Costa LO.Cross-cultural adaptation and measurement properties of the BrazilianPortuguese Versionofthe VictorianInstituteofSport Assessment-Patella(VISA-P)scale.J Orthop Sports Phys Ther 2013;43: 163–71.
14.Park BH,Seo JH,Ko MH,Park SH.Reliability and validity of the Korean version VISA-P questionnaire for patellar tendinopathy in adolescent elite volleyball athletes.Ann Rehabil Med 2013;37:698–705.
15.Mokkink LB,Terwee CB,Patrick DL,Alonso J,Stratford PW,Knol DL, et al.The COSMIN study reached international consensus on taxonomy, terminology,and de finitions of measurement properties for health-reported outcomes.J Clin Epidemiol 2010;63:737–45.
16.Osborne J.Best practices in quantitative methods.Thousand Oaks,CA: Sage Publications,Inc.;2007.
17.Glass N,Segal NA,Sluka KA,Torner JC,Nevitt MC,Felson DT,et al. Examining sex differences in knee pain:the multicenter osteoarthritis study.Osteoarthritis Cartilage 2014;22:1100–6.
18.Bartley EJ,Fillingim RB.Sex differences in pain:a brief review of clinical and experimental findings.Br J Anaesth 2013;111:52–8.
19.Khan KM,Visentini PJ,Kiss ZS,Desmond PM,Coleman BD,Cook JL, et al.Correlation of ultrasound and magnetic resonance imaging with clinical outcome after patellar tenotomy:prospective and retrospective studies.Clin J Sport Med 1999;9:129–37.
20.Finney SJ,DiStefano C.Non-normal and categorical data in structural equation modeling.In:Hancock G,Mueller R,editors.Structural equation modeling:a second course.Greenwich,CT:Information Age Publishing; 2006.p.269–314.
21.Bentler PM.EQS 6.1:structural equations program manual.Encino,CA: Multivariate Software,Inc.;2006.
22.Dimitrov DM.Comparing groups on latent variables:a structural equation modelling approach.Work 2006;26:429–36.
23.Meredith W,Teresi JA.An essay on measurement and factorial invariance. Med Care 2006;44(Suppl.3):S69–77.
24.Brown TA.Con firmatory factor analysis for applied research.2nd ed.New York,NY:Guilford Press;2006.
25.Jackson DL,Gillaspy JA,Purc-Stephenson R.Reporting practices in con firmatory factor analysis:an overview and some recommendations. Psychol Methods 2009;14:6–23.
26.Cheung GW,Rensvold RB.Evaluating goodness-of- fit indexes for testing measurement invariance.Struct Equ Modeling 2002;9:233–55.
27.Hu L,Bentler PM.Cutoff criteria for fit indexes in covariance structure analysis:conventional criteria versus new alternatives.Struct Equ Modeling 1999;6:1–55.
28.Kline RB.Principles and practice of structural equation modeling.2nd ed. New York,NY:Guilford Press;2005.
29.Schumacker RE,Lomax RG.A beginner’s guide to structural equation modeling.2nd ed.Mahwah,NJ:Lawrence Erlbaum Associates;2004.
30.MacCallum RC,Widaman KF,Zhang S,Hong S.Sample size in factor analysis.Psychol Methods 1999;4:84–99.
31.Ding L,Velicer WF,Harlow LL.Effects of estimation methods,number of indicators per factor,and improper solutions on structural equation modeling fit indices.Struct Equ Modeling 1995;2:119–43.
32.Gorsuch RL.Factor analysis.2nd ed.Hillsdale,NJ:Lawrence Erlbaum; 1983.
33.Marsh HW,Hau KT,Balla JR,Grayson D.Is more ever too much?The number of indicators per factor in con firmatory factor analysis.Multivar Behav Res 1998;33:181–220.
34.Rudavsky A,Cook J.Physiotherapy management of patellar tendinopathy (jumper’s knee).J Physiother 2014;60:122–9.
35.Futbol Club Barcelona Medical Services.Guide to clinical practice for tendinopathies:diagnosis,treatment and prevention.Apunts Med Esport 2012;47:143–68.
36.Mulaik SA.Parsimony and model evaluation.J Exp Educ 1998;66:266–73.
37.Gabel CP,Melloh M,Burkett B,Michener LA.Lower limb functional index:development and clinimetric properties.PhysTher 2012;92:98–110.
38.Knobloch K,Schreibmueller L,Kraemer R,Jagodzinski M,Vogt PM, Redeker J.Gender and eccentric training in Achilles mid-portion tendinopathy.Knee Surg Sports Traumatol Arthrosc 2010;18:648–55.
39.Teresi JA.Overview of quantitative measurement methods.Equivalence, invariance,and differential item functioning in health applications.Med Care 2006;44(Suppl.3):S39–49.
40.Tesarz J,Schuster AK,Hartmann M,Gerhardt A,Eich W.Pain perception in athletes compared to normally active controls:a systematic review with meta-analysis.Pain 2012;153:1253–62.
41.Manning EL,Fillingim RB.The in fluence of athletic status and gender on experimental pain responses.J Pain 2002;3:421–8.
10 July 2015;revised 15 October 2015;accepted 2 November 2015
Available online 22 January 2016
Peer review under responsibility of Shanghai University of Sport.
*Corresponding author.
E-mail address:sehesa@goumh.umh.es(S.Hernandez-Sanchez)
http://dx.doi.org/10.1016/j.jshs.2016.01.020
2095-2546/©2017 Production and hosting by Elsevier B.V.on behalf of Shanghai University of Sport.This is an open access article under the CC BY-NC-ND license(http://creativecommons.org/licenses/by-nc-nd/4.0/).
 Journal of Sport and Health Science2017年3期
- Journal of Sport and Health Science的其它文章
- Time for a paradigm shift in the classi fication of muscle injuries
- Rehabilitation and return to sport after hamstring strain injury
- Risk factors for hamstring injuries in Australian male professional cricket players
- Relationships among hamstring muscle optimal length and hamstring flexibility and strength
- The effect of hamstring flexibility on peak hamstring muscle strain in sprinting
- Motivation dimensions for running a marathon:A new model emerging from the Motivation of Marathon Scale(MOMS)