
Estimation of Thermal Imaging System Operating Range Based on Background Radiation
2018-06-15 04:41TingzhuBaiLongShaoHengHeandPeishanSongSchoolofOptoelectronicsBeijingInstituteofTechnologyBeijing100081China
Tingzhu Bai, Long Shao, Heng He and Peishan Song(School of Optoelectronics, Beijing Institute of Technology, Beijing 100081, China)
Thermal imaging measures the infrared radiation difference between a target and a background,for target detection. It has been used in battle-fields widely because of its advantages[1]. In real combat situations, the operating range of the infrared thermal imaging system to different targets[2]is an important detail that a battlefield commander must be well-informed when making decisions.But target combat distances are vulnerable to weather conditions. The determination of background radiance[3]plays an important role in the prediction of the operating range.
1 Traditional Operating Range Equation
Traditional operating range models[4]use following equations as
(1)
wherefis the target spatial frequency,his the target height,Neis the number of equivalent stripes (half-cycles) which are required to discover, locate, identify, and recognize targets according to Johnson’s criteria, ΔTis the temperature difference between a target and a background of the thermal imaging system entrance pupil, MRTD(f) stands for minimum resolvable temperature difference (MRTD) of a thermal imaging system, andRis the operating range which can be obtained from these equations. ΔTcan be calculated using the following equation as
ΔT=ΔT0τ(R)
(2)
where ΔT0is the temperature difference between a target and a background at zero-line-of-sight,τ(R) is the average atmospheric transmittance of an imaging path.
However, increasing temperature difference would increase the error of the calculation by using Eq.(2) in the process of target detection[5]. Therefore, in 2015, He Heng in Beijing Institute of Technology revised the traditional operating range prediction formula. A distance prediction model in an infrared imaging system based on the difference of radiative emission is proposed without theoretical error[6]. This formula can describe the physical process of infrared radiation energy transfer with
(3)
where ΔMis the difference of radiative emission between a target and a background of the entrance pupil, and ΔMMRTD(f)is the minimum resolvable radiance difference of the thermal imaging system, which is given by
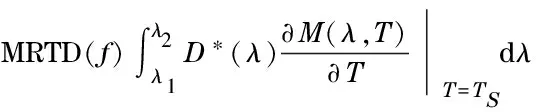
(4)
whereD*(λ) is the peak ratio detection rate, andTSis the room temperature, generally taking 300 K.
However, the traditional operating range Eq.(1) and Eq.(3) cannot explain the influence of atmospheric radiance well[7]. In order to analyze the effects of atmospheric radiation attenuation and atmospheric radiance to the operating range, this paper proposes an operating range model based on image background radiances (REBR).
2 Atmospheric Radiance Effects
Although the traditional operating range formulas use temperature difference to measure the operating range, the equations are consistent with radiative emission. According to Eq. (3), the operating rangeRcan be calculated from the difference of the radiative emission as
(5)
ΔM=ΔM0τ(R) is used to calculate the radiation difference between the target and background of the system entrance pupil. The assumption for this equation is that the target should be at the same distance as the background since the atmospheric radiance of the target and background is equal. But in a real-world scenario, the distances of a target and a background are generally not the same, so the corresponding atmospheric radiance values are not equal.
The difference of radiative emission between a target and a background of the entrance pupil can be obtained by
ΔM=Mt-Mb
(6)
MtandMbis calculated by
(7)
whereMRtandMRbare atmospheric radiance on target and background paths, respectively. Since theMRtandMRbare not equal in real condition, the actual contrast between the target and the background will be smaller than the theoretical value of the traditional method. Thus, the actual operating range value should be smaller than the traditional operating range value.
3 Modification of Operating Range Equation
The difference of radiative emission between the target and the background of the entrance pupil should be greater than or equal to ΔMMRTD(f), and the angle of the target to the system should be greater than or equal to the minimum viewing angle required by the detection level. However, this process does not take atmospheric radiance of the target and background into account. From Eq.(7), it can be gotten that the difference in the radiative emission truly reflects the influence of atmospheric transmission, given by
ΔM=[τ(Rt)Mt0+MRt]-[τ(Rb)Mb0+MRb]
(8)
whereτ(Rt),τ(Rb) are the atmospheric transmittance value on the target and background path, respectively,Mt0,Mb0are the radiation value of the target and background at zero line-of-sight, respectively.
In real environment, the distance between background of the target and the infrared detector is difficult to be measured. Therefore, in Eq.(8),τ(Rb) andMRbis difficult to be calculated by the program MODTRAN, and the zero line-of-sight background radiative emission valueMb0cannot be accurately calculated. Thus, the background radiance value in the entrance pupilMbcannot be calculated by common computer software program.
The raw data (14 bit data) that was collected by the infrared thermal imager reflected the real response of the detector to the infrared radiation.Hence, the system entrance pupil radiation spatial distribution can be obtained by the 14 bit data of infrared thermal imager. In the operating range estimation, it is often used to predict the operating range of different types and sizes of objects in a given scene. We can obtain the spatial distribution of the background radiance of the system entrance pupil from 14 bit raw data. The operating range equation based on the background radiance is obtained as
(9)
The meaning of Eq.(9) is as follows: radiation of the target at zero line-of-sightMt0is attenuated by the atmosphere over the distanceRt, the radiation difference between the target and the background of the entrance pupil is exactly equal to the minimum resolvable radiation difference ΔMMRTD(f), and corresponds to the spatial frequency of the target,Ris the operating range value that can be obtained from Eq.(9).
4 Solution of the Background Radiation in Entrance Pupil
It can be seen from the above analysis that the key to solve Eq.(9) is to find the entrance pupil background radiance valueMb.
In this section, we propose a computational method based on infrared radiometric calibration[8]to calculateMb. The target in the sea-sky background usually appears in the sky, the sea-sky antenna,or the sea surface.
Firstly, the sea-sky antenna is found in the image which will be used as the criterion to determine the size of the background area. Secondly, the average gray value of the background area is obtained. Finally, the background radiance value with the radiation calibration data and average gray value can be deduced.
4.1 Adaptive Canny operator and Hough transform method to detect sea-sky antenna
The sea-sky antenna is similar to the separation of the sky and the sea line when observing the sea from a long distance, thus the detection of the sea-sky antenna is equivalent to detecting the edge line under strong background noise in the sky and the sea surface. In this study, the Hough transform method is used to detect the sea-sky antenna. However, if the Hough transform method is directly performed on the original image, the computational value is too large and the sea-sky antenna cannot be detected accurately due to the influence of the noise. Therefore, the Canny edge detection algorithm is used in the first place when encountering this problem[9].
4.1.1Advanced adaptive Canny algorithm[10]
Traditional Canny algorithm[11]has the following limitations: Gaussian filter smoothing noise will make the edge fuzzy, non-maxima suppression is only using a single point of comparison to determine the local maximum point, which is more sensitive to noise and not accurate. The threshold in the binarization process needs to be determined artificially while the adaptability is not enough. Therefore, the traditional Canny algorithm is improved in the following ways.
① Image smoothing
In order to reduce the impact of the background noise, a filter should be used to smooth the noise. Median filter[12]can protect the edge while filtering out the noise, the algorithm is simple and easy to implement. So the Gaussian filter is replaced by the Median filter.
② Sobel operator edge detection
The Sobel operator[13]is the edge detection operator of the first derivative. The third-order template is shown in Fig. 1. During the algorithm realization, the 3×3 template is used as the convolution sum of each pixel in the kernel and image, and then the appropriate threshold is selected to extract the edge.

Fig.1 Pixel of Sobel operator template
The value of the template is
(10)
When the image is convoluted by using the Sobel operator template, the difference in the horizontal direction is
fh=2G(x,y+1)-2G(x,y-1)+
G(x-1,y+1)-G(x-1,y-1)+
G(x+1,y+1)-G(x+1,y-1)
(11)
The vertical difference is
fv=2G(x+1,y)-2G(x-1,y)+
G(x+1,y+1)-G(x-1,y+1)+
G(x+1,y-1)-G(x-1,y-1)
(12)
The resulting gradient amplitude and gradient direction are
(13)
(14)
The first-order partial derivatives of the horizontal, vertical, 45° and 135° directions around the center pointG(x,y) are
(15)
After the appropriate combination of Eqs.(11)-(15) we can obtain
(16)
The Sobel operator takes into account the first-order partial derivative of the horizontal, vertical, 45°and 135°directions. This makes the Sobel operator capable for both the localization accuracy and the noise suppression requirement in the edge detection.
③ Non-maxima suppression
The interpolation method is used to obtain the amplitude in the gradient direction. The interpolation result is compared with the current point, and it is judged whether the current point is the local maximum point.
Interpolation point selection principle is[10]: select two points in the gradient direction to interpolate and compare, the gradient direction is determined by the absolute value of the vertical deflectionfvand the horizontal deflectionfhof each point. Suppose 0 is the current pixel,G1,G2,G3,G4are the points used for interpolation, when the vertical deflection is greater than the horizontal deflection, the gradient direction will be closer to the vertical direction, thus the point of the horizontal direction in the upper and lower rows of this pixel is used to execute interpolation,with the scale factor ofw=|fh/fv|. When the horizontal deflection is greater than the vertical deflection, the gradient direction will be closer to the horizontal direction, thus the point of vertical direction in the left and right rows of this pixel is used to execute interpolation, with the scale factor ofw=|fv/fh|.
From the method introduced above, we will obtain the interpolation point as
(17)
whereM(Gi) is the pixel value of the pointGi. IfM(G)≥v1andM(G)≥v2,M(G) is the maximum point, otherwise it is a non-maximum point.
④ Dual threshold binarization
The threshold selection in the conventional dual-threshold binarization method[14]is generally based on a large number of experiments to select a suitable threshold, but this method is not suitable here. Therefore, OSTU algorithm[15]is used for the threshold selection in this paper.
Maximum interclass variance method (OSTU) is based on the image pixel gray value to divide the image into the target classC0and background classC1, the threshold for segmentation ist, the gray scale valueC0is between 0 andt, and the gray scale valueC1is between (t+1) toL(Lis the number of primary gradation of the image). We hypothesize thatσ(t)2is the interclass variance, and then the gray valuet*that makesσ(t)2as the maximum value is called the optimal threshold value as
σ(t)2=w1(t)w2(t)(u1(t)-u2(t))2
(18)
(19)
wherew1(t) is the number of pixels whose gray value is smaller than the threshold valuet,w2(t) is the number of pixels whose gray value is greater than the threshold valuet,u1(t) is the average gray value of the pixel whose gray value is smaller thantin the image,u2(t) is the average gray value of the pixel whose gray value is greater thantin the image.
The threshold valuetcalculated from Eq.(18) and Eq.(19) can be considered as the low thresholdLthin the double threshold, the high threshold isHth=2Lth. Adaptive threshold selection is done by using OSTU method.
4.1.2Hough transform method
Hough transform method[16]is based on the dot-line duality principle. The Hough transform method transforms the line detection problem into the point detection problem in the parameter plane, as shown in Fig.2.
Fig.2 shows that there are numerous lines through a point (xi,yi), their diagonal equation isyi=axi+b, if the equation is written inb=-xia+yi, the fixed point (xi,yi) of the linear equation is obtained. On the other hand, in the parameter plane, the other point (xj,yj) also has its unique line, this line intersects the line of point (xi,yi) at point (a′,b′), wherea′ andb′ are the slope and the intercept of a straight line that containing point (xi,yi) and point (xj,yj). Thus the line detection problem is transformed into the point detection problem.

Fig.2 Theory of Hough conversion
The Hough transform method divides the parameter space into accumulator units, accumulating each point of the image, and the maximum point of the accumulator is the slope and intercept of the line that will be tested.
4.2 Determine the size of the background area
After detecting the sea-sky antenna, it is necessary to further determine the size of the background area and its gray value[9]. The infrared image acquired by infrared thermal imager and its grayscale distribution data are shown in Fig.3.
Fig.3a is the sea-sky infrared image, Fig.3b is the corresponding grayscale value data, the horizontal axis represents the pixel value from the top to the bottom of the image, and the vertical axis represents the gray scale value. In Fig. 3b, there is a transition in the gray value at the pixel index with value 300, which is the location of the sea-sky antenna. Due to the influence of the atmospheric radiance, the gray value of the sky region gradually increases from the top of the image to the position of the sea-sky antenna.

Fig.3 Sea-sky image and its gray change rule
After carrying out the radiometric calibration of infrared thermal imager, we found that on avoiding influence from the sun, the range of the temperature changes are not large, thus it would be more appropriate to take a certain size of the sea and the sky as the background area around sea-sky antenna.
When the sea-sky antenna is placed in the middle of the field of view, the heightHof the sky from the sea-sky antenna to the image top is
(20)
whereDis the earth radius,dis the observation height,ωis vertical half field angle. In an experiment, the vertical half field angle of the device isω=2.6°, the observation height is 10 m, and the earth radius is 6 371 km, calculating from Eq.(20):H≈512 m. Thus, a 512 m high object near the sea-sky antenna occupies about half of the image height. The resolution of the infrared thermal imager is 640×512, a 2 m high object occupies about a pixel size in the vertical direction. The height of a general target on the sea is less than 60 m, considering the influence of the distance between the target and the infrared thermal imager to the visual size, we take 80 m (40 pixels) as the boundary of the background area, and the boundaries are shown in Fig.4.
In Fig. 4, the middle line represents the sea-sky antenna, and up and down the two lines represent the boundary line of the background area. The distance between the up line and the middle line is about 40 pixels.
4.3 Radiometric calibration
The radiometric calibration of the infrared thermal imager is establishing the quantitative relationship between the gray value and the target radiation temperature value. The output signal of the infrared thermal imager has a positive correlation with the radiation intensity of the target. The method of radiation calibration is to set the standard blackbody to different temperature values in the darkroom, and obtain the blackbody gray value in each temperature.

Fig.4 Background region size diagram
After obtaining the gray value of the infrared image background area and the radiation calibration data, the temperature value of the background area will be obtained, following which the background radiation valueMbof the entrance pupil can be obtained with Planck radiation formula.
4.4 Solve the operating range equation
Iterative algorithms are used to solve the operating range equation. In this paper, the semi-fraction method is applied to solve the equation of the traditional method and the advanced method. Taking Eq.(9) as an example, its solution process is shown in Fig.5.
In Fig. 5,τ(Rt),MRtcan be calculated by program MODTRAN,R1andR2are the range of the estimated operating range from Eq.(9), the initial distanceR0is set to a value betweenR1andR2. Firstly, calculate the atmospheric transmittance and atmospheric radiance withR0, and then calculate the radiation difference between the target and the background,so we can determine whether the radiative emission difference meet the accuracy of the solutione. ΔMand ΔMMRTD(f)are calculated as
(21)
whereMt0is the target radiation value at zero line-of-sight distance,τ(R0) is the atmospheric transmittance at the distanceR0,MR0is the atmospheric radiance at the distanceR0,Mbis the background radiance value obtained from the radiometric calibration of the image,TS=300 K is the laboratory temperature at the MRTD measurement and solution accuracye=0.1. When the results do not reach the accuracy, discard half of the value range according to the value of Δ, and repeat the above steps in the new range of values until Δ meet the accuracy, at which timeR0is the operating range.

Fig.5 Solution flow chart of the operating range equation
5 Experimental Results and Discussion
5.1 Radiometric calibration of blackbody
The infrared thermal imager used in the experiment is FILR’s Tau2-640 movement with Bop’s 4x focusing lens. The main performance parameters are shown in Tab. 1. In Tab. 1, wavelength range is 7.5-13.5 μm, and the number of pixels is 640×512, the NETD of infrared thermal imager is less than 50 mK, the vertical field of view is less than 5.2°.
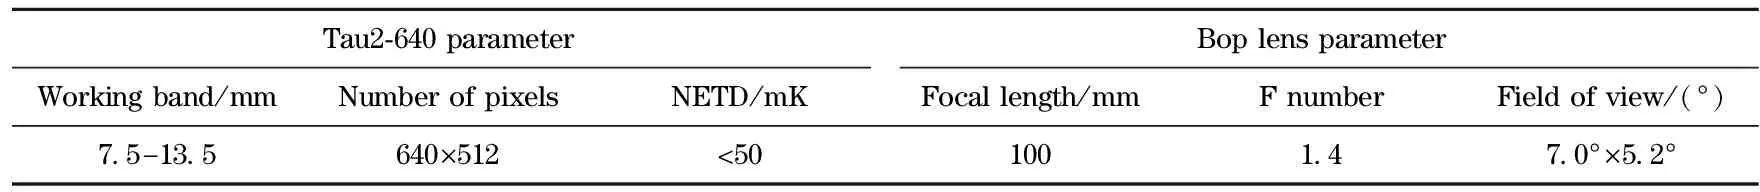
Tab.1 Parameters of infrared thermal imager
The IR-2103/301type blackbody was adopted. During the experiment, the environment temperature was 30.3°C and the relative humidity was 21%. Considering the operating temperature range of the infrared thermal imager, we calibrated the temperature range to 0-60 ℃, and the sampling interval was 2 ℃. The radiometric calibration results are shown in Fig. 6. The abscissa axis of Fig. 6 is the blackbody temperature value,with units of degree centigrade, and the vertical coordinate is the gray value of the blackbody.The experimental results in Fig. 6 show that the gray value of the blackbody increase with increasing blackbody temperature. After fitting the data we found that because of the impact of environment temperature, the curve slightly deviated from the center line in the range of the blackbody temperature below 30 ℃. The overall curve is approximate to a straight line showing that the output signal of the infrared thermal imager is approximately linearly positive related to the radiation intensity of the target.
In order to obtain the correspondence between blackbody temperature value and its gray value, we use a sixth-order curve with MATLAB polynomial to fit the data, the result is
(22)
whereTis the blackbody temperature, andGis gray value.

Fig.6 Blackbody calibration data
5.2 Calculation of background radiation and operating range
The temperatureTbcalculated above is substituted into the Planck formula as
(23)
whereC1is the first radiation constant,C1=3.741 8×10-16(W·m2),C2is the second radiation constant,C2=1.438 8×10⁻²(m·K), and the average wavelength isλ=10.5 μm. The desired value of background radiationMbis obtained.
In Fig. 7, the area between the two lines above and below the sea-sky antenna is the background area of the target, the size of the fishing boat is about 40 m×8 m, the temperature is 300 K, the emissivity is 0.9, and the observation probability is 90%. The traditional method represented by Eq.(1) and the improved method REBR represented by Eq. (9) are respectively solved for the operating range. The radiation value calculation result in the background area of Fig.7 is shown in Tab.2, the operating range calculation results of the traditional method and the improved method REBR are shown in Tab.3. In Tab.2,Pdenotes background gray value,Tdenotes background temperature,Mbis the background radiance value, we get the gray value of the background region by a MATLAB program, and then we can obtain the average temperature value and the radiation value of the background region from Eqs.(22)(23).

Fig.7 Sea-sky infrared image

Tab.2 Calculation result of background radiation

Tab.3 Contrasting of operating range calculation results
The observation height is 1 m in the experiment, the sea-sky antenna distance is about 3.57 km, calculated from Eq.(20). In Fig.7, the ship is on the sea-sky antenna, thus the distance between the ship and the observation position is about 3.57 km. In Tab.3,R3andR4are the operating range values of the REBR method and the traditional method, respectively. From Tab.3, we found that the detection level is “distinguish”, the relative error between the result of the REBR method and the true distance value is 16.53%, the relative error between the result of the traditional method and the true distance value is 29.41%, showing that the REBR method is more accurate. The influence of the atmospheric radiance to the operating range will increase with increasing distance, thus the radiation difference between the target and the background will decrease, and this will make it harder for the system to distinguish the target and the background. Because the traditional method does not consider the impact of atmospheric radiance,therefore, the actual operating range value of the system should be smaller than the traditional method value.
6 Conclusion
In this paper, the operating range Eq.(9) that contains atmospheric radiance effects is proposed. The image sea-sky antenna is detected by adaptive Canny operator and Hough transform method, and then the size of the background area according to the sea-sky antenna is determined. After obtaining the background radiance value, an iterative method is used to solve the operating range equation. The experimental results indicate that the proposed method (REBR) is more simple and accurate than the conventional operating range prediction method, and more suitable for the real-world situation of atmospheric transmission.
[1] Sun Z, Hui B. A simple and efficient object detection method based on saliency measure for infrared radiation image[C]∥International Symposium on Optoelectronic Technology and Application 2014. International Society for Optics and Photonics, 2014: 930130.
[2] Liu Zewen, Cao Fengmei, Wang Quanxi, et al.The performance assessment software design of shipboard infrared imaging system[C]∥Third Infrared Imaging System Simulation, Testing and Evaluation of Technical Symposium, Chinese Society of Astronautics, 2011: 5. (in Chinese)
[3] Li Liumiao. The study of infrared radiation characteristics of sea and sky background target [D]. Xi’an: Xidian University, 2011. (in Chinese)
[4] Bai Tingzhu.Optical imaging technology and systems [M].Beijing:Electronic Industry Press,2016. (in Chinese)
[5] Hu Jianghua, Zhou Jianxun, Zhang Baomin. Evaluation principle of infrared thermal image stealth [J]. Infrared Technology, 1995, 2(6): 25-27.(in Chinese)
[6] He Heng, Bai Tingzhu. Calculation error analysis of the distance equation for infrared imaging [J]. Infrared Technology, 2015, 37(9):713-718.(in Chinese)
[7] Dong Renjie, Li Tongji, Chen Qinglian,et al. Methods for calculation of atmospheric transmittance and radiance in thermal infrared band[J].Marine Technology,2006, 19(2):78-83. (in Chinese)
[8] Sun Zhiyuan, Chang Songtao, Zhu Wei. Simplifying method of radiance calibration for MWIR detector[J]. Infrared and Laser Engineering,2004,43(7):2132-2137. (in Chinese)
[9] He Heng. Research of the operating range prediction of the infrared imagining detection system based on sea sky background[D]. Beijing: Beijing Institute of Technology, 2016. (in Chinese)
[10] Jin Gang. Adaptive Canny algorithm research and its application in image edge detection [D].Hangzhou:Zhejiang University,2011. (in Chinese)
[11] Xu J, Wan Y, Zhang X. A method of edge detection based on improved canny algorithm for the lidar depth image[C]∥Geoinformatics 2006: Remotely Sensed Data and Information, International Society for Optics and Photonics, 2006: 64190O.
[12] Gao Wenjing, Qian Kemao, Wang Haixia, et al. General structure for real-time fringe pattern preprocessing and implementation of median filter and average filter on FPGA[C]∥Proc SPIE 2008, 7155: 71550Q.
[13] Tong X, Ren A, Zhang H, et al. Edge detection based on genetic algorithm and sobel operator in image[C]∥2011 International Conference on Graphic and Image Processing. International Society for Optics and Photonics, 2011: 828572.
[14] Hasenplaugh W C, Neifeld M A. Image binarization techniques for correlation-based pattern recognition[J]. Optical Engineering, 1999, 38(11): 1907-1917.
[15] Li Mu, Yan Jihong, Li Ge, et al. Self-adaptive Canny operator edge detection technique[J]. Journal of Harbin Engineering University,2007, 28(9):1002-1007. (in Chinese)
[16] Lee D, Park Y. Discrete Hough transform using line segment representation for line detection[J]. Optical Engineering, 2011, 50(8): 087004.
 Journal of Beijing Institute of Technology2018年2期
- Journal of Beijing Institute of Technology的其它文章
- Two-Dimensional Direction Finding via Sequential Sparse Representations
- Curvature Compensated CMOS Bandgap Reference with Novel Process Variation Calibration Technique
- Energy Optimization Oriented Three-Way Clustering Algorithm for Cloud Tasks
- Different Frequency Synchronization Theory and Its Frequency Measurement Practice Teaching Innovation Based on Lissajous Figure Method
- Multi-Object Tracking Based on Segmentation and Collision Avoidance
- Anti-Windup Control Strategy of Drive System for Humanoid Robot Arm Joint