
Using multi-satellite microwave remote sensing observations for retrieval of daily surface soil moisture across China
2019-07-24 07:34ZhngLijunChoQingqingWngYingchunHungRonghuLiuYngHongYongTuWiQuJinyin
Water Science and Engineering 2019年2期
K Zhng *, Li-jun Cho , Qing-qing Wng , Ying-chun Hung , Rong-hu Liu *,Yng Hong , Yong Tu Wi Qu Jin-yin Y
a State Key Laboratory of Hydrology-Water Resources and Hydraulic Engineering, Hohai University, Nanjing 210098, China
b College of Hydrology and Water Resources, Hohai University, Nanjing 210098, China
c China Institute of Water Resources and Hydropower Research, Beijing 100038, China
d Research Center on Flood & Drought Disaster Reduction of the Ministry of Water Resources, Beijing 100038, China
e School of Civil Engineering, Tsinghua University, Beijing 100084, China
f Anhui Branch of China Meteorological Administration Training Centre, Hefei 230031, China
Abstract The objective of this study was to retrieve daily composite soil moisture by jointly using brightness temperature observations from multiple operating satellites for near real-time application with better coverage and higher accuracy. Our approach was to first apply the single-channel brightness radiometric algorithm to estimate soil moisture from the respective brightness temperature observations of the SMAP, SMOS,AMSR2,FY3B,and FY3C satellites on the same day and then produce a daily composite dataset by averaging the individual satellite-retrieved soil moisture.We further evaluated our product,the official soil moisture products of the five satellites,and the ensemble mean(i.e.,arithmetic mean) of the five official satellite soil moisture products against ground observations from two networks in Central Tibet and Anhui Province,China.The results show that our product outperforms the individual released products of the five satellites and their ensemble means in the two validation areas. The root mean square error (RMSE) values of our product were 0.06 and 0.09 m3/m3 in Central Tibet and Anhui Province,respectively.Relative to the ensemble mean of the five satellite products,our product improves the accuracy by 9.1%and 57.7%in Central Tibet and Anhui Province, respectively. This demonstrates that jointly using brightness temperature observations from multiple satellites to retrieve soil moisture not only improves the spatial coverage of daily observations but also produces better daily composite products.
Keywords: Soil moisture retrieval; Passive microwave remote sensing; Multiple satellites; Surface hydrology; SMAP; SMOS; AMSR2; FY3B; FY3C
1. Introduction
Soil moisture is a key variable in water cycles and climate systems. It can impact hydrological, meteorological, and ecological processes by controlling hydrological processes(Crow and Ryu, 2009; Morbidelli et al., 2016), land surface energy balances (Gallego-Elvira et al., 2016) and albedo (Liu et al., 2014; Zhang et al., 2014), soil thermal properties(Juszak et al., 2016; Sugathan et al., 2014), and vegetation dynamics and functions (Flanagan and Johnson, 2005; He et al., 2016; Huang et al., 2016; Xia et al., 2017; Xu et al.,2004). As soil moisture interacts with many environmental variables such as albedo, land surface temperature, soil evaporation, plant transpiration, and precipitation, soil moisture is essential to the interactions between the earth's surface and atmosphere (Berg et al., 2014; Ford et al., 2015; Lin and Cheng,2016;Suarez et al.,2014)and especially the exchanges of water and carbon (Jia et al., 2016; McInerney and Helton,2016; Xu and Zhou, 2005).
Gaining accurate soil moisture information is critical to understanding hydrological, meteorological, and ecological processes, and improving hydrological forecasting, weather prediction, and estimates of terrestrial carbon fluxes. Soil moisture is traditionally measured in situ to obtain accurate information on the point level with high temporal resolution,but these measurements have limited spatial coverage(Dorigo et al., 2011). Satellite microwave remote sensing of soil moisture is an alternative method for estimating land surface soil moisture with continuous spatial coverage and reasonable temporal resolution. Many satellite active and passive microwave sensors launched since the 1970s have been widely used to estimate regional and global surface soil moisture,including the Scanning Multichannel Microwave Radiometer (SMMR)(Paloscia et al., 2001), Advanced Microwave Scanning Radiometer on the Earth Observing System (AMSR-E) (Du et al.,2016; Njoku et al., 2003), Soil Moisture and Ocean Salinity Sensor (SMOS) (Kerr et al., 2012; Wigneron et al., 2017),Advanced Scatterometer (ASCAT) (Lindell and Long, 2016),Fengyun Satellites (FY) (Parinussa et al., 2014; Song and Jia, 2016), Advanced Microwave Scanning Radiometer 2(AMSR2) (Parinussa et al., 2015), and Soil Moisture Active Passive(SMAP)(Entekhabi et al.,2010;Reichle et al.,2016).
Several satellite platforms among the satellites listed above are currently in operation and provide routine soil moisture estimates across global land surfaces, including SMOS, Fengyun Satellites 3B (FY3B) and 3C (FY3C), AMSR2, and SMAP.However,the revisit rates of these satellites are usually two to three days. Therefore, none of these satellites can provide full coverage of China over one day. For example, all of the five satellites have observation gaps on June 1, 2016(Fig. 1). The sensors onboard these satellites and their corresponding retrieval algorithms also differ from one another.Jointly using these operating satellites to derive daily composite soil moisture is meaningful and useful to enhancing the coverage and accuracy of retrieved soil moisture.
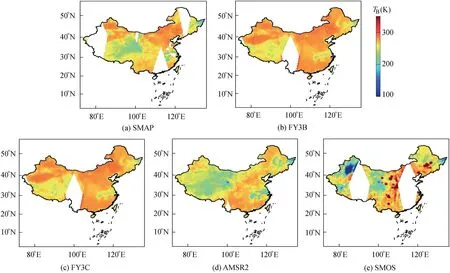
Fig. 1. Maps of brightness temperatures in China on June 1, 2016 measured by SMAP, FY3B, FY3C, AMSR2, and SMOS satellite passive microwave sensors.
A few studies have examined the use of multiple microwave bands or the brightness temperature observations of multiple satellites to retrieve soil moisture. Njoku and Li(1999) pioneered a study using satellite microwave radiometer data from multiple bands of AMSR to retrieve soil moisture. Recently, Piles et al. (2016) used the triangle inversion technique to enhance soil moisture retrieval through synergies of SMOS microwave observations and Spinning Enhanced Visible and InfraRed Imager (SEVIRI) optical and infrared data onboard the Meteosat Second Generation(MSG)satellite. Liu et al. (2012) developed a method to combine passive and active microwave products to improve the estimation of soil moisture.Similarly,Rodríguez-Fern′andez et al.(2015) and Kolassa et al. (2016) adopted artificial neural network methods to combine observations from active and passive satellite microwaves to retrieve soil moisture. Aires et al. (2012) compared synergistic multi-wavelength remote sensing to a posteriori combination of retrieved products.Kolassa et al. (2017) further investigated the assimilation of soil moisture retrieved from active and passive satellites into a land surface model.Several studies were conducted to produce long-term soil moisture records using observations from multiple satellite platforms, including the European Space Agency (ESA) Climate Change Initiative (CCI) project(Dorigo et al.,2015;Enenkel et al.,2016), a long-term record of global soil moisture from SMOS, AMSR-E, and AMSR2(Yao et al., 2017), and a record based on the SMOS and AMSR-E merged data (Van der Schalie et al., 2018). These studies have demonstrated the effectiveness of synergistically using observations from multiple satellites or multiple sensors to improve the retrieval of soil moisture or produce a longer record. However, studies on the joint use of multiple microwave satellites to retrieve soil moisture in a near real-time environment are still rare.
Unlike previous studies,we aimed to enhance the accuracy and coverage of satellite soil moisture based on a classic brightness radiometric algorithm by jointly using brightness temperature observations from the mainstream operating passive microwave satellite platforms, namely SMAP, SMOS,AMSR2,FY3B,and FY3C.The objective of this study was to develop a simple, reliable, and effective method to directly retrieve land surface soil moisture from the SMAP, SMOS,AMSR2, FY3B, and FY3C observations to produce a daily composite soil moisture product across China for potentially near real-time application.
2. Materials and methods
2.1. Data
In this study, brightness temperature (TB) data in halforbits, both ascending and descending orbits, from SMAP,FY3B, FY3C, AMSR2, and SMOS (Fig. 1), the normalized difference vegetation index (NDVI), and daily soil temperatures of top two soil layers (0-10 cm and 10-20 cm) were used to retrieve soil moisture. We chose China as our study region.Considering the data availability and spatial resolution of these TBdata, we chose 2012 to 2016 as the study period and 0.25°× 0.25°(about 25 km × 25 km) as the spatial resolution of the final retrieved soil moisture (Table 1). To ensure the quality of the TBdata, we followed the filtering procedure of previous studies (Rodríguez-Fern′andez et al.,2015, 2016) to screen the data based on the quality flags associated with each of these datasets. Grid cells with a cumulative probability of the presence of radio frequency interference (RFI) higher than 20% or with a TBlower than 50 K or higher than 400 K were filtered out. All half-orbit,both ascending and descending, TBdata were first projected and resampled to the 0.25°× 0.25°grid before being used to retrieve soil moisture. We used all available TBdata of the same day to derive soil moisture and average the retrieved soil moisture data to produce daily composite values. Considering that the accuracy of soil moisture retrieval can be affected by frozen conditions,we filtered the data during the frozen period for any further analysis.
Other data used as auxiliary data included land cover, soil texture, precipitation, and potential evapotranspiration (PET)data. All gridded data were re-projected or resampled to the 0.25°× 0.25°grid used in this study. Additionally, we downloaded the official daily soil moisture products of the five satellites to compare with our product. To make these official products comparable with our daily composite data,data from each single-satellite product were first re-projected to the 0.25°×0.25°grid and separately averaged to produce a daily composite if the released soil moisture data were in halforbits.
Details of the data sets described above are provided below.
2.1.1. Brightness temperature data
The SMAP TBdata used in this study were the 1.41 GHz TBdata in half-orbits from the SMAP Level 1C Brightness Temperature product with a composite release ID of R14010.The data were downloaded from the National Aeronautics and Space Administration (NASA) Distributed Active Archive Center at National Snow and Ice Data Center (https://nsidc.org/data/smap). The SMAP TBdata were measured by a radiometer operating at the L-band (1.41 GHz) with a fixed incidence angle of 40°.
The SMOS TBdata used in this study were the SMOS Level 1C Brightness Temperature Version 6.2.0 product and were obtained from the European Space Agency (ESA) SMOS Online Dissemination Service (https://smos-ds-02.eo.esa.int).The SMOS TBwas measured by an interferometric radiometer operating at the L-band (1.413 GHz) with multiple incidence angles.
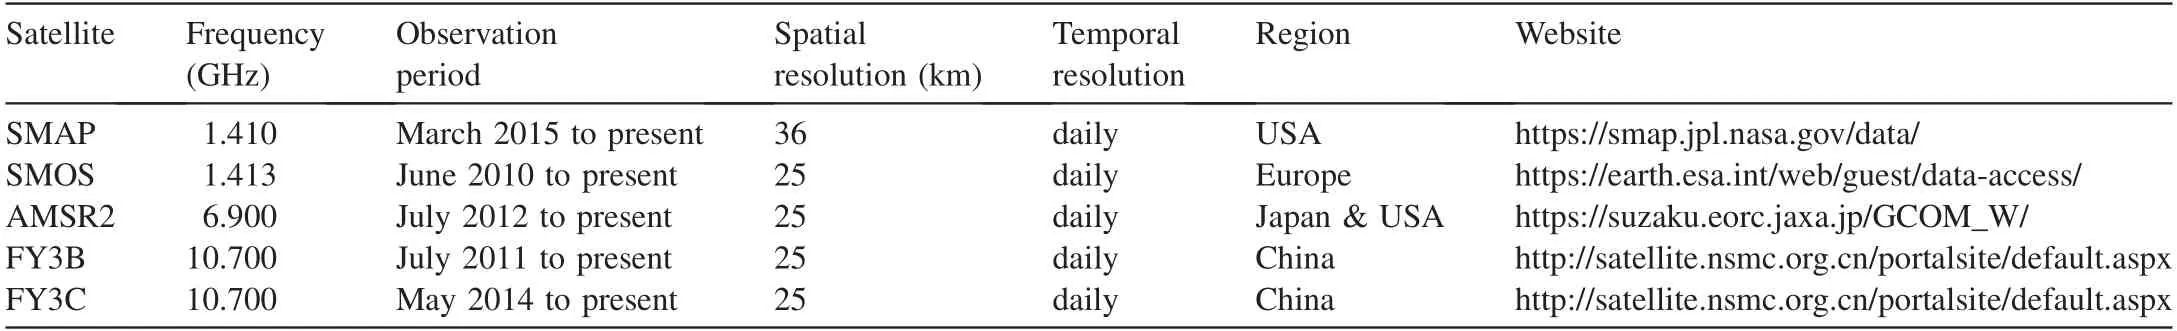
Table 1Basic information about TB data of five satellite products used in this study.
The AMSR2 TBdata used in this study were the AMSR2 L1R Brightness Temperature Version 2.2 product and were measured by the AMSR2 onboard the GCOM-W1 satellite.The data were downloaded from the Japan Aerospace Exploration Agency (JAXA) Global Change Observation Mission (GCOM) W1 Data Providing Service (https://gcomw1.jaxa.jp/).
The FY3B TBdata in half-orbits used in this study were 10.7 GHz TBdata from the FY3B Level 1 Ascend and Descend Brightness Temperature Version 1.0 product and provided by the Fengyun Satellite Data Center(http://satellite.nsmc.org.cn). The FY3B TBdata were measured by a Microwave Radiation Imager (MWRI) onboard the FY3B satellite.
The FY3C TBdata in half-orbits used in this study were 10.7 GHz TBdata from the FY3C Level 1 Ascend and Descend Brightness Temperature Version 1.0 product and provided by the Fengyun Satellite Data Center(http://satellite.nsmc.org.cn). These TBdata were measured by a MWRI onboard the FY3C satellite.
2.1.2. Satellite soil moisture data
The daily SMAP soil moisture data were the SMAP Level 3 Passive Soil Moisture product with a composite release ID of R14010 and were retrieved by the baseline Single Channel Algorithm V-pol algorithm (Chan et al., 2016). The daily SMAP soil moisture data were gridded data with a spatial resolution of approximately 36 km. The SMOS soil moisture data used in this study were the SMOS Level 2 Soil Moisture Version 6 product and were retrieved from the multangular inversion of the L-band microwave emission of the biosphere(L-MEB) model (Kerr et al., 2012). The SMOS soil moisture data were swath-based data with a spatial resolution of 25 km.The AMSR2 soil moisture data used in this study were the 25-km AMSR2 SWC Version 2 product and were retrieved from the radiative transfer model of the soil-vegetation layer(Koike, 2013). The FY3B soil moisture data were the FY3B Level 2 Volumetric Soil Moisture Version 1 product with a spatial resolution of approximately 25 km. The FY3B volumetric soil moisture data were retrieved using the 10.7 GHz FY3B TBbased on the Qp model(Shi et al.,2006).The FY3C volumetric soil moisture data used in this study were the FY3C Level 2 Volumetric Soil Moisture Version 1 product.The same FY3B soil moisture retrieval algorithm was used to produce the FY3C soil moisture product.
2.1.3. Auxiliary data
The other supporting data included NDVI, soil temperature, land cover, soil texture, and precipitation. The NDVI data were from the Moderature Resolution Imaging Spectroradiometer (MODIS) Vegetation Indices 16-day Level 3 Global 1 km Version 6 product (https://e4ftl01.cr.usgs.gov/MOLT/MOD13A2.006/). The 16-day NDVI data were then interpolated to daily values using linear interpolation and aggregated to 0.25°as an input of the soil moisture retrieval model.The soil temperatures of the top two layers(0-10 cm and 10-20 cm) from the Goddard Earth Observing System Model, Version 5 (GEOS-5) were used in this study and derived from the Global Modeling and Assimilation Office(GMAO) (https://gmao.gsfc.nasa.gov/GEOS/). Land cover data were from the 500-m MODIS-IGBP Version 6 global land cover classification (Friedl et al., 2010), while soil texture data were from the Food and Agriculture Organization (FAO) of the United Nations Harmonized World Soil Database v1.2 (Fischer et al., 2008).
We also downloaded the observed monthly precipitation data from 1982 to 2015 at 756 stations provided by the China Meteorological Administration (CMA). We interpolated the site-level data into gridded data using the inverse distance weighting method and averaged the monthly gridded data to a multi-year mean.Daily PET data for China from 1982 to 2015 were derived from a global daily PET product that was estimated using the NCEP2 reanalysis meteorology data and satellite-observed radiation data based on the Penman-Monteith method (Zhang et al., 2015). The daily PET data were averaged to multi-year average PET data. The precipitation and PET data were used to calculate an aridity index for delineating the hydroclimatic zones in China.
2.1.4. In situ soil moisture observations
The observations used for product evaluation were obtained from two soil moisture monitoring networks on the Tibetan Plateau and in Anhui Province as references (Fig. 2(a)). The network in the Tibetan Plateau is called the Central Tibetan Plateau Soil Moisture/Temperature Monitoring Network(CTP-SMTMN) (Yang et al., 2013), and was established in 2010 for scientific research and data validation. This network covers a region of 100 km × 100 km with a total of 56 sites(Fig. 2(b)). At each site, soil moisture was measured by four sensors placed at depths of 0-5,10,20,and 40 cm.Data were recorded every 30 min and represented the average value over the previous half hour (Yang et al., 2013). Only the 0-5 cm data in CTP-SMTMN were used for comparison. The Central Tibetan Plateau has an average altitude of over 4000 m. This region is influenced by a monsoon season(June to September)and its rainfall has pronounced seasonal dynamics.The annual precipitation varies between 400 and 500 mm, mainly concentrated in the monsoon season. Soil has a frozen season from November to May.
The observation network of soil moisture in Anhui Province is composed of 85 automatic soil moisture stations,distributed across 71 counties in the province (Fig. 2(c)). The DZN2 (GStar-I) automatic soil moisture monitors, jointly developed by the Henan Institute of Meteorological Sciences and No. 22 Institute of China Electronic Technology Group Corporation, were deployed in the network. The monitors measure soil water content by measuring the relative dielectric constant of the soil.The measured data include the volumetric water content of soil at depths of 10,20,30,40,50,60,80,and 100 cm. The data at the depth of 10 cm in the Anhui observation network were used for validation in this study. Anhui Province (114°54′E to 119°37′E, 29°41′N to 34°38′N) lies in East China and covers an area of 1.4 × 10⁵km2. It is a transitional zone between the warm temperate zone north of the Huaihe River and subtropical zone south of the Huaihe River. Annual mean temperature varies from 14°C to 16°C,whereas annual mean rainfall falls between 800 and 1600 mm(Li et al., 2017). More than half of the area in the north is cultivated land, whereas most of the south is forest.

Fig. 2. Locations of two validation areas and spatial distributions of observation stations in this study (0.25° grid cells in Tibetan Plateau are numbered from T1 to T10, while 1° grid cells in Anhui Province are marked from A1 to A10).
Since soil moisture varies greatly from one point to another,directly comparing station-level observations to the gridded soil moisture product that represents an areal mean is inappropriate. Station density in the CTP-SMTMN network is 5.6 stations per 1000 km2, whereas station density in Anhui Province is 0.6 stations per 1000 km2. Therefore, we gridded the station-level observations in the CTP-SMTMN network to the 0.25°soil moisture retrieval grid to make the observed and retrieved values comparable (Fig. 2(b)). Station values within each grid cell were averaged to produce the areal mean value.Only these 0.25°grid cells containing three or more stations were selected for comparing the observations with their corresponding retrieved soil moisture.Since the station density of Anhui Province is much lower than that of the CTP-SMTMN network, we gridded the station-level observations in Anhui Province to a 1°grid instead of the 0.25°grid and produced the grid-cell average values. The 0.25°retrieved values were correspondingly aggregated to 1°soil moisture using area as the weight. Only these 1°grid cells containing six or more stations were selected for comparison (Fig. 2(c)). As a result,the comparison was conducted at ten grid cells in the Tibetan Plateau (Fig. 2(b)) and ten grid cells in Anhui Province(Fig. 2(c)).
2.2. Retrieval algorithm
In this study, we used the single channel brightness algorithm based on the classical tau-omega model(Jackson,1993),in which TBis converted to emissivity (ep) using the physical temperature of the emitting layer (Tp):

In this study,TBwas first corrected for the presence of open water within the radiometer footprint by viewing the radiometer-observed TBas an areal weighted sum of the TBcontributed from the water and from the land. By following the SMAP Level 3 passive retrieval algorithm (O'Neill et al.,2015) and Choudhury et al. (1982), Tpwas computed using the soil temperatures of the top two layers (0-10 cm and 10-20 cm) from the GMAO GEOS-5 products. Since epis impacted by any overlapping vegetation and surface roughness above the soil surface,the soil surface emissivity(esurf)can be solved as a function of ep,the single scattering albedo(ω),and the one-way transmissivity of the canopy (γ) based on the study of Jackson and Schmugge (1991):

Both ω and γ are dependent on the vegetation structure,polarization,and frequency.γ is a function of the optical depth of the vegetation canopy (τ) and the incidence angle (θ):

By following Jackson and Schmugge(1991),τ is estimated using vegetation water content (V):

where b is a parameter that depends on both the vegetation structure and microwave frequency. According to the SMAP Level 3 passive retrieval algorithm(O'Neill et al.,2015),V can be calculated as a function of the NDVI.
The soil surface emissivity is the value determined from the vegetation correction and still contains the effects of surface roughness.Therefore,the smooth surface soil emissivity(esoil)required for the Fresnel equation inversion was further derived based on a model described by Choudhury et al. (1979):

where h is a surface roughness parameter depending on the polarization, frequency, and geometric properties of the soil surface. In this study, only horizontally polarized brightness temperatures were used to derive soil moisture due to their sensitivity to soil moisture. The dielectric constant of soil is linked to emissivity according to the Fresnel equations for the horizontal polarization:
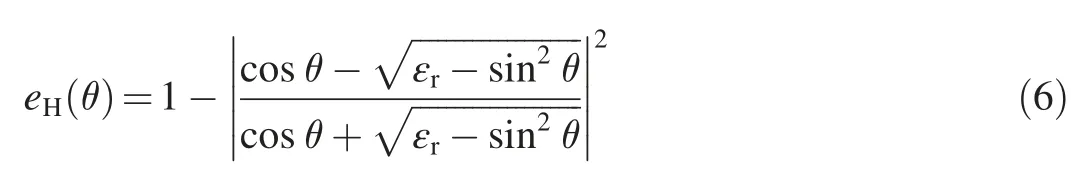
where eHis the horizontally polarized surface soil emissivity,and εris the real component of the dielectric properties of the soil.To simplify the computational inversion,it is assumed that εrprovides a good approximation of the complex dielectric constant. Finally, the mineralogy-based soil dielectric model(MBSDM) (Mironov et al., 2009) was used to relate the estimated dielectric constant to the amount of soil moisture.To calculate volumetric soil water content with the method described above, key model parameters (b, h, and ω), which depend on the vegetation structure and microwave frequency,must be provided as biome-specific and wavelength-dependent constants. Following the previous studies (Choudhury et al.,1979; Jackson and Schmugge, 1991; O'Neill et al., 2015;Ulaby et al., 1981), we developed a parameter look-up table stratified by biome type and microwave frequency (Table 2).
We applied the algorithm above to retrieve soil moisture from TBmeasured by five satellites, including SMAP, SMOS,AMSR2, FY3B, and FY3C. The derived soil moisture data from the same day were then averaged to produce a composite daily soil moisture product.
2.3. Performance evaluation
To evaluate the accuracy of our retrieved product, we compared our product, the official SMAP, SMOS, AMSR2,FY3B, and FY3C soil moisture products, and the ensemble mean of the five satellite products with ground observations.Three statistical metrics were used to measure the quality of these products,including mean bias(BIAS),root mean square error (RMSE), and the correlation coefficient between the retrieved data and the observations (R).BIAS is defined as the difference between the mean of the retrieved data and the mean of the observations.
3. Results and discussion
3.1. Grid cell-level validation of retrieved soil moisture
To evaluate the performance of our retrieved soil moisture data, we compared them with the observations and the ensemble (arithmetic) mean of the five existing satellite products,i.e., the official SMAP, SMOS, AMSR2,FY3B, and FY3C soil moisture products. Fig. 3(a) through (d) show thedaily soil moisture of the three data sets from 2012 to 2014 in four representative grid cells of Central Tibet(T1,T2,T4,and T9).Overall,both our retrieved soil moisture and the ensemble mean of the five satellite products were able to capture the soil moisture dynamics of the four grid cells (Fig. 3(a) through(d)). Comparing to the observations, the R values of our product in the four grid cells were similar to those of the ensemble mean product. All R values were equal to or higher than 0.70, indicating that both our product and the ensemble mean product were able to capture the seasonality and interannual variability of soil moisture in Central Tibet. Furthermore, the RMSE values of the two products were within 0.14 m3/m3and the difference between the RMSE values of the two products was less than 0.04 m3/m3(Fig.3(a)through(d)).However, the RMSE values of the retrieved soil moisture product in this study were generally lower than those of the ensemble mean product, suggesting that the data produced in this study have higher accuracy than the ensemble mean product in Central Tibet.In terms of bias,both of the products overestimated soil moisture in Central Tibet with a similar level of overestimation in this region. In terms of the seasonality,both products tended to overestimate soil moisture in summer, which is the season with higher values (Fig. 3(a)through (d)). The relatively large biases in the summer may reflect the limitation of these satellite retrieval algorithms including the single channel brightness algorithm in the specific period in this region. Further improvement on these algorithms is needed.However,it is clear that the data set of this study more closely matches the observations than the ensemble mean product (Fig. 3(a) through (d)).
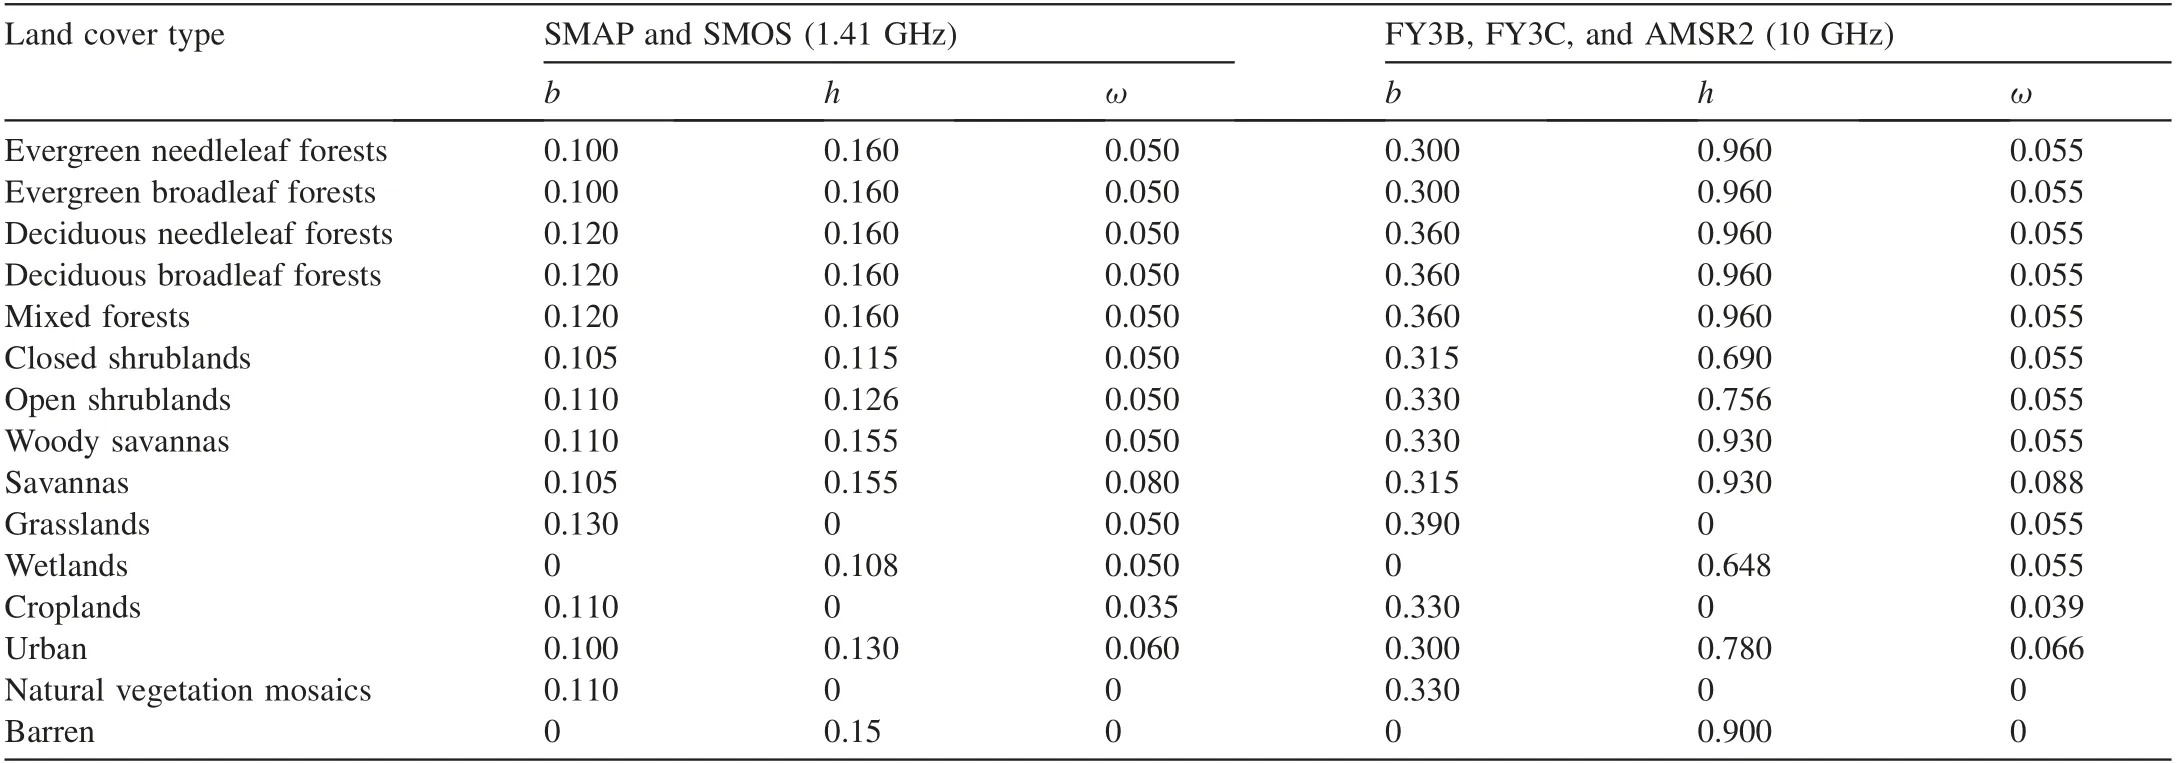
Table 2Look-up table of key biome-specific and wavelength-dependent algorithm parameters.

Fig. 3. Time series of daily measured and retrieved multi-satellite surface soil moisture (m3/m3) for representative validation grid cells with largest sample sizes (locations of these grid cells are marked in Fig. 2).
In Anhui Province, we were only able to compare the three data sets from 2014 due to the limited data availability.Fig. 3(e) through (h) show the daily courses of the three soil moisture sets. Overall, our product and the ensemble mean product had lower quality in Anhui Province than in Central Tibet(Fig.4).However,our derived soil moisture was clearly much better than the ensemble mean product (Fig. 3(e)through and (h)). Firstly, our derived soil moisture showed more agreement with the observations in terms of the higher correlation coefficients than the ensemble mean product(Fig. 3(e), (f), and (h)). The correlation coefficient between our derived soil moisture and the observations ranged from 0.50 to 0.70, whereas the correlation coefficient between the ensemble mean product and the observations varied between 0.29 and 0.52 (Fig. 3(e) through (h)). Secondly, the RMSE values of the ensemble mean product were also larger than those of our retrieval product. The RMSE values of our product were all less than 0.14 m3/m3, but those of the ensemble mean product were between 0.25 and 0.33 m3/m3(Fig.3(e)through(h)).Finally,both products underestimated soil moisture in the grid cells of Anhui Province to some extent, but the biases of our product, ranging between -0.13 and -0.08 m3/m3, were much smaller than those of the ensemble mean product, which ranged between -0.33 and-0.23 m3/m3(Fig. 3(e) through (h)).
We further quantified the performance of our product and the ensemble mean product for all grid cells with sufficient ground observations, as shown in Fig. 2. As a result, Fig. 4 summarizes the spread of the three statistical metrics for the two products. As shown in Fig. 4(a), both products tended to underestimate the soil moisture, but our product had smaller biases,with a mean value of-0.05 m3/m3and a narrower bias spread than the ensemble mean product, which had a mean value of-0.10 m3/m3. These results indicate that our product is more precise than the ensemble mean product. In terms of RMSE, our product had much smaller values and a narrower spread than the ensemble mean product(Fig.4(b)).The RMSE value of our product ranged between 0.06 and 0.22 m3/m3,whereas the RMSE value of the ensemble mean product varied from 0.09 to 0.37 m3/m3(Fig.4(b)).These results suggest that our product performs better and is more accurate than the ensemble mean product. Finally, our product also was generally highly correlated with the observations across the validation grid cells compared with the ensemble mean product(Fig. 4(c)). The R value for our product varied from 0.36 to 0.75, whereas these values for the ensemble mean product were between 0.21 and 0.74 (Fig. 4(c)). In summary, our product has better values for all three metrics compared with the ensemble mean product, suggesting that our product performs better than the ensemble mean product.
To further illustrate the effectiveness of our product and its improvement on the retrieval of soil moisture relative to the five existing satellite products, we evaluated the qualities of the five existing satellite products and compared the qualities with that of our product through a Taylor diagram.The Taylor diagram in Fig. 5 measures the degree of correspondence between the modeled (retrieved) and observed soil moisture across the grid cells of our validation areas in terms of three statistics: the correlation coefficient, the centered root-meansquare difference (centered RMS difference), and the standard deviation. In Fig. 5, the observed data are the reference.In terms of the correlation coefficient and centered RMS difference, our product (the red point in Fig. 5) was better than any of the five existing products (SMAP, SMOS, AMSR2,FY3B, and FY3C). In terms of standard deviation, the SMAP product(the pink point in Fig.5)had a variability that was the closest to that of the observations. However, the SMAP product had a very low correlation with the observations(< 0.15). Our product was the second closest to the observations in terms of internal variability (Fig. 5). In addition, the ensemble mean of the five products was more highly correlated with the observations than any of its ensemble members.The ensemble mean had a centered RMS difference that was lower than those of the AMSR2 and FY3C products and comparative to those of the FY3B and SMOS products.
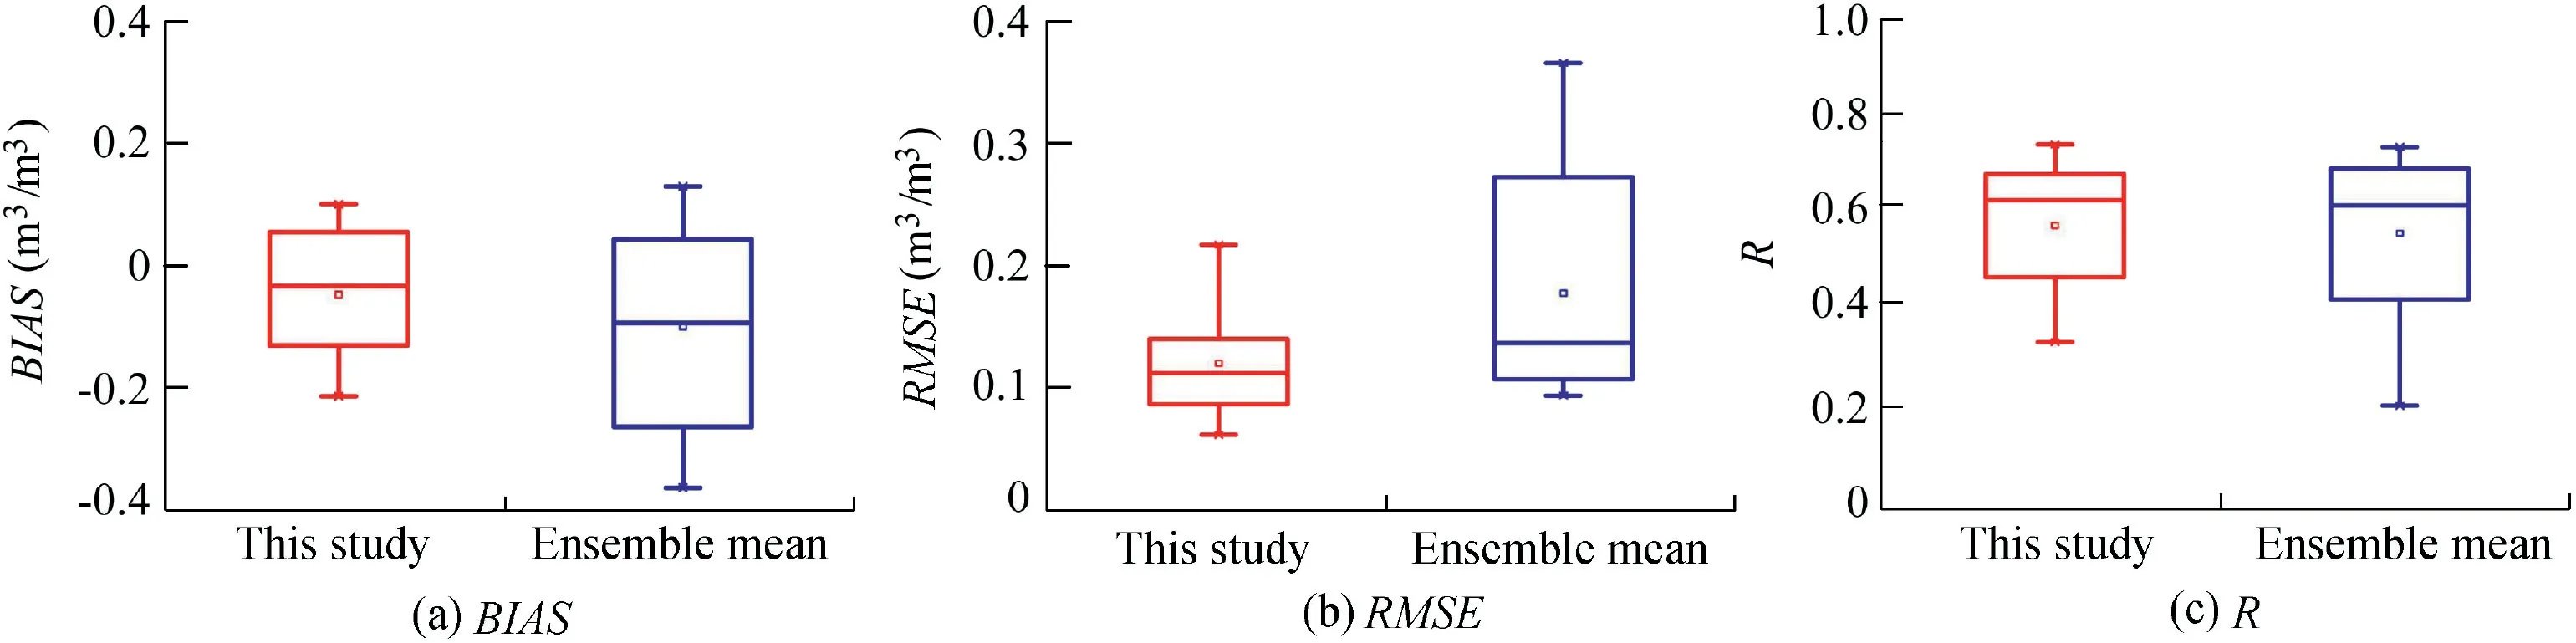
Fig. 4. Box plots of statistical metrics for daily retrieved multi-satellite surface soil moisture (m3/m3) of 20 validation grid cells.
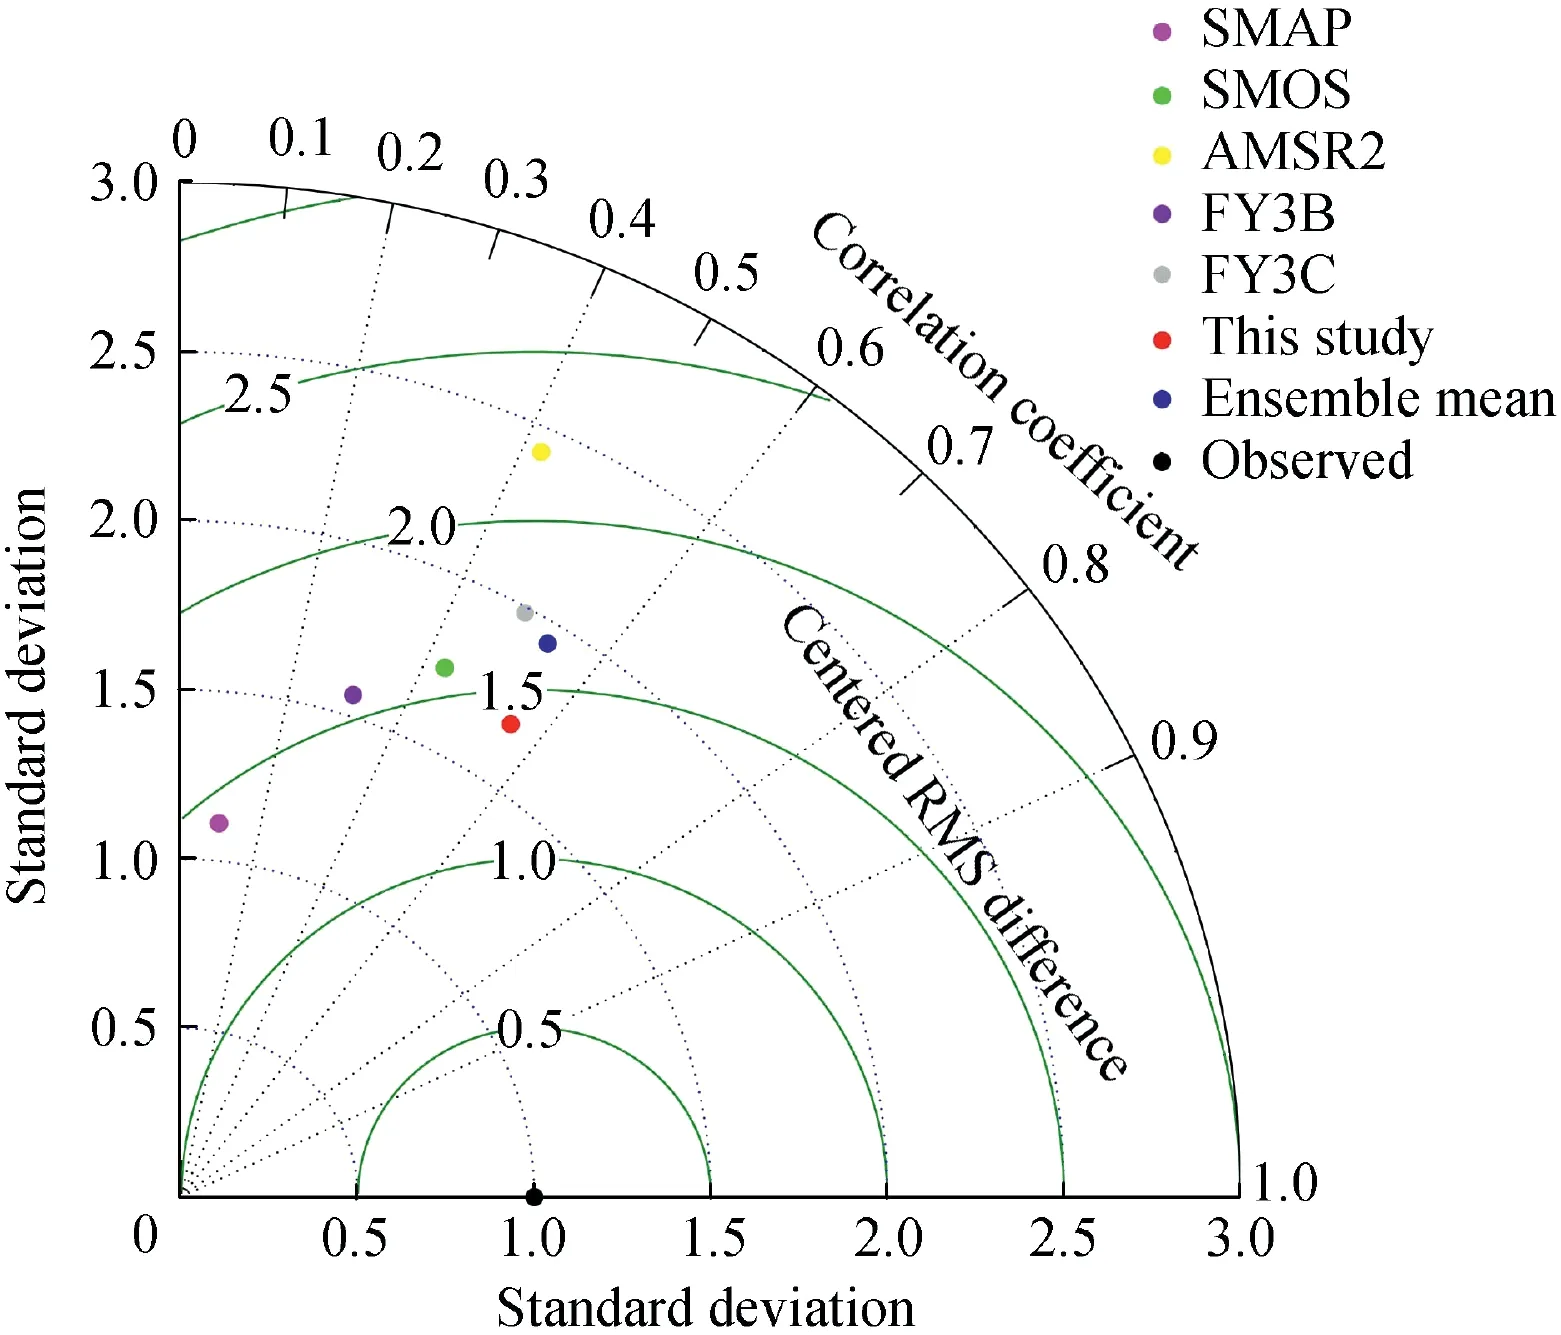
Fig. 5. Taylor diagram of multi-satellite retrieved soil moisture,SMAP soil moisture, SMOS soil moisture, AMSR2 soil moisture,FY3B soil moisture, FY3C soil moisture,and ensemble mean of five existing satellite products based on comparison with observationbased values of all grid cells in Central Tibet and Anhui Province.
3.2. Regional cell-level validation of retrieved soil moisture
Since the number and distribution of stations within the grid cells can limit the representativeness of the point-level observations on the grid-cell averages, we aggregated all station observations within each of the two validation areas to produce regional-level observation-based values. We then compared the values with the regional means of our product and the ensemble mean product.
Table 3 shows the results of the regional-level validation.The biases of our product and the satellite ensemble mean product were both less than 0.03 m3/m3in Central Tibet,although the ensemble mean product had a slightly smaller bias (Table 3). The bias of our product in Anhui was-0.08 m3/m3, which is much better than the bias of the ensemble mean product (-0.26 m3/m3) (Table 3). The RMSE values of our product were 0.06 and 0.09 m3/m3in Central Tibet and Anhui, respectively (Table 3). Correspondingly, the values obtained using the ensemble mean product were 0.09 and 0.26 m3/m3in Central Tibet and Anhui, respectively(Table 3). Clearly, our product had lower RMSE values than the ensemble mean product at the regional level, indicating that our product is more accurate. These results are consistent with the grid cell-level validation described above.Relative to the ensemble mean of the five existing satellite products, our product improves the accuracy of retrieved soil moisture by 9.1% and 57.7% in Central Tibet and Anhui Province,respectively. In other words, the difference in the retrieval algorithms of these satellite products may introduce additional uncertainty. This confirms that averaging the soil moisture products retrieved from different satellites using the same retrieval algorithm to produce an ensemble mean can improve the data quality. These results indicate that the single-channel brightness radiometric algorithm is effective and valuable for retrieving soil moisture from different satellite platforms.
Furthermore,the R values of our product and the ensemble mean were both 0.78 in Central Tibet. In Anhui Province, the R value of our product was 0.32,whereas that of the ensemble mean product was 0.27(Table 3).The results from the regional cell-level validation above confirm that our product is overall a better dataset than the ensemble mean in the two validation regions according to the three statistical metrics. There are several advantages of jointly using multiple satellites to retrieve daily composite soil moisture. Firstly, it can improve the spatial coverage of the observations.As different satellites have different orbits and viewing angles, combining observations from all available satellites makes it possible to cover a larger area. Secondly, it can also enhance the accuracy of retrieved soil moisture because more satellites potentially provide more observations at a given location within one day.
The results above show that both our product and the existing satellite products show better performance statistics in Central Tibet than in Anhui Province (Fig. 3 and Table 3). A few explanations are possible for the differential performance of these products in the two regions. First, the density of the measurement stations is sparser in Anhui than in Central Tibet.Only 85 stations are distributed within a 5°× 6°area in Anhui,but 56 stations are located within the 100 km×100 km Central Tibet network. Second, Anhui is situated in the transition zone between China's northern and southern climate regions. According to topography, Anhui is divided into the Huaibei plain,Jianghuai hilly region,and southern mountains.Anhui is also a more developed region, with a larger population, more agricultural activities, and much greaterurbanization than Central Tibet. There are more diverse climates, terrain conditions, and human activities in this region than in Central Tibet, which may lead to complicated spatial distribution of soil moisture in Anhui. In contrast, Tibet is an ideal place to retrieve soil moisture due to low biomass, low air mass and air moisture, and rare radio frequency interference in this region(Yang et al.,2013;Zeng et al.,2015;Zhao et al., 2014). The retrieval algorithm also needs further improvement in regions like Anhui. In particular, ways of better accounting for the impacts of dense vegetation and human impacts on soil moisture retrieval need to be further studied. It is also important to synergistically use the active microwave remote sensing data and/or optical remote sensing data along with passive remote sensing data to further improve the spatial resolution and accuracy.

Table 3BIAS,RMSE,and R statistics of retrieved multi-satellite surface soil moisture in this study and ensemble mean of existing satellite products in two validation areas.
There are several uncertainties in generating the gridded observation-based soil moisture in the two validation areas.As we know, soil moisture varies widely in space. Many factors,including land cover, geographical and geomorphological factors,and human impacts can contribute to the variability of soil moisture. Averaging the observations from the stations within a grid cell is a simple and effective method. However,the arithmetic average method has some limitations. Its effectiveness largely depends on the level of station distribution evenness and the level of heterogeneity of land surface characteristics. A more sophisticated geostatistical method,such as the Kriging method and Co-Kriging method, may produce a better areal mean. According to our analysis, the station density in the two validation areas is still very limited.Further evaluation of these satellite products in China requires further available ground observations.More and denser ground observations are needed to validate the satellite-based products and understand the spatial distribution of soil moisture.
3.3. Spatial variability of soil moisture across China

Fig. 6. Maps of multi-year (2012-2016) mean daily soil moisture retrieved in this study.
Finally, we analyzed the spatiotemporal variability of the derived land surface soil moisture data across China using our derived soil moisture data set from 2012 to 2016.Fig.6 shows the spatial pattern of multi-year (2012-2016) mean daily soil moisture across China. A spatial gradient is clearly visible in the spatial map. Land surface soil moisture and wetness gradually increased from the northwestern inland regions to northeastern and southeastern China (Fig. 6). The deserts and Gobi Desert in Xinjiang Uygur Autonomous Region, northwestern Inner Mongolia, and Gansu show extremely low soil moisture, whereas Yunnan, the middle-lower Yangtze Plain,Southeast China, and Hainan have relatively high values(Fig. 6). The soil moisture reaches the highest value, about 0.46 m3/m3, in an area of Hainan Island (Fig. 6).
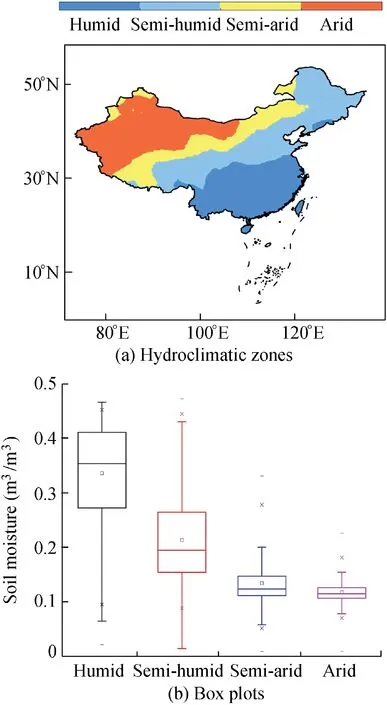
Fig. 7. Spatial distributions of hydroclimatic zones and box plots of multi-year mean daily retrieved soil moisture of different hydroclimatic zones.
To further investigate the impact of climatic conditions on the spatial pattern of soil moisture across China, we determined the distribution of hydroclimatic zones across China based on the multi-year mean aridity index (A) and precipitation (P). A is defined as the ratio of P to the value of PET.The P and PET data used to derive A are described in Section 2.1.3.The hydroclimatic zones across China are divided into the humid (A ≤1.0; P ≥800 mm), semi-humid (1.0 < A ≤1.5; 400 mm ≤P < 800 mm), semi-arid (1.5 < A ≤4.0;200 mm ≤P < 400 mm), and arid zones (A > 4.0; P <200 mm) (Fig. 7(a)). As shown in Fig. 7(a), the distribution of climatic zones in China has a clear spatial pattern. The arid regions, including Xinjiang, western Inner Mongolia,and western Qinghai-Tibet Plateau, are mainly located in northwestern China,whereas the humid regions are mainly in the southern and southeastern parts of China and a small portion of northeastern China (Fig. 7(a)). The semi-humid and semi-arid areas are located between the humid and the arid regions (Fig. 7(a)). The multi-year mean daily retrieved soil moisture for different climate zones was also computed,as shown in Fig.7(b).The spatial distribution of soil moisture is highly correlated with the distribution of climatic zones(Figs. 6 and 8). Regional average soil moisture decreases from the humid regions to the arid regions. The mean values of soil moisture in the humid, semi-humid, semi-arid, and arid zones were 0.336, 0.214, 0.134, and 0.118 m3/m3,respectively(Fig.7(b)).In terms of the spatial variability,the humid zone had the largest spatial variability in soil moisture, followed by the semi-humid and semi-arid zones,whereas the arid region varied the least spatially (Fig. 7(b)).We concluded from the results above that the spatial distribution of surface soil moisture in China generally increases from northwest to northeast and to southeast.
3.4. Seasonality of soil moisture in China
Based on the retrieved multi-year (2012-2016) soil moisture data set, we further investigated the seasonality of soil moisture across China.Soil moisture in most regions of China demonstrates apparent seasonal changes, although different regions show different seasonalities (Fig. 8). Blank areas represent the surface frozen conditions and most of the frozen conditions appear in winter and in northeastern China, northwestern China, and the Tibetan Plateau (Fig. 8(d)). In northeastern China,the highest value is in summer,and the value of spring is similar to the value of autumn(Fig.8).In most parts of the southern and eastern regions,soil moisture seems to be comparable in spring, autumn, and winter, but it substantially increases in summer(Fig.8).This is mainly due to the humid conditions caused by the summer monsoons in these regions.In contrast, soil moisture in the western and northwestern regions varies relatively little between seasons (Fig. 8).
4. Conclusions
In summary, we applied the classical single-channel brightness radiometric algorithm to retrieve daily composite land surface soil moisture by jointly using the SMAP, SMOS,AMSR2, FY3B, and FY3C microwave observations. This approach is simple but effective and can be implemented for near real-time soil moisture retrieval to enhance the utility of microwave satellite observations for a wide range of potential applications, such as hydrological modeling, flood hazard forecasting, and agricultural management. The retrieved soil moisture product was further evaluated against ground observations from two observation networks in China, which were also compared with the five existing satellite products and their ensemble mean. Our results demonstrate that our retrieved product outperforms the existing five satellite products and their ensemble mean in both the validation areas in China in terms of the three performance statistical metrics.These findings support our initial expectation of the enhancement of soil moisture retrieval by using concurrent observations of multiple microwave satellites. Jointly using brightness temperature observations from multiple satellites to retrieve soil moisture did not only improve the spatial coverage of daily observations but also increased the sample size to produce better daily composite products. Our results also prove that retrieving soil moisture from microwave observations of multiple satellites using the same single-channel brightness model can achieve better results than the arithmetic average of the existing soil moisture products from the five satellites.
In the future, it will be valuable to apply other retrieval algorithms such as the artificial neural network method to produce an ensemble product from different satellites and compare the ensemble mean product with the product generated in this study.Further studies on the impacts of uncertainty in surface terrain and environmental information on the retrieval should be conducted.In addition,spatial downscaling of the retrieved soil moisture should be further investigated to help achieve soil moisture data with finer spatial resolution.Data merging of satellite-retrieved soil moisture data and measurements from the ground observation network will be valuable for producing improved data.
 Water Science and Engineering2019年2期
- Water Science and Engineering的其它文章
- Impacts of rainfall and catchment characteristics on bioretention cell performance
- Numerical simulation of wind-driven circulation and pollutant transport in Taihu Lake based on a quadtree grid
- Correlations between silt density index, turbidity and oxidation-reduction potential parameters in seawater reverse osmosis desalination
- Submerged flexible vegetation impact on open channel flow velocity distribution: An analytical modelling study on drag and friction
- River bank protection from ship-induced waves and river flow
- Possibilities and challenges of expanding dimensions of waterway downstream of Three Gorges Dam