
Correlations between silt density index, turbidity and oxidation-reduction potential parameters in seawater reverse osmosis desalination
2019-07-24 07:34SeyedMohmmdHosseinFyzRoyMfigholmiFtemehRzvinKrimGhsemipnh
Water Science and Engineering 2019年2期
Seyed Mohmmd Hossein Fyz , Roy Mfigholmi ,*, Ftemeh Rzvin ,Krim Ghsemipnh
a Department of Environment, West Tehran Branch, Islamic Azad University, Tehran 1949663311, Iran
b Department of Environment, Parand Branch, Islamic Azad University, Parand 3761396361, Iran
c Research Institute of Petroleum Industry, Tehran 1485733111, Iran
Abstract The reverse osmosis method is one of the most widely used methods of seawater desalination at present. Hydrophilic and desalting membranes in reverse osmosis systems are highly susceptible to the input pollutants. Various contaminants, including suspended organic and inorganic matter,result in membrane fouling and membrane degradation.Fundamental parameters such as the turbidity,the amount of chlorine injection, and silt density index (SDI) are the most predominant parameters of fouling control in the membranes. In this study, the operation system included a water intake unit,a pretreatment system,and an RO system.The pretreatment system encompassed a clarifier,a gravity sand filter,pressurized sand filters,and a cartridge filter.The correlation between the amount of chlorine injection in terms of the oxidation-reduction potential (ORP) and the SDI value of the input water was investigated at a specified site next to the Persian Gulf. The results showed that, at certain intervals of inlet turbidity, injection of a certain amount of chlorine into the raw water has a distinct effect on the decrease of SDI.
Keywords: Silt density index; Oxidation-reduction potential; Turbidity; Reverse osmosis; Membrane fouling
1. Introduction
At present, population growth, increasing water consumption, dwindling water resources, global warming, and limited access to high-quality water in many regions are major concerns that require special attention with the development of desalination technologies and use of abundant seawater(Wenten and Khoiruddin,2016).Reverse osmosis(RO)is one of the most important seawater desalination processes (Choi et al., 2016; Sun et al., 2015). Of all the desalination technologies,RO contributes to 60%of global production capacity(www.climatetechwiki.org).
Entry of pollutants into RO systems results in serious damage to the RO membranes. Suspended inorganic and organic matter in raw water leads to increases in the pressure difference, conductivity of produced water, consumption of chemical matter,and energy consumption,and a shortening of the membrane lifetime as a result of membrane fouling(Alhadidi et al., 2011a). Thus, precise monitoring of these systems at regular periods is required due to the high cost of supplying the membranes (Wenten and Khoiruddin, 2016). In fact, all the aforementioned factors cause high investment costs,operation costs,and equipment repair costs(Jiang et al.,2017).
Surface water resources contain large amounts of suspended organic and biological pollutants, in addition to suspended inorganic pollutants. The entry of pollutants from raw water into the desalination systems and the disposal methods of these pollutants directly correlate to the appropriate pretreatment systems and chemical injections related to the types of contamination. The pollutants are basically categorized into four kinds as follows (Alhadidi et al., 2011b;Landaburu-Aguirre et al., 2016; Sim et al., 2017): (1) pollutants of soluble mineral in input water;(2)pollutants related to suspended input matter; (3) organic pollutants in input water;and (4) biological pollutants. Each kind of pollutant results in serious damage to the membranes of an RO system.Hence,the characterization of these pollutants as well as effective measures to remove them is important.
The water salinity of the Persian Gulf is much higher than that of other seas, and the total dissolved solids (TDS)concentration in some regions exceeds 45 g/L. In addition,more types of pollutants, including suspended organic and biological pollutants, bio-deposits, barnacles, and inorganic pollutants enter the RO system in the Persian Gulf than do so in other seas. Red tide attacks are the most intense attacks in this region (Nezlin et al., 2010; Sun et al., 2015).
The deposition of pollutants in the pretreatment system strongly affects the operation of desalination systems. The organic and inorganic pollutants; biological deposits and barnacles; and green, red, and blue-red tides cause biological growth and deposition in water intake systems, pumping stations, pretreatment units, RO membranes, and their water passages. The increase in pollutant concentrations leads to a consequent increase in pressure difference, a shape change of the membranes, and a decrease in RO permeate flow. Additionally, the increase in pollutant concentrations results in the decrease of the discharged salt concentration in water, which leads to water quality deterioration.
Special or multi-stage pretreatment systems as well as indirect intakes from the sea should be used (Sarai Atab et al., 2016). Most RO plants have pretreatment filtration or disinfection systems. The two most common methods used are disinfection using UV lamps and chlorination to protect against pathogens because of their capacity to inactivate most pathogenic microorganisms (Winward et al., 2008). The efficacy of chlorine injection is dependent on the pH of the water, chlorine concentration, and time of exposure(Wimalawansa, 2013). In this study, the removal of organic contaminants was investigated through the disinfection pretreatment method using calcium hypochlorite. The relationships between turbidity, silt density index (SDI), and the residual chlorine, measured in oxidation-reduction potential(ORP), were examined. The SDI is the most important parameter characterizing the amount of inlet pollutants flowing into the membrane of the RO desalination system(Alhadidi et al., 2011b). Few studies have investigated the correlation between these parameters. Mosset et al. (2008)studied the relationship between turbidity and SDI and showed that an increase in the turbidity may not directly be represented in the SDI value. There are very few studies regarding the relationship between SDI and chlorine injection. Thus, the aim of this study was to evaluate the relationships between these fundamental parameters in order to optimize the operation of the systems.
2. Materials and experimental procedure
2.1. Chemical solutions
2.1.1. Calcium hypochlorite solution
Calcium hypochlorite was used as a disinfectant to inactivate pathogenic microorganisms. Calcium hypochlorite that is 65%chlorine(hypochlorite)by weight is normally dissolved in water to form a solution of 3 mg/L.This solution was injected daily into the inlet raw water using a tank and dosing pumps.The amount of injection depended on the amount of organic and biological pollutants in raw water and the SDI value.
2.1.2. Poly aluminum chloride
Poly aluminum chloride (PAC) in powder form (with a purity of 90%) was used for the purpose of coagulation to enhance particulate. A 5 mg/L solution was injected into the raw water according to the results of a jar test.
2.1.3. Polyacrylamide group
An aid-coagulant solution (2 mg/L) of the polyacrylamide group (an organic polymer with a density of 0.95-1.1 g/cm3)with a trade name of Ulteraclear (RSCO27232) was injected into the raw water based on the optimal conditions in the jar test.
2.2. Determination of control parameters
2.2.1. Turbidity
Inlet turbidity is a measure of the total amount of inlet suspended colloidal particles in the unit.The turbidity level of the raw water was measured with an Aqualytic AL250T-IR turbidity meter using the nephelometric light method.
2.2.2. Silt density index
SDI is a parameter for assessing the fouling propensity in the RO system. This measurement is based on the time required to filter a volume of the feed water through a 0.45-μm filter at a constant pressure of 20.86 kPa (Sim et al., 2017;ASTM, 2014a). In fact, SDI is the drop per minute in permeate flux through the filter, averaged over a period of time.The maximum SDI value to predict the fouling capacity is less than 5,and its optimum value is less than 3(Weia et al.,2012; Mitrouli et al., 2008). The SDI value for a 100-mL sample during a period of 15 min, S15min, was measured with an Aqualytic SDI meter using the following formula:
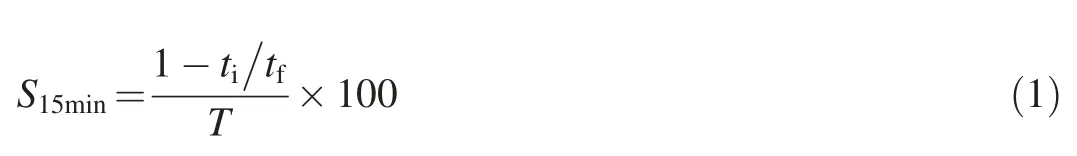
where tiis the initial time in seconds required to fill the 100-mL sample for the first time, tfis the final time in seconds required to fill the 100-mL sample for a second time after 15 min, and T is the time of 15 min for the exit flow between the first and second sampling times.
2.2.3. Oxidation-reduction potential
The oxidation-reduction potential is a measure of the degree of oxidation/reduction of materials. The ORP value in this study indicates the amount of injected or residual chlorine during the usual reaction period (ASTM, 2014b).The amount of injected chlorine was measured by an online ORP meter(JUMO brand) every 2 h (in mV). The amount of residual chlorine in mg/L was measured by an MD200 Lovibond photometer using the spectrophotometric method with the dimethyl-4-phenylenediamine (DPD) specification.
In order to determine the severity of organic pollution of the input water, investigation of parameters including biological oxygen demand (BOD) and chemical oxygen demand(COD) was performed four times by a wastewater treatment company using the standard test method (ASTM, 2012). The correlations between SDI, turbidity, and ORP were studied.NTU was used as the unit of turbidity and the ORP was used as the equivalent voltage value of injected chlorine.
2.3. Description of operation process
The operation system included a water intake unit, a pretreatment system,and an RO system.The pretreatment system included a clarifier, a gravity sand filter, pressurized sand filters,and a cartridge filter.Firstly,chemical solutions including chlorine disinfectant and coagulants were injected into the water. Then, water entered the clarifier to remove suspended particles and reduce turbidity. The turbidity reduction efficiency in the clarifier was higher than 80%. To efficiently eliminate the causal factors of turbidity and RO pollutants,the water entered the gravity sand filter at a surface rate of 8 m/h.And a turbidity value of less than 1 NTU can be reached when the water passed through the pressurized sand filters of dualmedia filtration (DMF 1 and DMF 2 in Fig. 1). The filtration rate in these sand filters was more than 17 m/h. Afterwards,water entered the cartridge filter to control the SDI value.Therefore,the SDI value was dependent on the performance of the pretreatment system and chemical injection amount. The RO unit production capacity was 2000 m3/d and there were 154 Filmtec seawater membranes.A schematic diagram of the process is shown in Fig. 1.
3. Results and discussion
3.1. Analysis of raw water inlet
Typical water quality measurements were taken at 34.5°C and a pH value of 7.75.The COD value(27 mg/L)was always greater than the BOD value (19 mg/L). The results demonstrated that the high values of BOD and COD in raw water were due to the presence of organic and biological pollutants.The turbidity was 35 NTU.
3.2. Correlation between control indices
Variations of seawater turbidity and SDI were investigated for 60 samples (Fig. 2). For each sample the ORP value was kept constant at 470 mV and turbidity varies from 140 NTU to 42 NTU.For each sample the SDI value was recorded to study the variations of SDI and turbidity level.

Fig. 1. Schematic diagram of studied process.
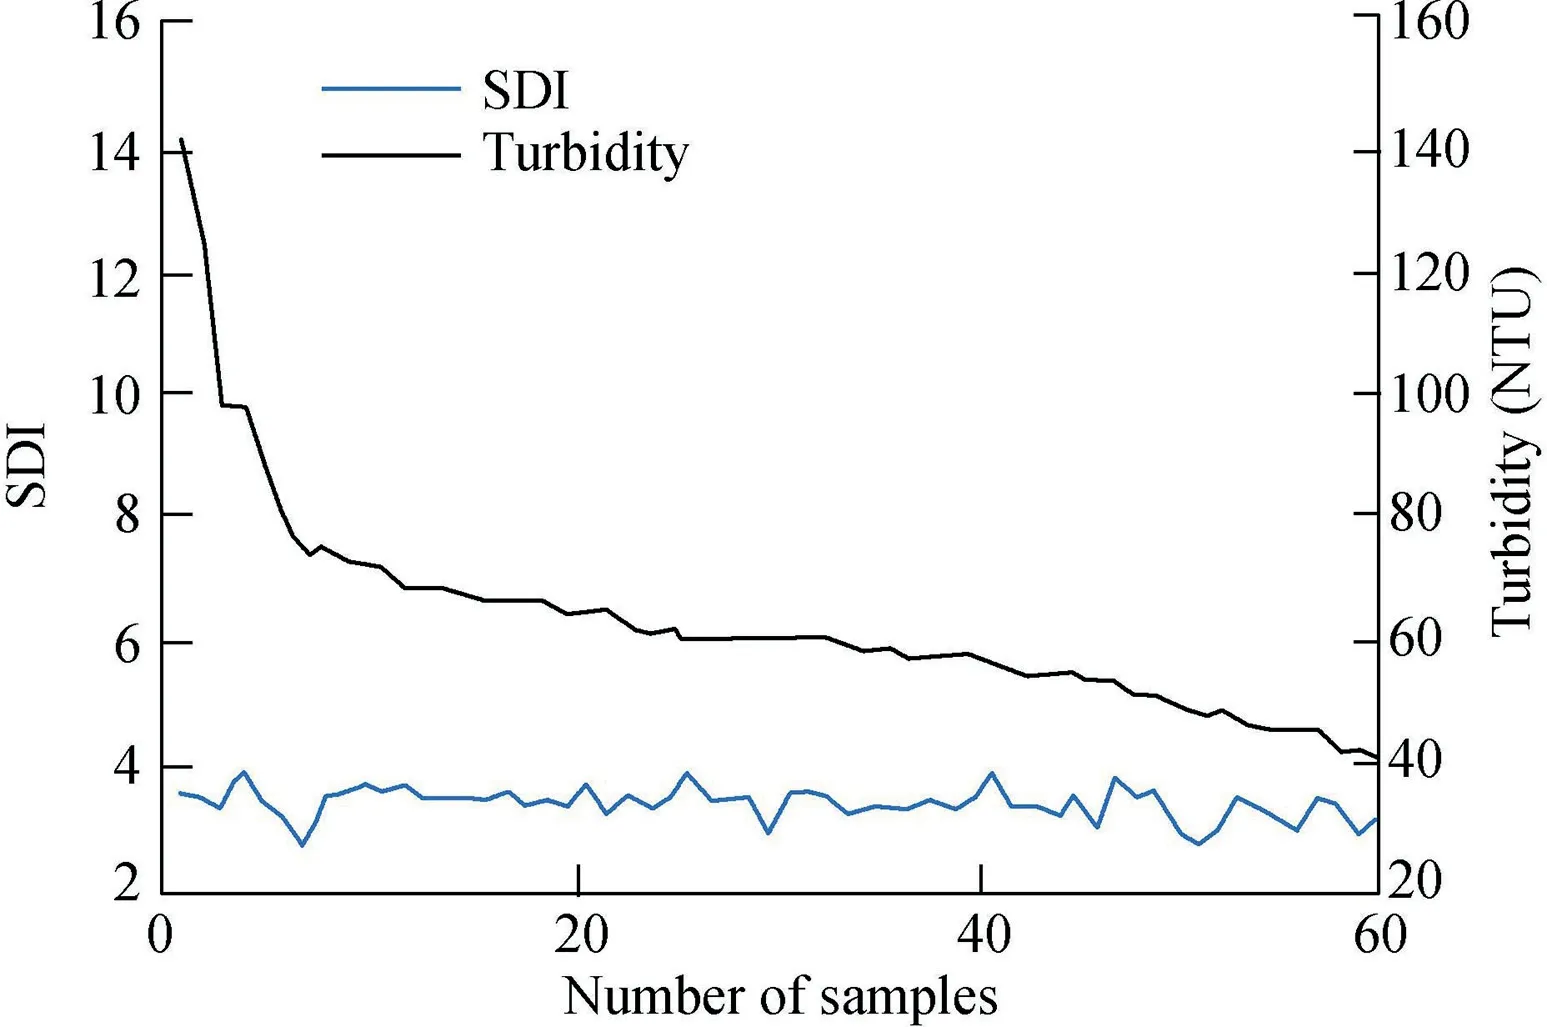
Fig. 2. Variations of turbidity and SDI value at constant value of chlorine injection.
A reduction in turbidity values can be seen from Fig. 2,while the SDI value changed insignificantly.It was found that besides suspended organic matter,suspended inorganic matter played an integral role in determining SDI values.In addition,the pollutant concentration and particle size can be among the predominant reasons for this phenomenon. According to the pretreatment system, the turbidity of water after passing through the pressurized sand filters reached less than 1 NTU due to the removal of suspended colloids.However,submicron particles of organic and biological pollutants still remained suspended in raw water, determining the SDI values. Similar studies showed that an increase in the turbidity may not be directly represented in SDI values and SDI measurements can be affected by many parameters, including particle size,pollutant concentration, temperature, pH, and membrane wetting, despite low turbidity (Rachman et al., 2013; Mosset et al., 2008).
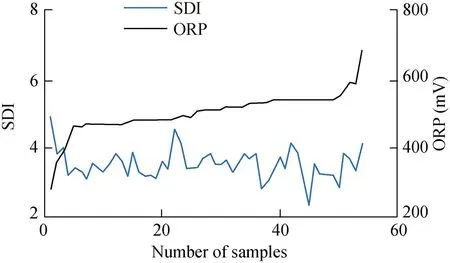
Fig. 3 shows the variation trends of ORP and SDI values under operational conditions without considering turbidity.When SDI values increased, ORP increased due to the chlorine injection. The SDI values value after a long injection time became less than that at the start of chlorine injection. As the SDI value should not be larger than 3, the operator, by observing the rising value of SDI, was able to increase the value of ORP by increasing the amount of injected chlorine.
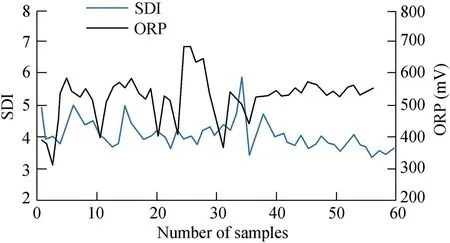
Fig. 3.Variations of ORP and SDI values under operation conditions without considering turbidity.
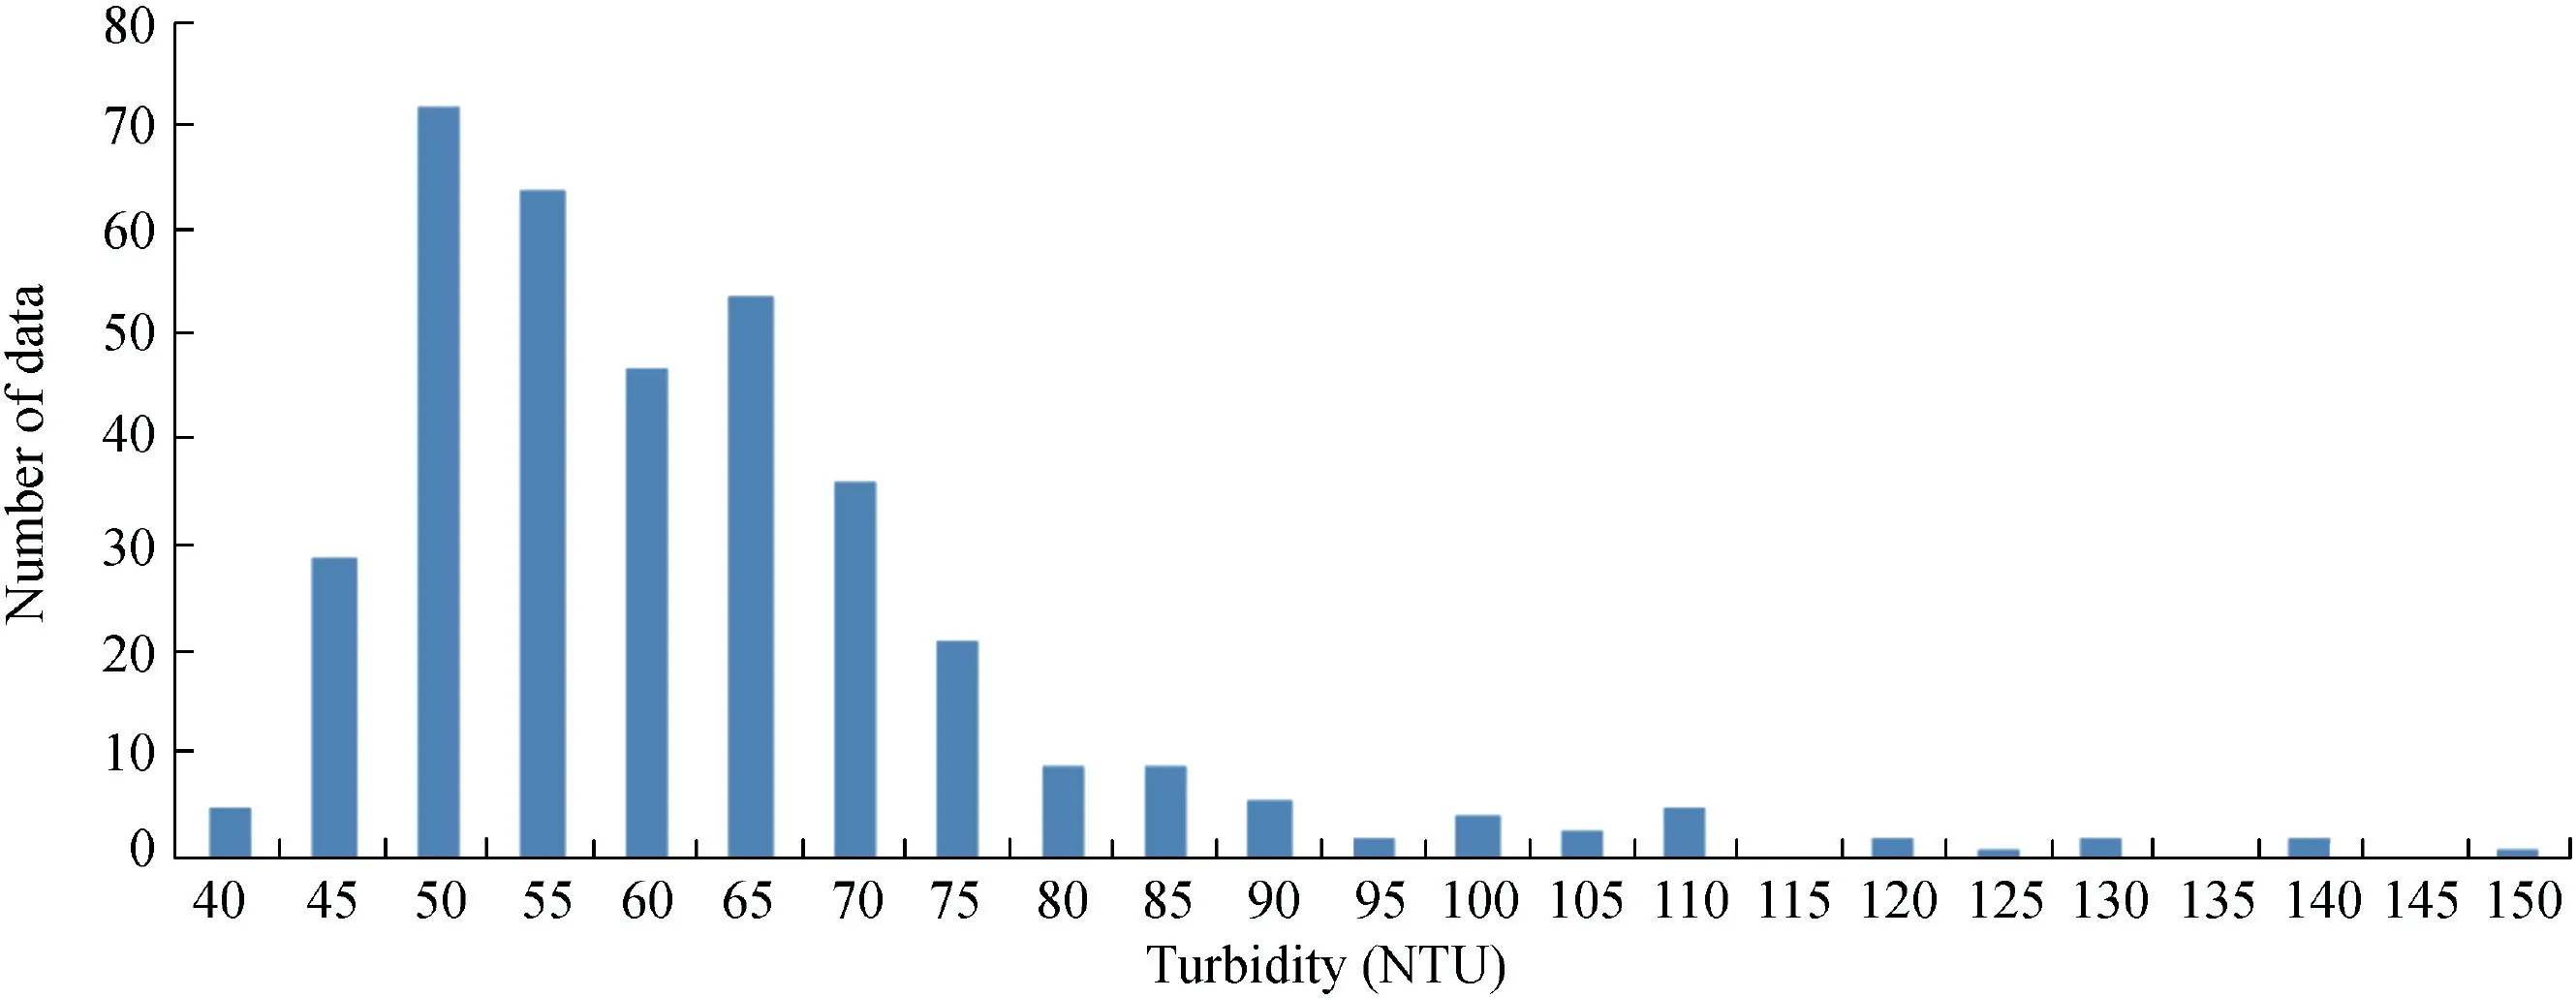
Fig. 4 shows the number of data points for each value of turbidity. In each range of turbidity data, the turbidity value was kept constant and the relationships between the ORP value and the SDI value were investigated. In this way, the effect of chlorine injections on the removal of suspended organic and biological particles and SDI value could be directly determined.
Fig. 5 shows the variations of SDI and ORP values at certain turbidity intervals. ORP measurements present the concentration of chlorine oxidants and their trend relating to the degree of oxidation/reduction. As the amount of chlorine oxidants increase, living microorganisms and bacterial abundance are significantly diminished(Simon et al.,2014).In this regard, reducing the amount of submicron particles in water changes the SDI value. The marked fluctuation of SDI values accompanied by a rise in the ORP values can be seen,which is due to the contributions of suspended organic and inorganic matter to turbidity, operational conditions, and measurement errors. This means that at a constant turbidity level, the variation of SDI after a long injection time is less than the variation of chlorine injected by a small amount.
According to the results, the following equations are obtained:
For 35 NTU For 55 NTU For 80 NTU where y is the SDI value; x1and x2are the turbidity and ORP values, respectively; and N is the number of samples. The regression values are 0.982,0.990,and 0.993 for Eqs.(2),(3),and (4), respectively. By adjusting the turbidity values in specific ranges of 35-55, 55-80, and 80-150 and ORP in the ranges of 280-680 mV, 315-616 mV, and 420-630 mV, favorable SDI values of inlet water were obtained. Chlorine disinfection injection has a distinct effect on the SDI value of raw water in the RO unit due to the suspended organic and biological matter that are the main sources of pollution.In the unit under testing with a surface water source,mineral suspended colloidal particles were removed by the clarifier in the pretreatment system. The raw water feeding from the desalination site is taken directly from surface water.The main conclusions are as follows: (1) Complete removal of water turbidity does not necessarily result in the complete elimination of the causal factors of high SDI values. (2) The chlorine injection to units with a surface water source has an effect on the biological causal factors of SDI and reduces the SDI value from inlet to the RO. The correlations obtained for exploitation of RO production systems with the same pretreatment systems and superficial raw water source will contribute to optimizing the operation of desalination units. (3) By adjusting the turbidity and ORP values in specific ranges, favorable SDI values of inlet water were obtained. Fig. 4. Scattering data of turbidity. Fig.5.Variations of SDI and ORP values at a constant turbidity value.


4. Conclusions
 Water Science and Engineering2019年2期