
A feature selection method combined with ridge regression and recursive feature elimination in quantitative analysis of laser induced breakdown spectroscopy
2020-07-09 07:45GuodongWANG王国栋LanxiangSUN孙兰香WeiWANG汪为TongCHEN陈彤MeitingGUO郭美亭andPengZHANG张鹏
Plasma Science and Technology 2020年7期
Guodong WANG (王国栋),Lanxiang SUN (孙兰香),Wei WANG (汪为),Tong CHEN (陈彤),Meiting GUO (郭美亭) and Peng ZHANG (张鹏)
1 State Key Laboratory of Robotics,Shenyang Institute of Automation,Chinese Academy of Sciences,Shenyang 110016,People’s Republic of China
2 Key Laboratory of Networked Control Systems,Chinese Academy of Sciences,Shenyang 110016,People’s Republic of China
3 Institutes for Robotics and Intelligent Manufacturing,Chinese Academy of Sciences,Shenyang 110169,People’s Republic of China
4 University of Chinese Academy of Sciences,Beijing 100049,People’s Republic of China
5 Author to whom any correspondence should be addressed.
Abstract
Keywords:laser-induced breakdown spectroscopy,feature selection,ridge regression,recursive feature elimination,quantitative analysis
1.Introduction
The laser-induced breakdown spectroscopy (LIBS)technique generates a transient plasma by utilizing a focusing lens focusing the laser beams on the sample surface to realize the ablation excitation of the measured sample,then qualitative and quantitative analysis of the element components of tested sample could be conducted by the collection and analysis of plasma emission spectrum.The LIBS technique has been widely used in chemical element analysis,as it has many advantages such as full-element,in situ,on-line,quick and without sample preparation[1,2].However,most of samples contain complex element information,which makes the univariate method usually be unreliable as the determination of analytical element is easily affected by other elements[3].By contrast,the multivariable analysis method can make full use of the information of spectroscopy to obtain a better analysis[4,5],but too much feature data as model inputs will significantly increase the model complexity and easily lead to over-fitting.Hence,it is important to carry out the feature selection of high dimension spectral data to reduce the dimension of the input data [6,7].
According to the manner of feature subset generation,feature selection can be divided into three pattern including filter,wrapper and embedding [8,9].Bella et al [10]conducted the characteristic selection of the spectral data by exploiting the method of analysis of variance,using the most useful features to fast identify the parchment.Larsson et al[11]used the median of the standard deviation of the peak intensity to set the intensity threshold so that removing the redundant spectrum for biological sample classification.These filter feature selection methods can screen a single characteristic line by calculating a certain statistical index for spectrum feature selection,and eventually receive spectrum futures with a huge number of similar properties.
Considering the influence of the overall spectral characteristic line of feature subset on fitting result,the wrapper manner firstly uses intelligent optimization algorithm such as genetic algorithm (GA) and particle swarm optimization algorithm(PSO)to produce a feature subset,and then applies the ultimate fitting model to evaluate the feature subset,and the optimal feature subset could be found according to the module fitting result.Kong et al [12]utilized the GA to generate a feature subset,and for five elements including Mn,Ni,Cr,Si and Fe in the low alloy steel,they proved that the spectrum selection manner using GA in combination with internal calibration method can receive the best consequence for internal calibration analysis.Yan et al [13]applied V-WSP filter feature selection manner to remove regardless and redundancy feature in advance,then exploit PSO algorithm to generate feature subsets,and then the feature selection way of V-WSP-PSO selected 114 dimension features from the 27 620 dimension features,effectively reducing input dimension.The wrapper method evaluates the feature subset by the fitting result of the ultimate fitting model,whose final fitting result generally preceded the manner of filter which evaluates the individual spectral lines [14].However,this will bring out the problem of over-fitting,when we apply the final fitting model to evaluate the subset.Besides,the random search algorithm for subset selection is generally time-consuming because of the large searching space of subsets.
The embedding method utilizes the model whose loss function with L1 or L2 regular penalty term to implement concentration fitting,and estimates the importance of every feature according to the model fitting coefficients.The absolute value of the coefficients of unimportant features is usually zero or close to zero during the fitting procedure.Shen et al [15]obtained spectrum data from traditional Chinese medicine ‘SanQi’,and compared three multivariable regression model that are Lasso,LS-SVM,and PLS,with the full spectrum characteristic lines and characteristic lines selected by Lasso as model inputs.Their result indicates that the performance of the LS-SVM as regression model is superior to that of other model when the spectrum feature selection is carried out through Lasso,for the five elements of K,Ca,Mg,Zn,and B.Compared with the wrapper method,the embedding feature selection method conducts model training only for one time,so that the whole process deucedly depends on the model fitting result.
This paper presents a wrapped feature selection method combining ridge regression and recursive feature elimination(Ridge-RFE).To overcome the problem of over-fitting and too large feature subset search space of the wrapped method,this method takes advantage of the ridge regression [16,17]for feature selection,which can not only relieve the overfitting produced by too much spectrum feature,but also process the multicollinearity problem [18,19]which is common in spectrum data treatment.During a round of subset selection procedure,we can eliminate the feature with the minimum absolute value of the coefficient in the regression equation by recursive feature elimination(RFE)[20],and use residual features as inputs of PLS model for cross validation.By repeating the above steps until all features are deleted,we can finally find the optimal feature subset according to the root mean square error of cross-validation (RMSECV).
2.Experimental
2.1.Instrument
The experimental device is a portable LIBS analyzer developed by the Shenyang Institute of Automation,Chinese Academy of Sciences.The excitation light source is YLP-C-20 fiber laser from China Jiepu,the maximum power is 20 W,the single pulse energy is 0.8 mJ,the pulse width is 200 ns,and the excitation frequency is 25 kHz.The laser source was focused on the surface of the sample through a 40 mm focal lens.The spectral signal which is a 1×4094 dimensional vector was collected using the AvaSpec-Mini spectrometer from Avantes B.V.of the Netherlands,and the wavelength range of the spectrometer is 215–394 nm.
2.2.Sample and spectral data
In this experiment,fifty-one standard aluminum alloy samples,including 5 samples made by the Benxi Alloy Plant of China Nonferrous Metals Industry Corporation,and 11 samples made by Shenyang Fushun Aluminum Plant Standard Sample Research Institute,and the remaining samples made by the Southwest Aluminum Co.,Ltd.Smelting plant,were used for the analysis.The concentrations of major elements,Mg,Si,Mn,Fe,Cu,and Zn are shown in table 1.LIBSport has a line scan function that scans 22 points in per measurement.There is no time resolution in the spectrumacquisition,each spectrum is the cumulative spectrum of 6 life cycles of the plasma,and the average spectrum of 22 spectra is taken as the spectrum obtained in one measurement.In order to reduce the uncertainty in the line intensities,each sample is measured at 10 different positions,and the average of 10 spectra is taken as the spectral data of each sample.The final spectral data is 51×4094.In order to obtain normalized spectral data normalization with the whole spectrum area[21]is applied.For analysis,we selected 6 random samples for validation and the rest of those were as a calibration set.In order to reduce the influence of different characteristic line dimensions on the calibration results,a standardized method was used for calibration set and validation set.The specific standardization process is as follows:
whereXis the original data;uis the mean of the calibration original data;σis the standard deviation of the calibration original data; 'Xis the standardized data.
2.3.Evaluation method
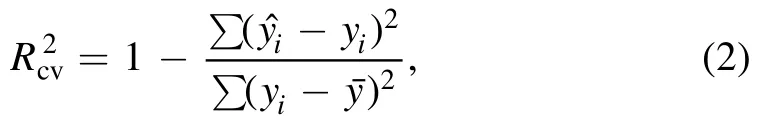
The determination coefficients of cross-validation (),the RMSECV and the root mean square error of prediction(RMSEP) were used to assess the performance of the calibration and prediction qualities of the model.The following equation was used to calculate:
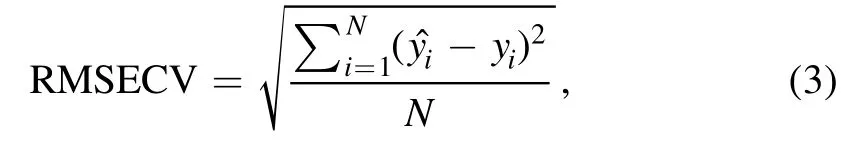
whereNis the number of calibration samples.RMSEP is defined as in equation (4):
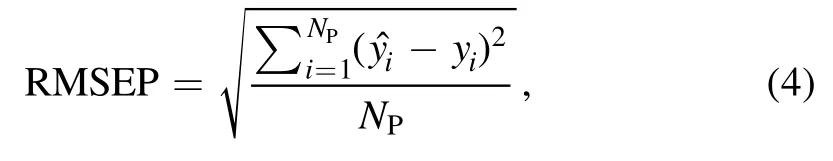
whereNpis the number of validation samples.
3.Algorithm structure
3.1.Ridge regression
For multivariate linear regression,the principle formula is as follows:

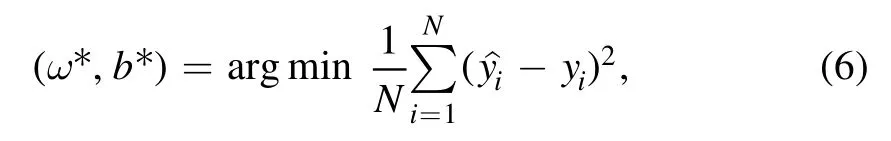
where,the solutions ofωandbareω* andb* respectively,andyirepresents the true value.The input matrix of independent variablexiisX,and the actual output valueyiconstitutes a vectory.The solution of regression equation is usually obtained by the following formula:

where,XTrepresents the transposed matrix ofX.However,in spectral data,there is multicollinearity between characteristic lines of the same element,then the matrixX XT is a singular matrix,which makes the accurate regression analysis can not be obtained by the ordinary least square method.At this point,data dimensionality reduction or regularization is needed to solve the problem.Ridge regression was first proposed by Hoerl [18]to solve the problem of multicollinearity among independent variables,and the standard deviation of parameters obtained by ridge regression was relatively small.The ridge regression is to introduce the diagonal matrix ofrIin equation (7) when calculating the solution of parameterω,that is,to introduce the L2 regular term into the loss function
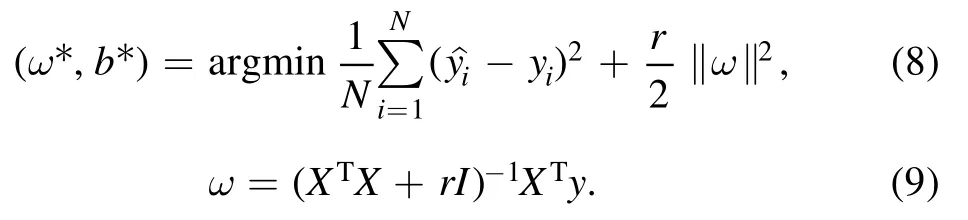
In equations (8) and (9),r>0,which makesXTX+rImuch less strange thanX X.T The introduction of L2 regular term in loss function can alleviate the over-fitting problem to some extent.
3.2.Feature selection based on ridge regression
RFE is a kind of wrapped[22]feature selection method.This method uses a base model for multi-round training.After each round of training,several features of weight coefficients are removed,and the next round of training is based on a new feature subset.The RFE method recursively reduces the size of feature subsets by sequential backward selection.At the earliest time,RFE was used for feature selection to solve classification problems.In this paper,the ridge regression is used as the basic model of RFE to solve the quantitative problem.The ridge regression model is used to fit the calibration set data,and the regression coefficients are recorded.The spectral features are sorted according to the absolute value of the regression coefficients.The lowest ranking spectral feature is deleted from the feature set in each cycle.In order to evaluate the features,residual features are used as inputs of PLS model for validation and RMSECV is recorded,until the features are all deleted.Finally,the optimal feature subset is determined according to the minimal RMSECV recorded in each iteration.The algorithm flow is shown in figure 1.
4.Results and discussion
4.1.PLS calibration results
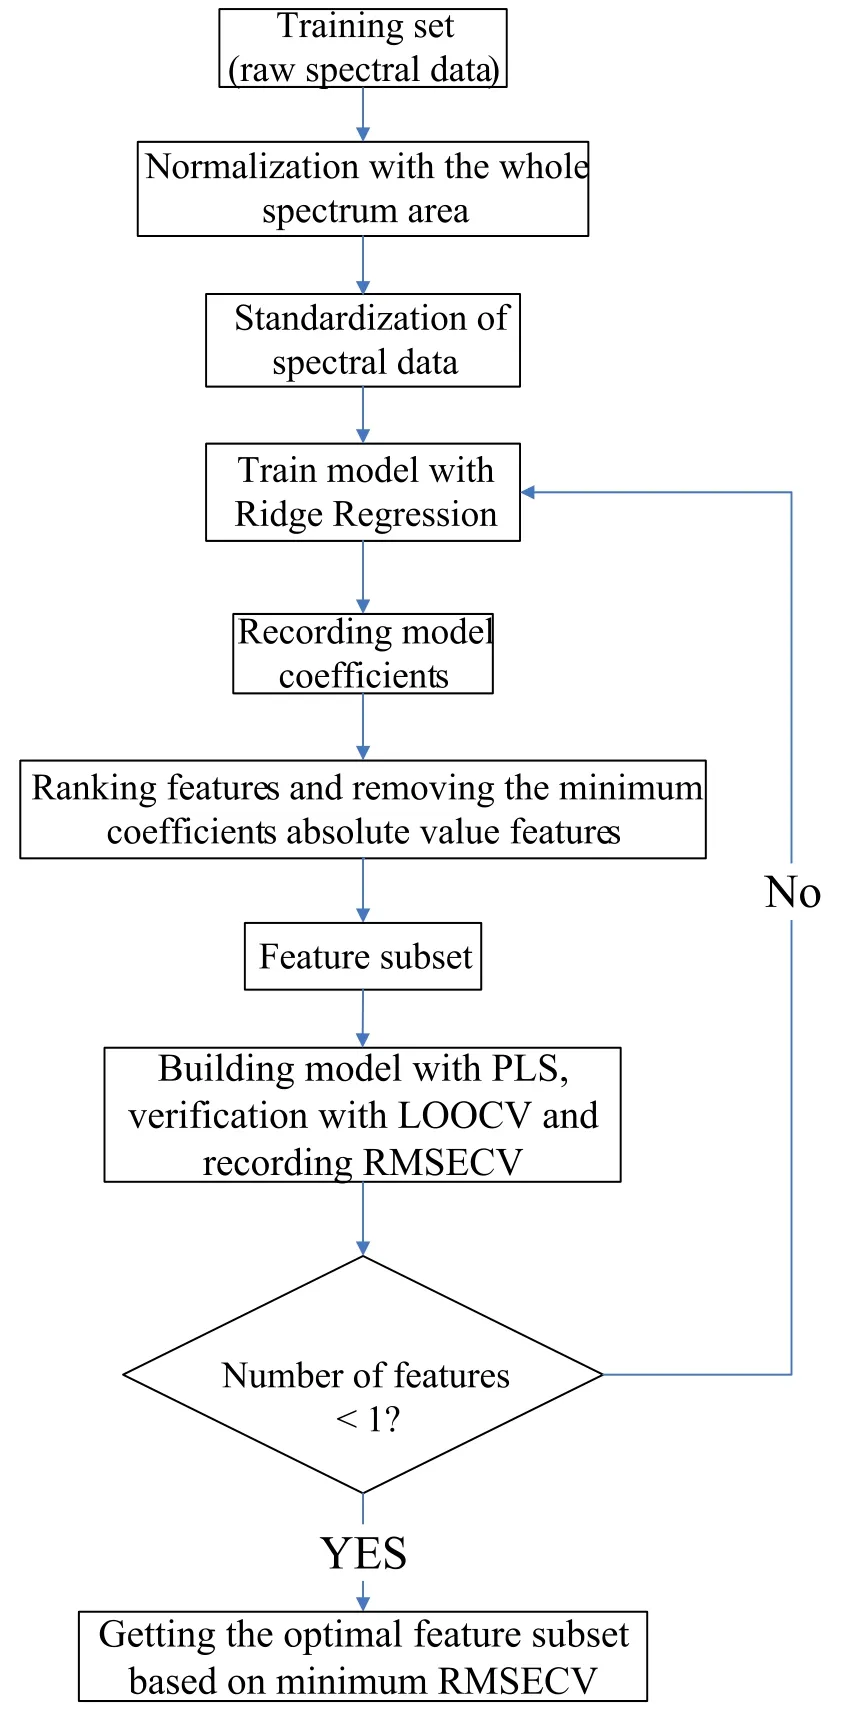
Figure 1.Detailed process based on ridge regression algorithm.
Partial least squares regression(PLS)is a classical method of multivariate statistical analysis.Especially for data with small dimension and low sample and multicollinearity problem between independent variables,this method can reduce the independent variable dimension by extracting principal components to ensure the maximum expression of independent variable information.At the same time,it can guarantee the high correlation between the principal components of the dependent variable and the principal components of the independent variable.Therefore,it is called the second generation regression method.The full spectrum features were used as the input of PLS model to quantify the concentration of six elements of Fe,Si,Mg,Cu,Zn and Mn in aluminum alloy samples,and the best calibration results were obtained by changing the number of principal components with the method of leave-one-out cross validation.The calibration results are displayed in figure 2.
From the calibration results in figure 2,theof the Fe element is only 0.9566,the RMSECV is 0.0601 wt%,and the RMSEP is 0.0476 wt%.The possible reason for this result is that the content of Fe in the aluminum alloy is low,and using the cumulative spectrum,the continuous spectrum generated by bremsstrahlung and recombination radiation has a greater interference with the characteristic spectrum of Fe element[23,24].Therefore,the calibration result of the model is relatively poor.In addition to the Fe element,though theof the other five elements all reached 0.98 or more,the RMSECV and RMSEP of the fitting results were all relatively high.Among them,for the Si element the RMSECV reached 0.3123 wt%and the RMSEP reached 0.1642 wt%.Thence,to obtain better calibration results,the calibration model needs to be improved.
4.2.PLS calibration results after feature selection
To reduce the effect of noise on the PLS model,the abovementioned ridge-REF method is adopted.Grid search is used to optimize the parameters of the algorithm mentioned in figure 1.By setting the parameter range,the grid search traverses all possible hyperparameter pairs and uses cross validation tofor each pair of hyperparameters.Theof each hyperparameter pair is compared to obtain training hyperparameters for model training[25].In addition,in order to better evaluate the method proposed in this paper,GA was used to select the spectrum and compare the analysis results.The start number and the length of the segment needed to be optimized while using GA.The parameters of GA are chosen as:(1) length of maximum Chromosome:100 pixels;(2) population size:50 chromosomes; (3) number of maximum generations:200 generations.Using RMSECV as the fitness function value of the GA.The calibration results of the six elements are shown in figure 3.
In figure 3,after the feature selection,theof Fe element is increased from 0.9566 to 0.9887;the RMSECV of Si element is decreased from 0.3123% to 0.1621%,and RMSEP is decreased from 0.1642 wt% to 0.0995 wt%.Moreover,the results of calibration of Mg,Cu,and Mn elements in a relatively low concentration range are greatly improved.Comparing figure 3 with figure 2,the fitting results of each element in the low concentration range have been significantly improved.Furthermore,the calibration results of the randomly selected 6 test set samples have been further improved.Comparing the calibration results of Ridge-RFE PLS and GA PLS in figure 3,GA PLS can obtain better results on the training set than the original spectrum,and the calibration results of Mg,Zn and Cu elements perform the same as the Ridge-RFE PLS calibration results.However,on the test set,the RMSEP results after GA feature selection are not satisfactory,especially for the Si and Cu elements.Due to the over-fitting problems,the calibration models have unsatisfactory generalization abilities.The specific fitting results are shown in table 2 and figure 4.
After the feature selection,the noise features unrelated to the calibration target elements are removed,and the selected specific input feature dimensions are shown in table 3.Comparing the results of PLS model after feature selection with PLS model,the calibration results of five elements of Fe,Si,Mg,Mn and Cu are significantly improved in both the cross-validation results of the training set and the verification results on the test set.
The spectral lines used to calibrate the six elements after Ridge-RFE feature selection are shown in figure 5(left).As can be seen from figure 5(left),a large amount of background and redundant information was filtered out compared with original spectrum in figure 5(right).The spectral lines for Fe is in the wavelength range of 273–275 nm.The final characteristic lines retained for Cu included those of Cu II 221.0 nm,Cu II 221.8 nm,Cu II 224.7 nm and other spectral lines.In the case of Mg,the emission lines at Mg II 279.9 nm and Mg I 285.2 nm contributed significantly to quantitative analysis.Mn II 259.3 nm and Mn II 260.6 nm contributed significantly to the calibration of Mn concentration.Si I 251.4 nm,Si I 251.6 nm and Si I 288.5 nm contributed significantly to the calibration of Si concentration.Zn I 251.5 nm,Zn I 330.2 nm and Zn I 334.5 nm contributed significantly to the calibration of Zn concentration.The spectral lines finally retained are all concentrated in a certain wavelength range.In addition to the target elements,the spectral lines of other elements that have contributed to the calibration results are also included.The calibration results of the target elements are contributed to by a variety of other elements.
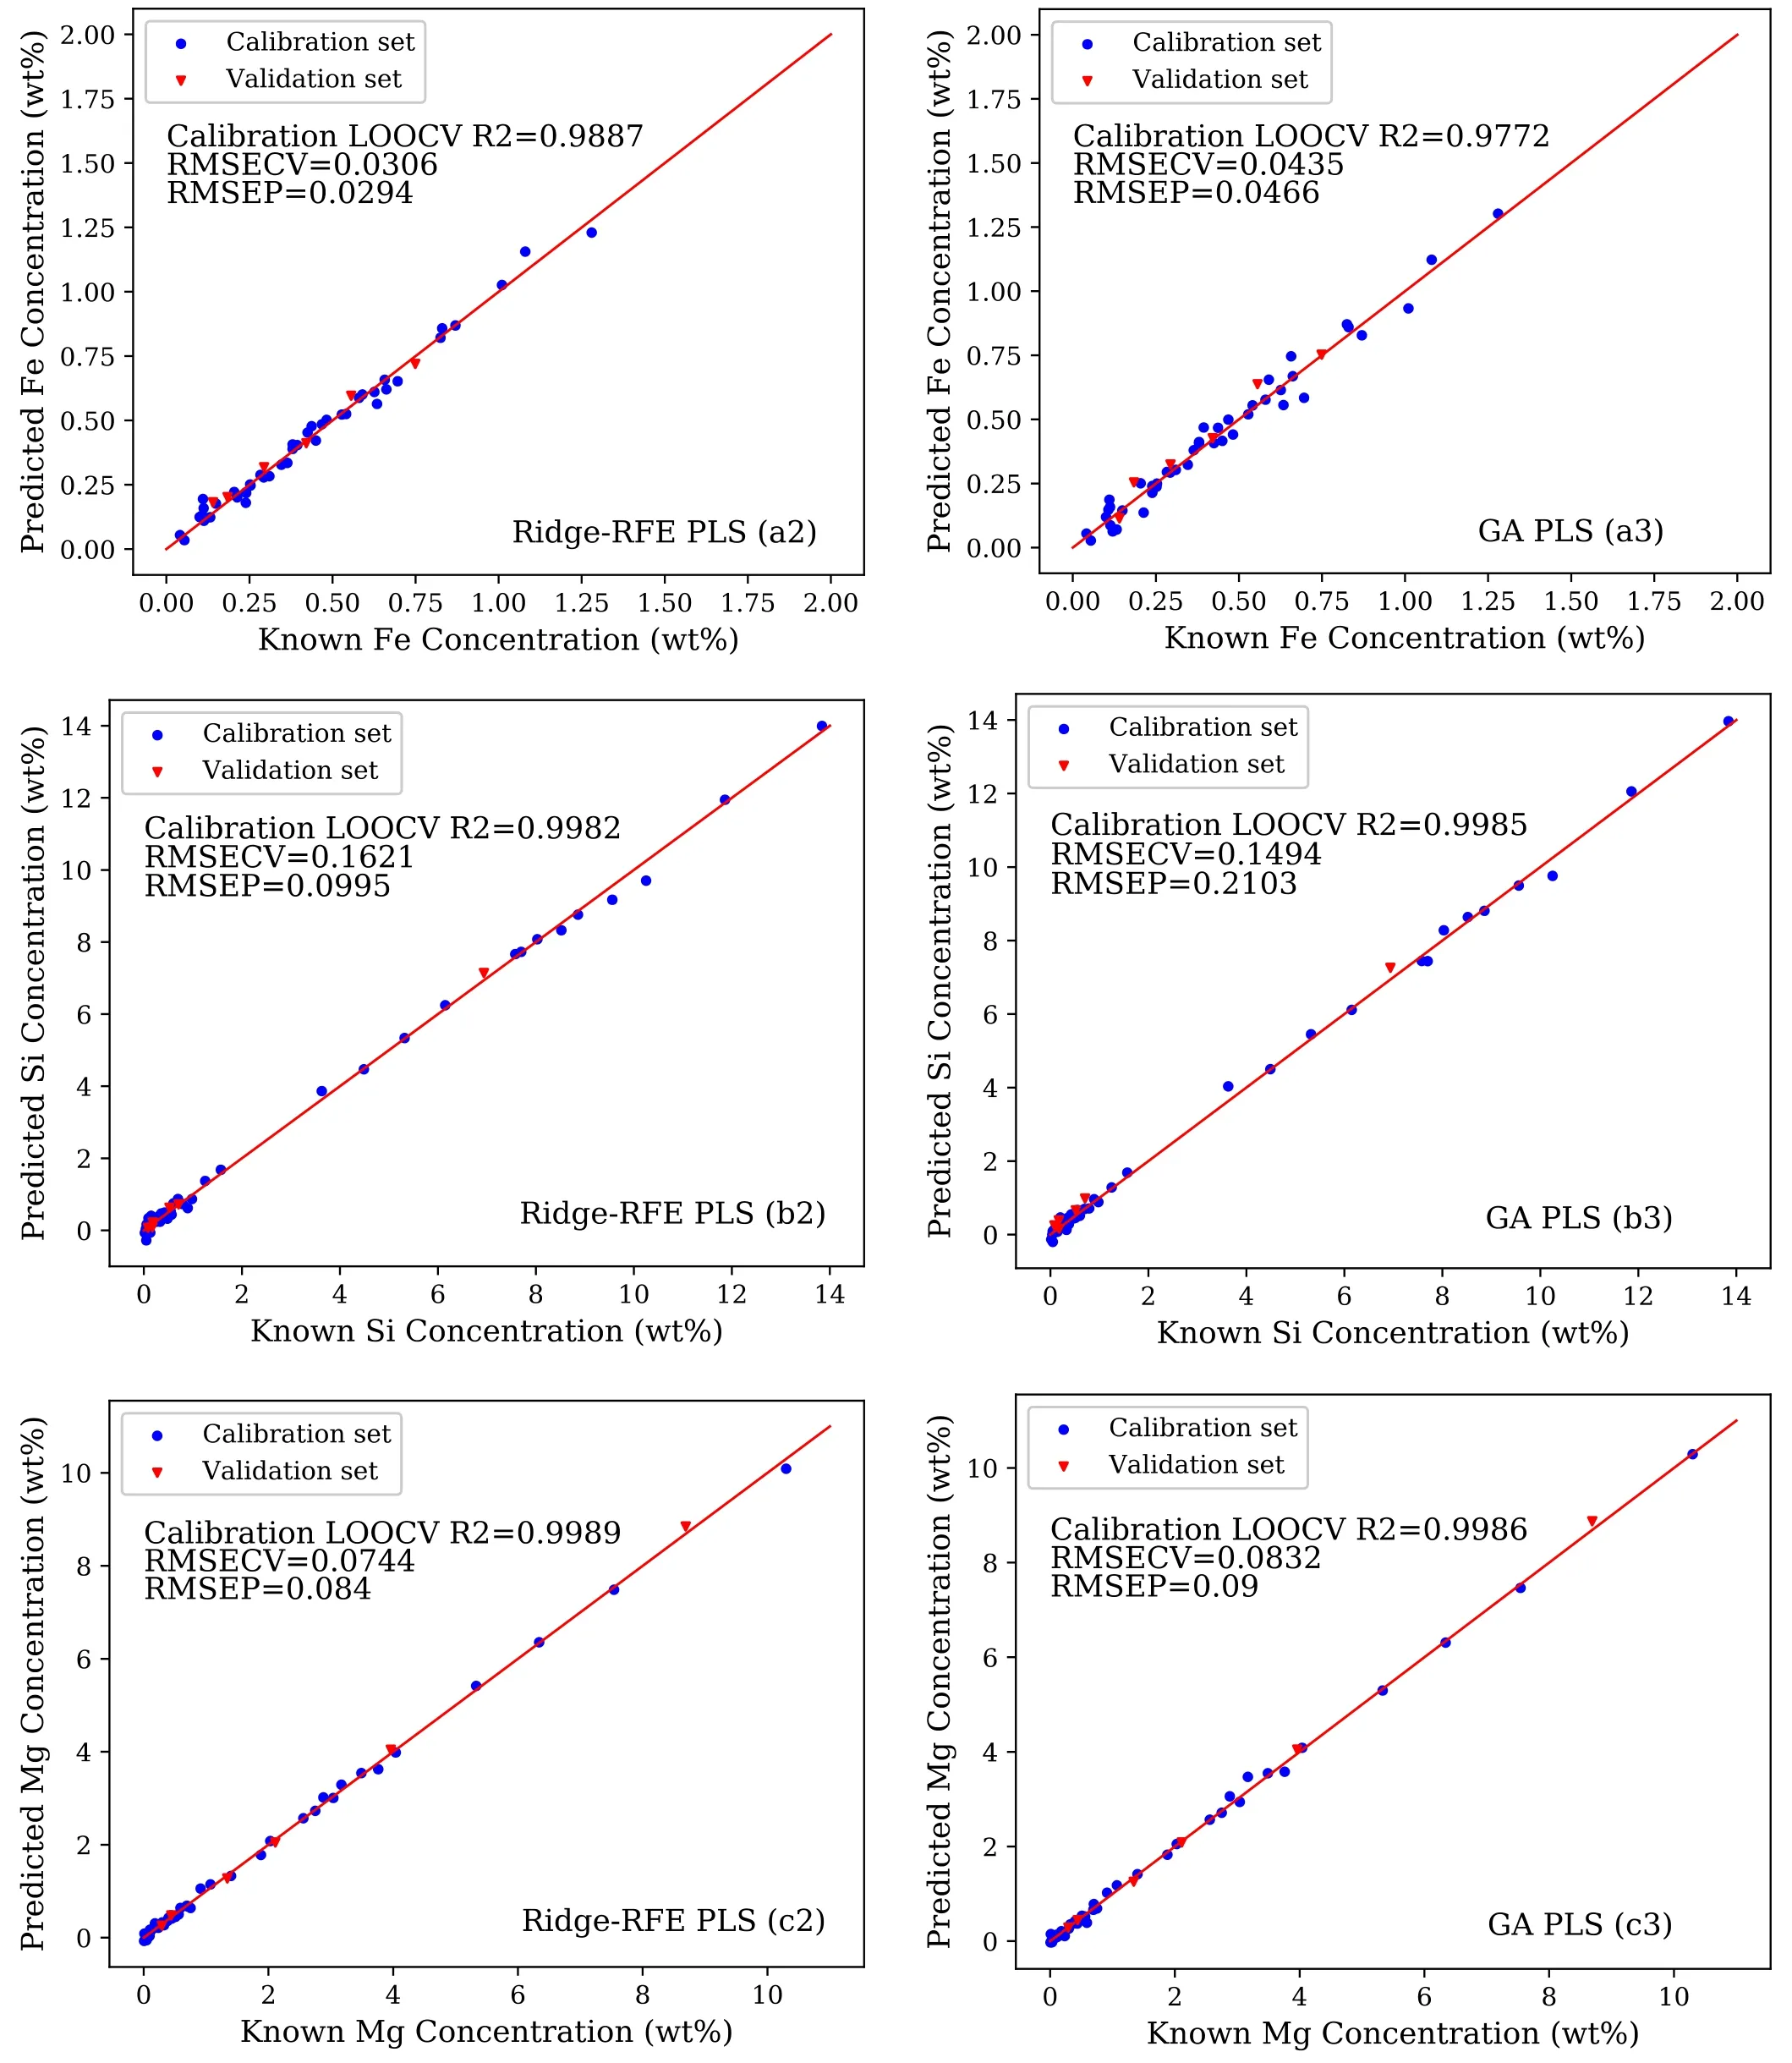
Figure 3.(a2)–(f2) Represents the Ridge-RFE PLS calibration results of the elements of Fe,Si,Mg,Cu,Zn and Mn after feature selection;(a3)–(f3) represents the GA PLS calibration results of the elements of Fe,Si,Mg,Cu,Zn and Mn after feature selection.

Figure 3.(Continued.)
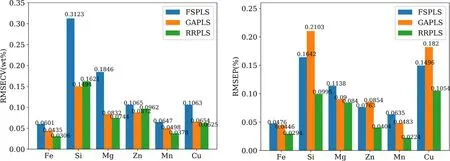
Figure 4.Left and right plots are the RMSECV results for the cross-validation of the training set using PLS and the RMSEP results for the test set using PLS after the feature selection,respectively.
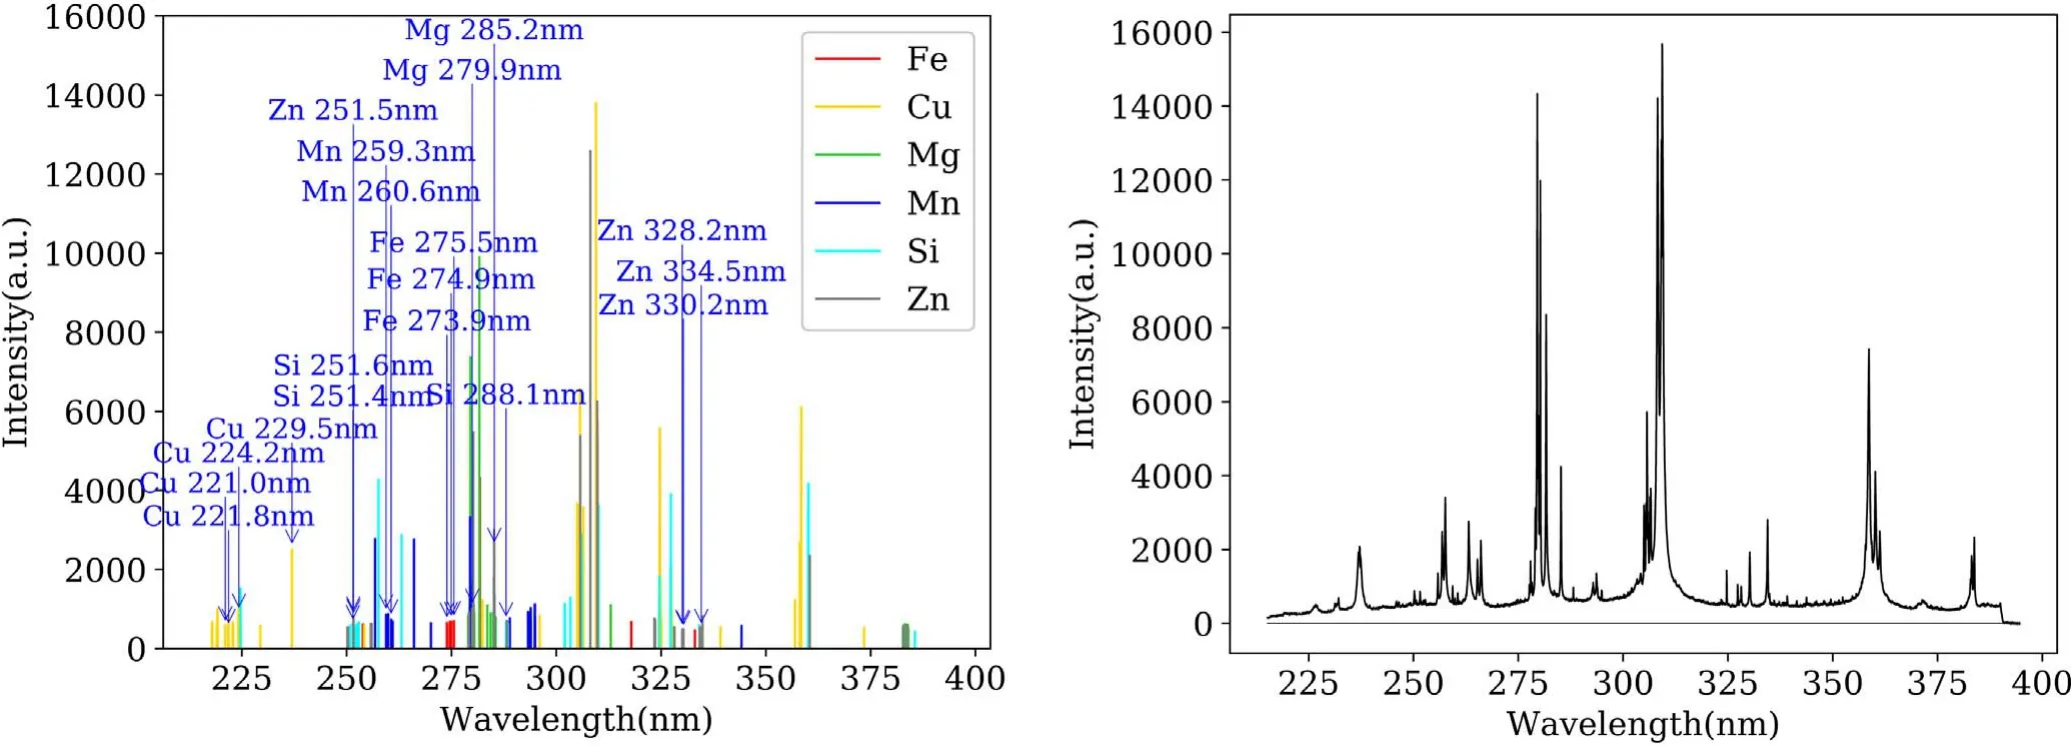
Figure 5.Left plot is the spectrum with retained features to the calibration of Fe,Cu,Mg,Mn,Si and Zn after Ridge-RFE;right plot is raw spectrum.
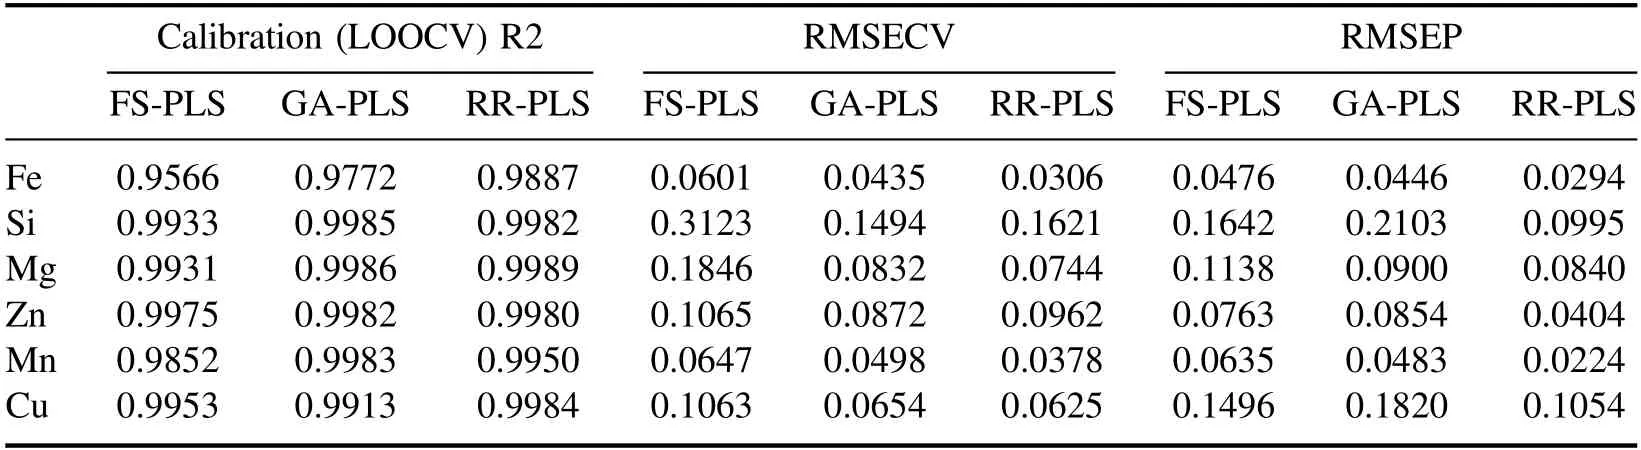
Table 2.Results of PLS and PLS after feature selection.
5.Conclusion
In this paper,the RFE method based on ridge regression is proposed to reduce spectral data dimension.The absolute values of ridge regression coefficients are used to evaluate the single feature,and the spectral lines with the lowest fitting feature weight are eliminated.Finally,PLS model is used to fit the selected features.After feature selection,the feature dimension of PLS input data is less than 100 dimensions,and the calibration results of six elements are notably improved.Compared with other wrapper selection methods,this method selects features through ridge regression fitting results andgradually reduces the size of feature subsets,which greatly reduces the randomness of spectral line selection compared with random search methods.The over-fitting problem is effectively alleviated by using the ridge regression sacrificial fitting deviation to improve the generalization ability,and by using the cross validation to evaluate the whole selected characteristic spectral line subsets.
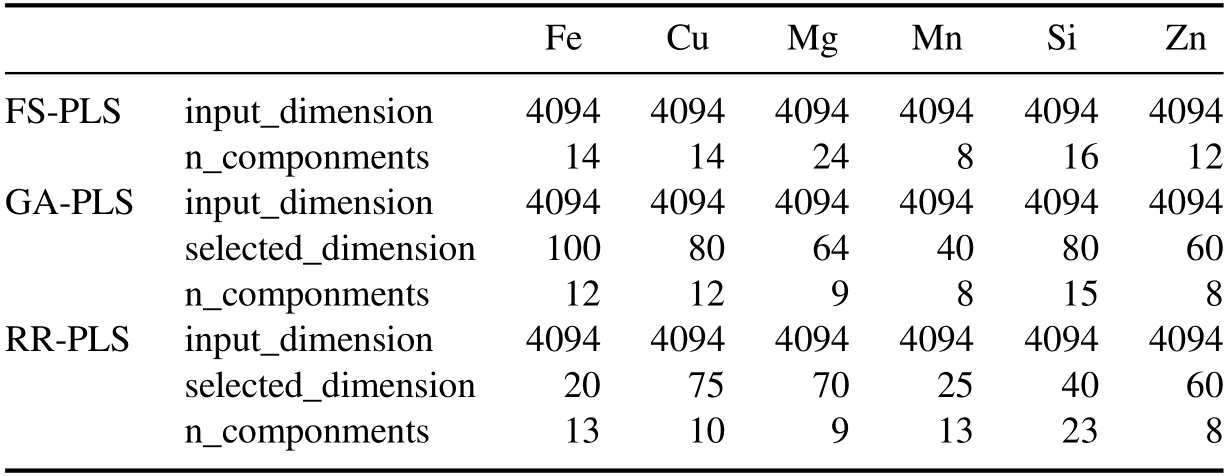
Table 3.Feature selection dimension.
Acknowledgments
This work is supported by National Key Research and Development Program of China(No.2016YFF0102502),the Key Research Program of Frontier Sciences,CAS (No.QYZDJ-SSW-JSC037),and the Youth Innovation Promotion Association,CAS,LiaoNing Revitalization Talents Program(No.XLYC1807110).
猜你喜欢
Plasma Science and Technology(2022年8期)2022-09-14
中草药(2022年8期)2022-04-19
Plasma Science and Technology(2022年3期)2022-04-15
金桥(2022年1期)2022-02-12
科学与财富(2021年36期)2021-05-10
故事会(2018年13期)2018-07-03
艺术评论(2017年10期)2017-03-22
晚报文萃(2015年5期)2015-10-22
新青年(2014年12期)2014-12-12
现代妇女(2014年11期)2014-11-07
 Plasma Science and Technology2020年7期
- Plasma Science and Technology的其它文章
- Influence of target temperature on femtosecond laser-ablated brass plasma spectroscopy
- Spectral characteristics of underwater laserinduced breakdown spectroscopy under high-pressure conditions
- A novel strategy for quantitative analysis of soil pH via laser-induced breakdown spectroscopy coupled with random forest
- Quantitative analysis of the content of nitrogen and sulfur in coal based on laserinduced breakdown spectroscopy:effects of variable selection
- Geographical authenticity evaluation of Mentha haplocalyx by LIBS coupled with multivariate analyzes
- Quantitative analysis of saindha salt using laser induced breakdown spectroscopy and cross-validation with ICP-MS