2017年华北平原采暖季和非采暖季道路PM10污染特征和健康风险评估
—— 以济南市为例
2022-02-06 06:35周学华邵千益王秀亮董扬震温秀芬唐淑婷雒园园王文兴
地球环境学报 2022年6期
宋 杰,周学华, ,邵千益 ,王秀亮 ,巩 伟,董扬震,温秀芬,唐淑婷,雒园园,王文兴
1.山东大学 环境研究院,青岛 266237
2.山东大气环境研究院有限公司,济南 250101
3.济南东之林智能软件有限公司,济南 250101
4.济南市生态环境局章丘分局,济南 250200
5.济南市统计局,济南 250099
6.Institute for Atmospheric and Earth System Research, University of Helsinki, Helsinki 00014, Finland
Particulate matter (PM) has recently emerged as the most significant pollutant in most Chinese regions.For instance, certain urban cities have suffered frequent haze episodes that are thought to be related to particles in recent decades (Wang et al,2014).The air pollution events caused by PM could result in increased morbidity and mortality (Anderson et al, 2012; Raaschou-Nielsen et al, 2013).Moreover,PM greatly influence the climate by changing the microphysical features of clouds (Fiore et al, 2015).Traffic-related emissions have become a substantial source of PM10in several cities of China such as Beijing, Shanghai, Shenzhen and Jinan (Xiao et al,2012; Liu et al, 2019a; Lu et al, 2020).PM emission from traffic includes brake-wear, tyre-wear, tailpipe and re-entrained road dust, of which the latter two are usually the most common (Abu-Allaban et al, 2003).
Air pollution is a serious environmental hazard to health.The World Health Organization (WHO)estimated that 4.2 million premature deaths were attributable to air pollution, especially to PM (https://www.who.int/zh/news-room/fact-sheets/detail/ambient-(outdoor)-air-quality-and-health/).Passengers are exposed to severe traffic-related particles; this particularly affects commuters who must spend their time on the road during rush hours.Trafficrelated PM10is associated with respiratory and cardiovascular diseases (Romero Villalobos et al,2016).Traffic-related pollution also affects the health of drivers and traffic policemen (Pi and Liu,2011; Hachem et al, 2019).Short-term exposure to PM can cause arrhythmia and asthma flare-ups,whereas chronic cardiovascular disorders, respiratory problems and lung cancer are related to long-term exposure (Anderson et al, 2013; Hoek et al, 2013;Hong et al, 2017).Air pollution exposure in transport microenvironments is influenced by the amount of time spent inside transport modes (Dons et al, 2012;Ekpenyong et al, 2012; Namdeo et al, 2016).Paunescu et al (2017) showed that transportation contributes to 12.4% and 9.7% of Parisian children’s exposing to black carbon and ultrafine particles, respectively, when they spent only 5% of their time travelling.Therefore,effective control of traffic emissions can help reduce air pollution and protect human health.Most studies on near-road particles mainly have focused on emission factors and source contributions (Sbayti et al, 2002; Bukowiecki et al, 2009; Amato et al,2011; Amato et al, 2014; Keuken et al, 2016; Bing et al, 2018).Few investigations study near-road PM concentration variation and health assessment (Kongtip et al, 2006).Whitlow et al (2011) and Huang et al(2015) reported that the fluctuation of traffic flow had a significant impact on PM concentration.Recently,He and Gao (2021) observed the temporal and spatial variation of PM at urban traffic intersections and found that pedestrians could lowered their exposure to PM at the crosswalk by delaying their departure by 15 s.Yang et al (2021) found that PM2.5levels were sensitive to trucks, and a reduction in automobile emissions noticeably reduced O3pollution.
Jinan, the capital of Shandong Province, is a typical city in the North China Plain.It covers an area of 7998 km2and a population of 6.44 million (http://jntj.jinan.gov.cn/col/col27523/index.html).Based on data from the Jinan Municipal Bureau of Ecology and Environment (http://jnepb.jinan.gov.cn/col/col10451/index.html), PM10and PM2.5were the primary pollutants that exceeded the Grade Ⅱ standard(35.0 µg · m−3for PM2.5and 70.0 µg · m−3for PM10in GB 3095 — 2012 in China) by 0.9 and 0.8 times in 2017, respectively.Traffic-related emission was a significant anthropogenic source of PM10in the city with a percentage of 23.3% (http://jnepb.jinan.gov.cn/art/2018/5/18/art_10429_1115123.html).Fig.1 depicts the number of automobiles between 1999 and 2017.This number increased dramatically from 0.23 million(2004) to 1.95 million (2017) (http://jntj.jinan.gov.cn/col/col27523/index.html), which may significantly elevate the level of atmospheric particles.
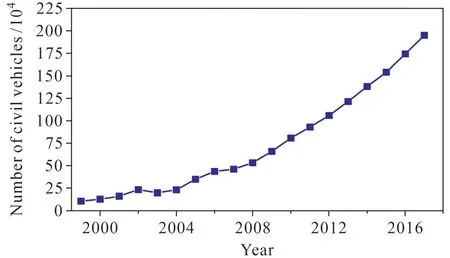
Fig.1 Number of civil vehicles between 1999 and 2017 in Jinan
In this study, the near-road PM10was investigated during the non-heating and heating periods in Jinan.The PM10concentration and health assessment were inspected based on 51 roadside sites.The monitoring sites were firstly divided into three types based on their surrounding settings.Then, the levels, and spatial and temporal variations (including weekly and diurnal variations) of near-road PM10at the three types of monitoring sites were inspected.Finally, risk assessment was carried out in the non-heating and heating periods.This research provides an insight into near-road PM10and its influence on human health in the North China Plain.Our findings may help the government establish targeted strategies for controlling PM on various roads.
1 Data source
Data about near-road PM10hourly concentrations were collected at 51 roadside sites in five districts of Jinan: seven sites in Huaiyin (HY), twelve in Lixia(LX), thirteen in Licheng (LC), eleven in Shizhong(SZ) and the rest in Tianqiao (TQ) in Jinan.In addition, a routine monitoring site at Quancheng Square (QS) set up by the Jinan Municipal Bureau of Ecology and Environment in an urban residential neighbourhood was chosen as a contrasting site.Data were collected during two periods: October (nonheating period) and November 15 to December 15,2017 (heating period).To investigate near-road PM10pollution, the monitoring network was developed and the data were measured simultaneously by the Jinan government at the 51 roadside sites.Atmospheric particle automatic sampler with a flow rate of 16.7 L · min−1(Anhui Landun Photoelectron Co.Ltd.,LGH-01B) was used to determine the concentration of near-road PM10.Hourly PM10concentrations in QS were released by the Shandong Provincial Eco-Environment Monitoring Center.
The meteorological parameters were obtained from Jinan Environment Monitoring Center.Data on boundary layer height (BLH) were obtained via European Centre for Medium-Range Weather Forecasts (https://climate.copernicus.eu).
2 Results and discussion
2.1 General characteristics
2.1.1 Near-road PM10concentration in the non-heating and heating periods
The average PM10concentrations were 187.0 µg · m−3and 128.5 µg · m−3across the study period at near-road and QS sites, respectively, which greatly exceeded the Grade Ⅱ standards of China (70 µg · m−3for PM10), indicating very severe particle pollution in the city.The near-road PM10concentration was about 1.5 times of that at the QS site (Tab.1), meaning the significant influence of traffic-related emissions on PM10.Notably, compared with the non-heating period,the concentration of PM10in the heating period had an elevation of 45.7 µg · m−3and 37.7 µg · m−3at the roadside and QS sites, respectively, which were both 1.3 times of those in the non-heating period.
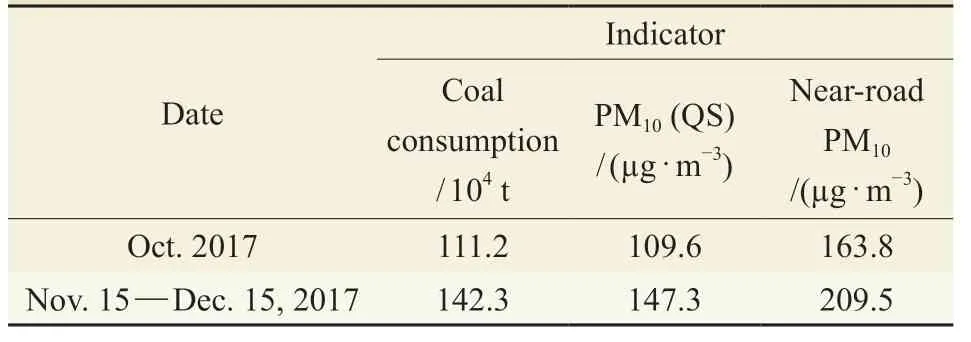
Tab.1 Coal consumption and PM10 concentrations in the non-heating and heating periods in Jinan
Fig.2 shows the boundary layer height (BLH)in the non-heating and heating periods.From the figure, the BLH was lower than 200 m from 18∶00 to next 07∶00 in the non-heating period.After 07∶00, the BLH began to increase and at 13∶00,it reached the highest height of about 1000 m.In the heating period, the variation of BLH is roughly consistent with that in the non-heating periods.The values of standard deviations (STDs) during the heating period were lower than those during the non-heating period, which suggested the stable and unfavorable atmospheric diffusion conditions during the heating period.However, the wind speed was comparable with a value of 1.40 m · s−1during the non-heating period and 1.64 m · s−1during the heating period.These discrepancies could not cause such a big difference in PM10concentrations in the two periods.
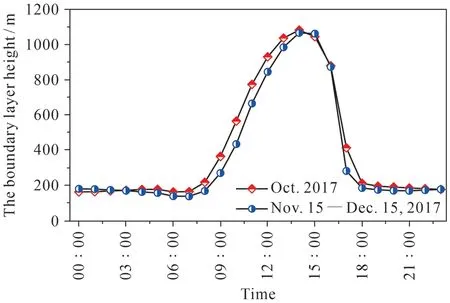
Fig.2 BLH in October and November 15 to 15 December,2017 in Jinan (the bar is standard deviation)
Coal is a major source of energy in the city of Jinan.The consumption of coal is higher than other main energy sources (gasoline, diesel oil, fuel oil, etc.) in industrial enterprises with a percentage of 50.2% (http://jntj.jinan.gov.cn/col/col27523/index.html).There is an extra coal consumption in the heating periods compared with that in the nonheating periods due to the heating supply in northern China.In Jinan, 1.33 million tons coal were used in 2017 for production in industrial enterprises with an annual output value over 20 million yuan in the main business.In contrast, 0.25 million tons of coal were used for the heating from November 15, 2017, to March 15, in 2018.Tab.1 shows the coal consumption during the observation.Compared with the nonheating period, additional 0.063 million tons of coal were consumed in the heating period.Correspondingly,PM10concentrations increased by 45.7 µg · m−3at the roadside sites.Furthermore, the source apportionment from the Jinan Municipal Bureau of Ecology and Environment revealed that PM10primarily originated from the dust, vehicle emissions and coal combustion with the percentages of 36.4%, 33.1% and 9.1%,respectively, during the non-heating period in contrast with 24.3%, 24.6% and 27.5%, respectively, in the heating period (http://jnepb.jinan.gov.cn/art/2018/5/18/art_10429_1115123.html).The evident rise of coal combustion contribution to PM10in the heating period suggested that coal consumption had a significant contribution to PM10concentration in Jinan in this period.
2.1.2 PM10ratios in the heating to non-heating periods in Jinan
Coal combustion throughout winter was a major contributor leading to higher PM10level in northern China.To understand the influence of winter heating on air pollution, the concentrations of PM10in the heating period were compared with those in the nonheating period.As shown in Tab.2, the concentration of PM10was 157.7 µg · m−3during the non-heating period, whereas it reached 219.0 µg · m−3during the heating period in Beijing (Sun et al, 2016), so the ratio is similar to that in this investigation.Further, Liu et al (2018) found that the concentration of PM10was 253.0 µg · m−3during the non-heating period and it increased by 25.0% during the heating period in Shijiazhuang.The average concentration of PM10during the heating period was 133.0 µg · m−3in contrast to 96.0 µg · m−3during the non-heating period in Yinchuan (Wang et al, 2016).These ratios were similar to that in Jinan.Qu et al (2019) showed that the annual average PM10concentration during the heating period (263.2 µg · m−3) was 1.6 times of that during the non-heating period (164.5 µg · m−3) in Shijiazhuang in 2013 — 2016.The same ratio was found in Shenyang by Zhang and Zhao (2019).In Harbin, Huang and Wang (2014) observed that PM10concentration during the heating period was 1.5 times of that during the non-heating period.Besides these, the ratios of PM10in the heating period to the non-heating period in Qingdao and Tianjin were 1.2 and 1.1, respectively(Xu et al, 2015).The relatively low ratio was also monitored in Zhengzhou by Wang et al (2017).Based on earlier studies, the concentrations of PM10increased by approximately 4% — 60% during the heating period compared with that in the non-heating period, demonstrating the influence of increased coal consumption on PM10in winter in northern China.
2.2 General pollution characteristics of near-road PM10 on different types of roadsides
The near-road monitoring sites were separated into three types based on the surrounding environment:(1) located in residential areas, normally less polluted(Type Ⅰ, 10 sites); (2) influenced by construction activity near the monitoring sites throughout the study period (Type Ⅱ, 16 sites); and (3) the remaining roadside monitoring sites with a large number of vehicles (Type Ⅲ, 25 sites).
Tab.3 shows the PM10average concentrations at the three types of roadside sites and QS site.From the table, compared with the QS site, the concentration of near-road PM10showed a considerable fluctuation with a larger STD.PM10concentrations in Type Ⅰ were the lowest in the non-heating and heating periods among the three types of roadside sites.A detailed inspection found that there were better greening belts, pavements in good condition, and fewer automobiles and other emissions surrounding the road, which could be the main reasons for the relatively low PM10concentration in Type Ⅰ.PM10concentration was the highest and exhibited the largest STD in Type Ⅱ(Tab.3), which may be attributed to the significant increase in traffic flow volume or a large number of construction activities in a short time.Noteworthy, in the heating period, the near-road PM10concentrations increased by 62.3 µg · m−3, 41.2 µg · m−3and 30.9 µg · m−3in Type Ⅱ, Type Ⅲ and Type Ⅰ compared with those in the non-heating period, respectively.The order of the increments of PM10was consistent with that of PM10concentrations in the three types of roadside sites.

Tab.2 Concentrations of PM10 in the non-heating and heating periods in northern China
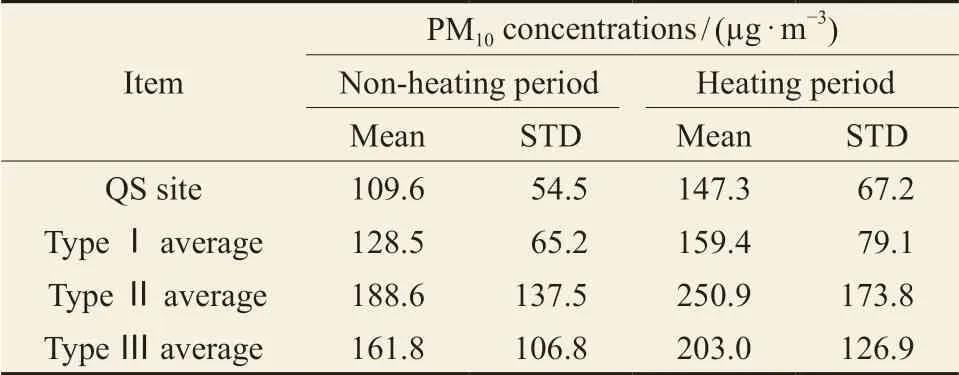
Tab.3 Mean concentrations and standard deviations of PM10 at the three types of roadside sites and QS site
2.3 Spatial variations
The average concentrations of near-road PM10from 51 roadside sites in five major districts of Jinan are shown in Fig.3.From the figure, LC and TQ experienced the most severe near-road PM10pollution with concentrations of 188.7 —257.7 µg · m−3, whereas HY, SZ and LX had relatively lower PM10levels with concentrations of 142.3 — 201.3 µg · m−3.The difference among these districts could be attributed to traffic-related emissions and local sources (Jin et al, 2017).LC had the highest proportion (36.0%) of secondary industry (coalfired power plant, manufacturing industry, etc.) and the lowest proportion (59.0%) of tertiary industry(bank, hotel, restaurant, etc.) in gross domestic product among the five districts.Particles emitted from industries such as power plants increased the concentration of PM10in the ambient air, including near-road PM10in the district (Xiao et al, 2015).The highest proportion of tertiary industry was found in LX (86.0%).The lowest concentration was observed in the district dominated by commercial and residential areas.These findings indicated that near-road PM10may be affected by different sources.
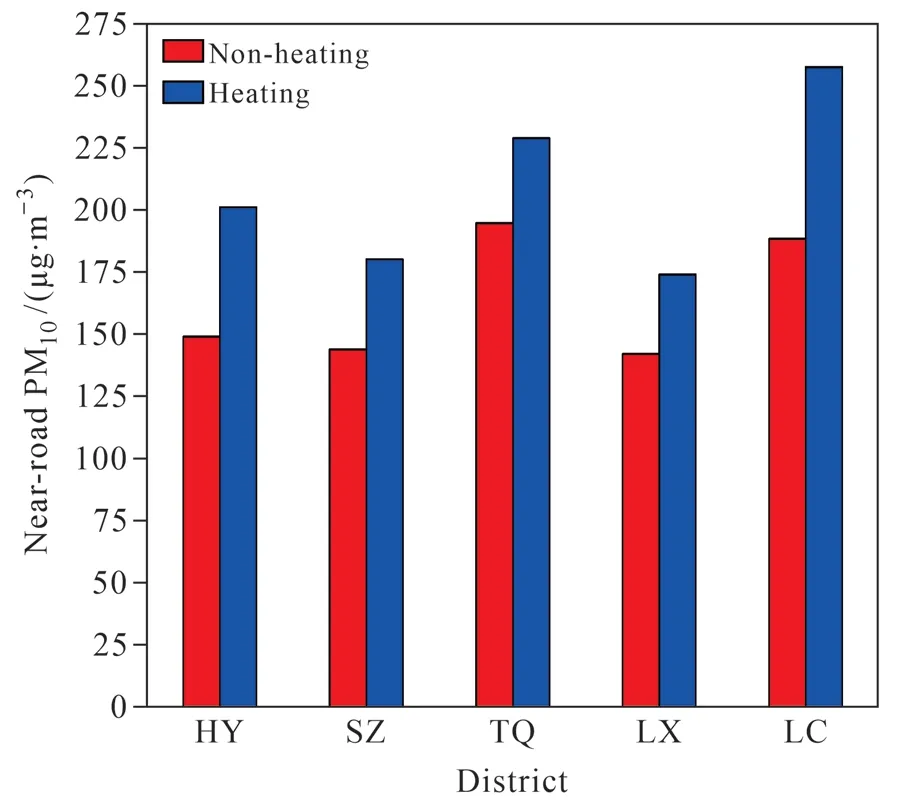
Fig.3 The cartogram of the average concentrations of nearroad PM10 in the five districts
In the five districts, near-road PM10concentrations had an increased rate from 17.6% to 36.6%from the non-heating to heating period.LC and HY had the largest increases with 36.6% and 34.8%,respectively.This may be attributed to heating industries, which emitted extra large amounts of particles in the heating period compared with those in the non-heating period in the two districts.SZ, LX and TQ had the growth ratios of 25.1%, 22.4% and 17.6%, respectively.Coal heating had a lower effect on near-road PM10in SZ, LX and TQ compared with those in LC and HY.
2.4 Temporal variation
2.4.1 Weekly variation
The weekly variations of PM10at roadside and QS sites are shown in Fig.4.In the non-heating and heating periods, the highest values occurred at Type Ⅱ sites, followed by Type Ⅲ and Type Ⅰ, and the lowest values were detected at QS site on the corresponding day in the weekly variation (Fig.4).During the non-heating period, at both the roadside and QS sites, the trends of PM10were all with the highest concentrations on Saturday in contrast to the lowest values on Tuesday.This might be attributed to more anthropogenic activities on Saturday, not the bad atmospheric diffusion because the relative wind speed on Saturday was not the lowest (Tab.4).The patterns were consistent with the trend in Chengdu with increased levels on weekends (Huang et al, 2015).In the heating period, the highest concentrations were observed on Thursday and the lowest concentrations were observed on Tuesday and Saturday.The lowest concentration in the heating period and the highest concentration in the non-heating period were observed on Saturday which may be attributable to the decreased temperature during the heating period that reduced residents’ willingness to travel on weekends.Another, the relative high wind speed on Saturday in the heating period probably also had a certain contribution (Tab.4).The concentrations had fewer differences in the weekly variation from Monday to Sunday at roadside and QS sites in the heating period than those in the non-heating period.For example, in the heating period, the peak concentration(170.6 µg · m−3) observed on Thursday at QS site was 1.3 times of the lowest value (130.7 µg · m−3)on Saturday.While, the highest concentration on Saturday (160.2 µg · m−3) at QS site was 1.8 times of the lowest value on Tuesday (87.4 µg · m−3) during the non-heating period.The differences of wind speeds on the days with the highest concentrations and the lowest concentrations were 0.48 m · s−1and 0.49 m · s−1in the non-heating and heating periods, respectively.Therefore, it was not meteorological factor, but coal combustion for heating that offset part differences of PM10concentrations between the highest and lowest values which was mainly caused by vehicles in the heating period likely that in the non-heating period.Notably, PM10concentrations were higher in the nonheating period than those in the heating period on all Saturday and part Friday (Fig.4), suggesting that there was a larger number of vehicles on these days in the non-heating period, that is, the emissions from the vehicles in the non-heating period exceeded the total emissions from the vehicle and extra coal combustion in the heating period on these days.The relative low wind speeds in the non-heating periods were probably another reason.
2.4.2 Diurnal variation
(1) QS
Fig.5 shows the diurnal variation of PM10concentration at roadside and QS sites.From Fig.5a,during the non-heating period, two peaks were observed at 09∶00 and 19∶00 with concentrations of (117.3 ± 48.0) µg · m−3and (119.4 ± 56.3) µg · m−3,respectively, which could be influenced by traffic during rush hours and poor diffusion conditions due to the relatively low BLH (Fig.2).The lowest concentration was (100.2 ± 54.1) µg · m−3occurring at 14∶00.This may be attributed to the meteorological conditions, which were favorable for dispersion and diffusion with higher BLH (Guan et al, 2018), and fewer traffic vehicles.
During the heating period, the pattern was identical to that in the non-heating period.The lowest concentration was observed at 16∶00 ((130.5 ±63.9) µg · m−3) and the relatively high values occurred at 09∶00 ((164.4 ± 64.7) µg · m−3) and 22∶00((156.1 ± 63.1) µg · m−3).The levels at 16∶00 and 09∶00 increased by 29.7% and 40.2% in the heating period in contrast to those at the same time in the non-heating period, respectively, suggesting that the higher coal consumption in the heating increased PM10concentration.
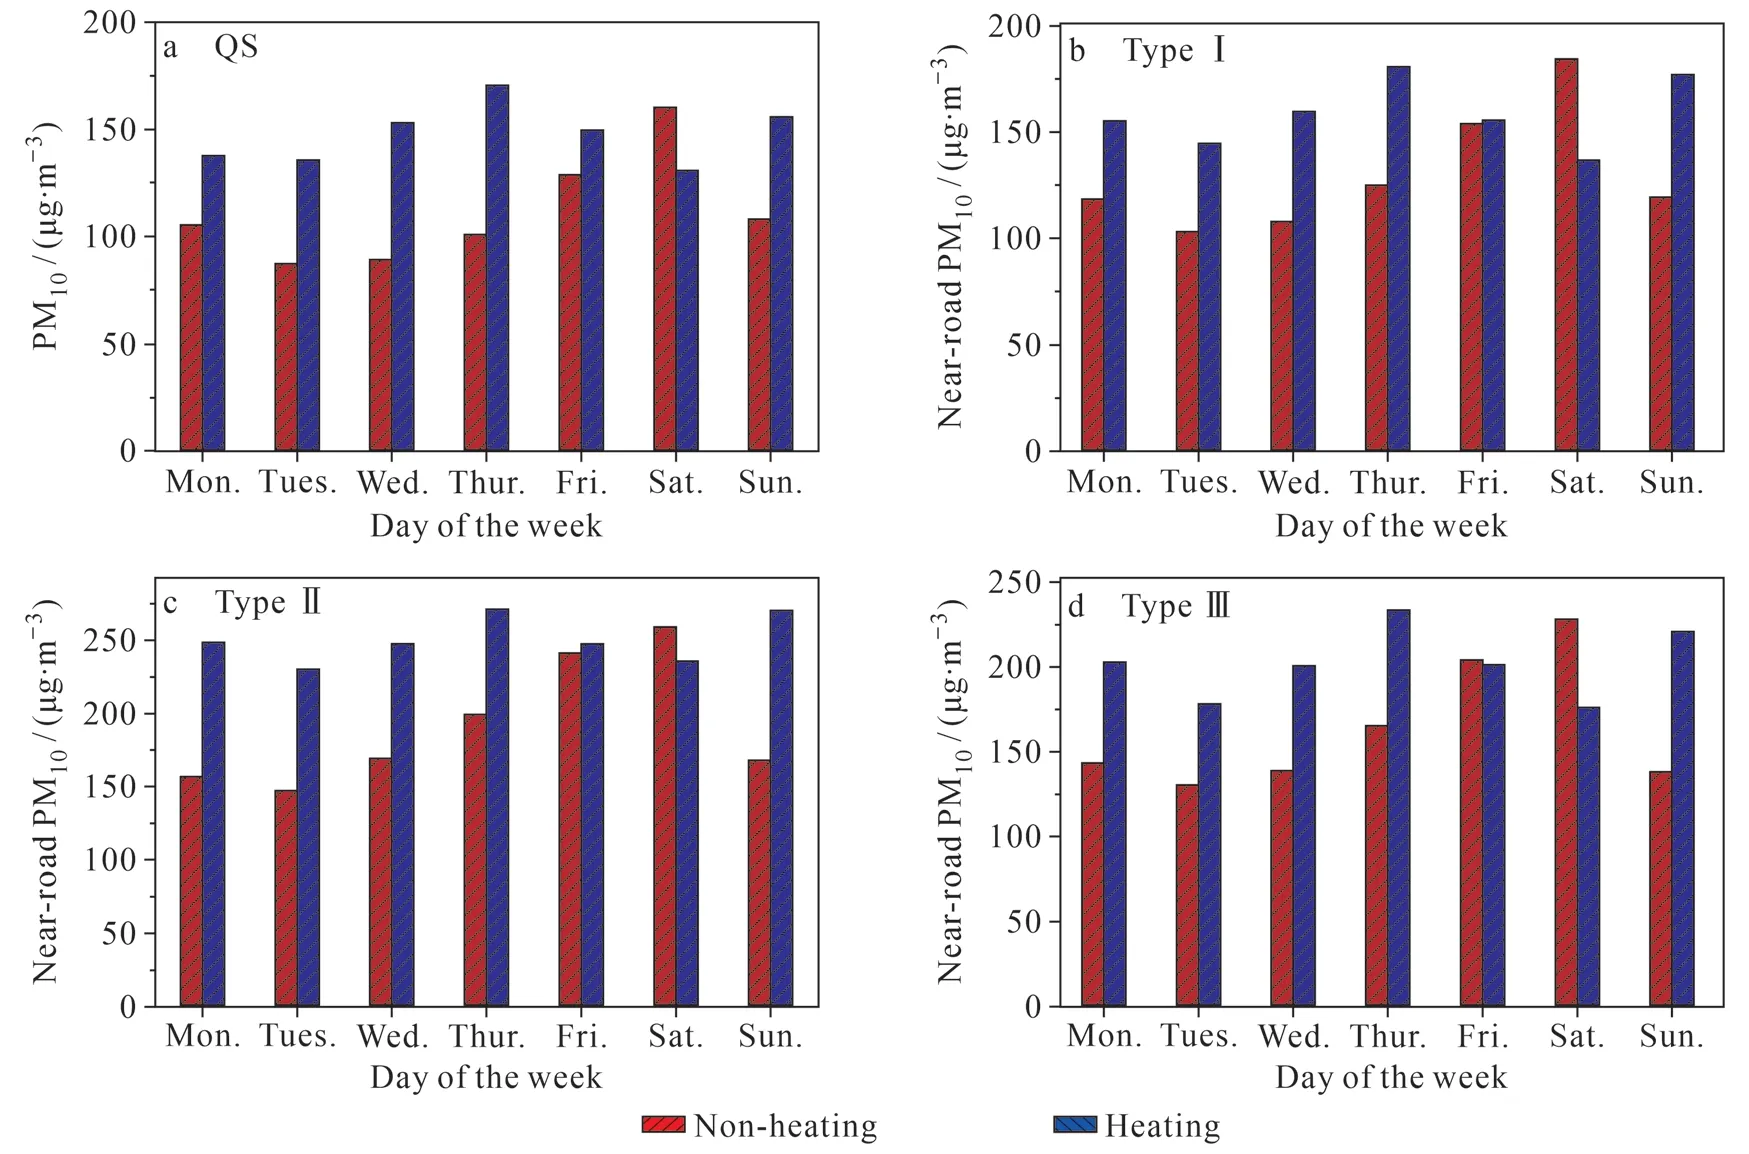
Fig.4 Weekly variations of PM10 during the non-heating and heating periods

Tab.4 The wind speeds in one week in the non-heating and heating periods
(2) Type Ⅰ
Fig.5b shows the diurnal variation of near-road PM10of Type Ⅰ which is located in a residential area with better urban greening belts.From the figure,during the non-heating period, the near-road PM10concentration displayed a bimodal pattern.The peaks were observed at 09∶00 ((139.4 ± 55.9) µg · m−3) and 19∶00 ((145.8 ± 76.2) µg · m−3).The elevations in the morning and evening rush hours were associated with a sharp increase of traffic volume (Ryou et al, 2018).A lower concentration ((117.1 ± 63.8) µg · m−3) was observed at 14∶00.
During the heating period, there were two peaks at 08∶00 ((179.0 ± 79.7) µg · m−3) and 18∶00 ((160.1 ±72.7) µg · m−3), which increased by 28.4% and 9.8%,respectively, compared with rush hour peaks in the nonheating period.The lowest concentration occurred at 15∶00 with a value of (137.4 ± 69.6) µg · m−3, which increased by 17.3% compared with the concentration at 14∶00 in the non-heating period.
(3) Type Ⅱ
Fig.5c shows the diurnal variations of PM10of Type Ⅱ.From the figure, there were high STDs(91.4 — 220.1 µg · m−3), especially at midnight,suggesting there were sudden and local influences at the site, such as construction activities and plying of trucks used in the activities.During the non-heating period, the highest peaks occurred at 08∶00 and 20∶00, reaching (203.7 ± 121.2) µg · m−3and (227.7 ±184.7) µg · m−3, respectively.The lowest concentration occurred at 13∶00 with a value of (155.4 ±91.4) µg · m−3, higher than the lowest values at QS and Type Ⅰ sites, which was mainly attributed to high traffic volume and frequent construction activities.
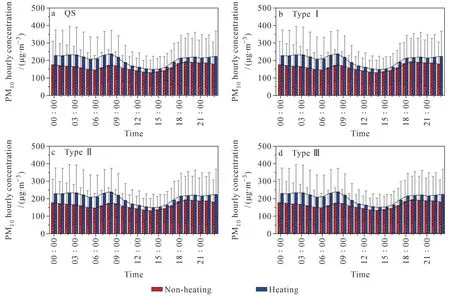
Fig.5 Diurnal variations of PM10 concentrations
During the heating period, the near-road PM10concentration with the peaks at 07∶00 and 20∶00 were(305.9 ± 185.3) µg · m−3and (278.7 ± 217.4) µg · m−3,respectively, increasing by 50.2% and 22.5%compared with those at the same time in the diurnal variation in the non-heating period.The lowest concentration was observed at 13∶00 (180.7 ±98.3) µg · m−3, which rose by 16.3% at the corresponding moment in the non-heating period.
(4) Type Ⅲ
Type Ⅲ sites are located at a large intersection with a high traffic volume.Traffic-related emissions played an important role on the road particles pollution(Amato et al, 2016).During the non-heating period,the diurnal variation showed a bimodal pattern at the sites with peaks at 08∶00 ((172.7 ± 88.4) µg · m−3)and 19∶00 ((192.4 ± 135.1) µg · m−3), respectively(Fig.5d).The lowest concentration ((130.2 ±71.0) µg · m−3) was observed at 14∶00.Trafficrelated emissions contributed highly to the near-road PM10(Amato et al, 2011; Ferm and Sjöberg, 2015;Grigoratos and Martini, 2015).The particulate diurnal variations between Type Ⅱ and Ⅲ sites were similar.The concentration at Type Ⅱ sites was higher than that at Type Ⅲ sites due to the strong influence from construction dust.Type Ⅲ sites were mainly affected by private cars, and the peaks of concentrations were observed during rush hours in the morning and afternoon.Higher values were mainly found at TypeⅡ sites at night due to construction activities and earthwork transport by trucks.
The curve at Type Ⅲ sites in the heating period was identical to that in the non-heating period (Fig.5d).One peak ((237.6 ± 134.6) µg · m−3) was observed at 08∶00 and the other ((219.8 ± 141.2) µg · m−3) was found at 20∶00, increasing by 37.6% and 14.2%compared with the rush hour peaks at the same time during the non-heating period, respectively.The lowest concentration was found at 14∶00 with a value of (148.5 ± 75.8) µg · m−3with an increase of 14.1% compared with that in the non-heating period.
During the observation, the lowest PM10concentrations were found approximately at 13∶00 or 14∶00 at QS, Type Ⅰ, Type Ⅱ and Type Ⅲsites.The highest peaks mainly occurred at 06∶00/07∶00/08∶00 and 19∶00/20∶00 in the investigation.The diurnal variation trends of Type Ⅰ,Type Ⅱ and Type Ⅲ were essentially comparable.However, the order of concentration and STD were evidently different with Type Ⅱ> Type Ⅲ> Type Ⅰ.Type Ⅱ showed the highest level of concentration and STD than the others, indicating that construction dust may cause higher concentrations and fluctuations for near-road PM10.The concentrations of PM10in the heating period were higher than those in the nonheating period, which might be explained by the influence of extra coal combustion.
2.4.3 Risk assessment
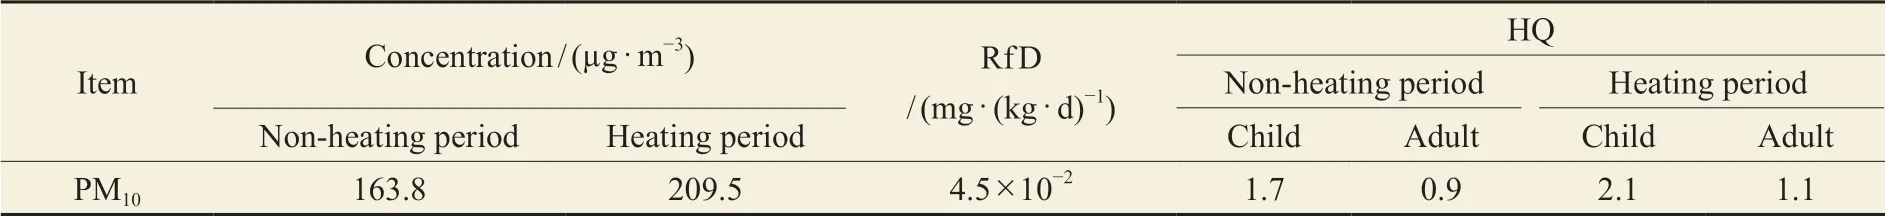
Generally, residents are subjected to heavy traffic-related pollution.Exposure to high level nearroad PM10pollution might cause respiratory diseases.In previous studies, Yu et al (2012) used the PM10daily concentration limit issued by the WHO as a reference dose (Rf D) of PM10.In this study, Rf D of PM10was 45.0 μg · (kg · d)−1(Xiang et al, 2015).The exposure through inhalation was calculated using Eqs.(1) &(2) adapted from the US Environmental Protection Agency (Xiang et al, 2015; https://www.epa.gov/risk):

where:c= concentration of near-road PM10or heavy metals; IR = inhalation rate (7.5 m3· d−1for children;14.5 m3· d−1for adults); EF = exposure frequency(350 d · a−1); ED = exposure duration (24 a for adults and 6 a for children); BW = body weight (15.9 kg for children; 56.8 kg for adults); AT = averaging time(ED × 365 d); HQ = hazard quotient, when HQ≤1,indicating risk can be accepted or ignored, HQ>1,can pose a health risk.
In the study, all HQ values of PM10were greater than 1 except for the value for adults during the nonheating period (Tab.5).This indicates that the risk levels of near-road PM10were beyond the acceptable limit and long exposure in traffic environment should be avoided.In addition, PM10in the heating period caused higher risk than those in the non-heating period.Compared with the residents exposure to ambient PM10in Lanzhou (Yu et al, 2012), traffic participants were subject to greater health risk in this study.
Tab.5 HQ value of near-road PM10 through breathing
As noted in the diurnal variation, higher concentrations of PM10mainly occurred during rush hours and at night (Fig.5).PM10has health risk for both children and adults, especially children.And various studies have explored the relationships between traffic-related pollution and development of asthma and atopy (Foos et al, 2007; Halonen et al, 2008; Yamazaki et al, 2014).Some researchers have found that air pollution can result in a notable increase of asthma morbidity, especially among young people (Liu et al, 2019b).As a susceptible population,children should avoid morning activities near major roadways and take precaution measures on their way to school to avoid exposure to pollutants.In addition,the main participants of traffic are commuters in rush hours when near-road PM10is increased by traffic jams.Thus commuters should take protective measures on the commute.Traffic authorities should take concrete measures to reduce traffic congestion to protect human health.
3 Implications for controlling near-road PM10 concentration
In the measurement, there was an obvious increase of near-road PM10concentration during the heating period, which was caused by the increase of coal consumption.Thus, controlling coal consumption can effectively reduce the concentration of PM10in the heating period.In addition, in the three types of roadside sites, relatively high concentrations were observed at Type Ⅱ sites.They were seriously impacted by construction activities, including construction dust and emissions from the engineering vehicles used at the construction site and the trucks which were used to transport construction materials.Therefore, it is very necessary to adopt measures to reduce particle pollution in these activities.For example, using water and covering materials can effectively control re-entrained particles at construction sites (Muleski et al, 2005; Xing et al,2018).In addition, reducing the dust load on the ground and changing the fuel used by the trucks could decrease particulate pollution (Wu et al,2017).Besides the Type Ⅱ sites, it can be found that there were high concentrations at Type Ⅲ sites.According to the China Mobile Source Environmental Management Annual Report (https://www.mee.gov.cn/hjzl/sthjzk/ydyhjgl/), trucks accounted for 11.2%of automobiles and they contributed to 77.9% of PM from the vehicle emissions in 2017.Generally, the grams per mile PM emission rate for each vehicle were the highest for the creep phase and lowest for the cruise phase (Shah et al, 2004).Thus, the promotion of fuel and the scrapping of outdated vehicles can effectively cut vehicle emissions (Zhang et al, 2014).Notably, at the three types of roadside sites, the concentration of PM10in TypeⅠwas the lowest and it was also comparable to the contrasting site, suggesting the effectiveness of the blocking and adsorption function of urban greenbelts for near-road particles caused by vehicles (Cai et al, 2017; Chaudhary and Rathore, 2018).Finally, the PM10concentrations were higher at near-road sites than those at the QS site due to the high traffic volume.So, the traffic management department should use scientific methods for routing vehicles to avoid traffic jams, such as taking the approach of staggered shifts in traffic transportation.
4 Conclusions
The pollution characteristics of PM10from 51 near-road sites and a contrasting site during the nonheating and heating periods in Jinan were investigated.The results showed that the average concentration of near-road PM10was 187.0 µg · m−3, 1.5 times of that at the contrasting site.In addition, during the heating period, the near-road PM10concentration was about 1.3 times of that in the non-heating period due to the increased coal consumption.During the nonheating period, at both roadside and QS sites, the trends of PM10were all on the rise with the highest concentrations on Saturday in contrast to the lowest concentration on Tuesday.In the city, all roadside sites might be divided into three types based on their surroundings.The highest PM10concentration was observed at Type Ⅱ site because of the influence of construction activities in addition to traffic emissions.In the weekly variation, the patterns exhibited the highest PM10levels on Saturday in contrast to the lowest concentration on Tuesday in the non-heating period.In the heating period, the highest concentrations happened on Thursday and the lowest concentrations occurred on Tuesday and Saturday.The diurnal variation exhibited the peaks at 06∶00/07∶00/08∶00 and 19∶00/20∶00 due to evident influences from the private cars emissions.In addition, the highest values were observed during rush hours in the morning and afternoon primarily from private automobiles, and at night from trucks due to the increased traffic volume, in contrast, the lowest concentration occurred in the afternoon with the favorable diffusion conditions.These results suggested that the control of coal consumption for heating, the use of water and covering material in construction activities, and the management of cars and trucks and the staggered shifts of vehicle volume may effectively reduce the near-road PM10concentration.The results of the risk assessment revealed that near-road PM10posed the greater health risk to children followed by adult.
猜你喜欢
肉类研究(2022年5期)2022-06-16
园林科技(2021年2期)2022-01-19
湖北科技学院学报(2021年4期)2021-09-24
戏曲研究(2021年3期)2021-06-05
动漫界·幼教365(中班)(2021年1期)2021-04-06
山东林业科技(2019年2期)2019-06-03
China Pictorial(2016年12期)2016-12-14
汽车与安全(2016年5期)2016-12-01
中国市场(2016年12期)2016-05-17
走向世界(2009年36期)2009-01-28