
Isolation, Identification, and Quantitative Determination of Saponin in Apostichopus japonicus by HPLC-DAD
2022-02-24 08:29LIUGuiyingWANGXudaGEKunWUJinhaoWANGZhaohuiDUJingSONGLunandZHOUZunchun
LIU Guiying, WANG Xuda, GE Kun, WU Jinhao, WANG Zhaohui, DU Jing,SONG Lun, and ZHOU Zunchun, *
Isolation, Identification, and Quantitative Determination of Saponin inby HPLC-DAD
LIU Guiying1), WANG Xuda1), GE Kun2), WU Jinhao1), WANG Zhaohui1), DU Jing1),SONG Lun1), and ZHOU Zunchun1), *
1),116023,2),116023,
is an important invertebrate that is widely used as a tonic food in Asian countries. The purpose of this study is to purify and identify a class of compound, the saponins, from the body wall of, and to establish a new me-thod to determine the quantity of saponins in the sea cucumber. In this study, the saponins of, cladoloside A (CA), were ob- tained from 80% ethanol extract by column chromatography for the first time and were characterized using the spectral method. The resulting purified saponins were then profiled using1HNMR,13CNMR, and ESI-MS, which revealed the CA molecular formula ofC53H82O2and contained a triterpenoid backbone, a methylglucopyranosyl moiety, a quinovopyranosyl, and two xylopyranosyls. A me- thod for the quantitative determination of CA, comprising microwave-assisted extraction, high-performance liquid chromatography, and diode array detector method, was established. Extraction efficiency was optimized by changing microwave power, extraction sol- vent, volume, time, and temperature. Results showed that under the optimum conditions (extraction time of 10min, temperature of 45℃, and solvent of 25mL 70% ethanol under 400W), the detection limit of CA was 0.0015mgmL−1, and the recoveries of CA from samples at spiking levels of 10, 20, and 50μgg−1ranged from 90.1%–104%. The proposed method was successfully applied to analyze the saponins in different tissues ofcollected in different seasons.The method developed in this study can provide quantitative technical support for the quality control of.
cladoloside A;;saponin;microwave-assisted extraction; HPLC-DAD
1 Introduction
Triterpene glycosides are important secondary metabo- lites that account for the poisonous features of sea cucum- ber(Liu.,2018). To date, over 150 sea cucumber sa- ponins have been reported (Yu.,2015; Xu., 2018), and new saponins with novel structures have been succes- sively identified (Liu.,2018). A variety of biological and pharmacological activities in some compounds have also been analyzed in previous studies. These studies havedemonstrated that sea cucumber saponins have many bene-ficial bioactive properties, including hemolytic, anti-inflam- matory, antibacterial, antifungal, antiviral, and antineoplas- ticactivities (Menchinskaya.,2013; Guillaume.,2016; Liu.,2018). Thus sea cucumber saponins are promising compounds for maintaining and improving hu- man health through multiple pathways (Zhang.,2013). Although various researches on the ingredients and effi- cacy ofhave been reported, stud- ies on the establishment of quantitative methods for thefood quality testing ofare limited (Zhang.,2013; Gao.,2014). Moreover, no quantitative methodhas been proposed for the quality control of thein the Chinese Pharmacopoeia. Thus, a rapid, sim- ple, and sensitive analytical method for the quantitative analysis ofsaponins is urgently required.
According to the previous studies, to analyze the com- ponents in complex matrices, a sample pretreatment proce-dure must be performed, with extraction as the first step. Microwave-assisted extraction (MAE), first proposed in 1986 (Ganzler., 1986), is an environmentally safe, high- ly efficient, and convenient extraction method (Menéndez., 2010; Zhang., 2013; Guo., 2015). It has been successfully used in extracting ginsenoside (Guo., 2015), nobiletin (Zhang., 2013), pulchinenoside (Yu., 2016), and so on. Thus, extracting sea cucumber sapo- nins using this promising method is worth of further ex- ploration.
In the current study, sea cucumber saponins were ex- tracted from.The structure of cladoloside A (CA) was identified by spectra analysis. The quantitative analysis method of the unique compound CA was estab- lished by MAE coupled with high-performance liquid chro- matography with a diode array detector (HPLC-DAD), in which the variablesincluding extraction solvent, micro- wave power, time, and temperature were respectively op- timized. The method has been proven to be useful for the saponin detection and quality evaluation of
2 Materials and Methods
2.1 Materials and Reagents
Freshsamples were collected from Jinzhou, China, in November 2018. The silica gel (200–300 mesh) was purchased from Qingdao Hailang Company (Qingdao, China). The pre-coated silica gel thin-layer chromatogra- phy (TLC) plates were purchased from Merck (Darmstadt, Germany). HPLC-grade acetonitrile and methanol were pur-chased from Fisher Scientific (Pittsburgh, USA). Other ana- lytical grade reagents, including chloroform and ethanol, were purchased from Kemiou Chemical Reagent Company (Tianjin, China). Water was deionized through a Milli-Q water purification system (Millipore, USA) for preparing samples and mobile solutions. Octadecyl functionalized si- lica gel from Agela Technology Company (Tianjin, China) was used for column chromatography. AB-8 macroporousabsorption resin from Guangfu Technology Company (Tian- jin, China) was employed for column chromatography.
2.2 Compound Extraction and Isolation
First, 6kg of frozenwere crushed complete- ly. Then, they were extracted under heating and refluxingwith 80% ethanol three times. The extracts were combined and placed inside an AB-8 macroporousabsorption resin column by eluting with water in order to remove impuri- ties,after which they were eluted again with 80% ethanol. The eluates were collected and evaporated under vacuum to obtain the crude saponin fraction (10g), which was then subjected to normal-phase silica gel column chromatogra- phy (CHCl3:CH3OH:H2O (10:1:0.1, 9:1:0.1, 4.5:1:0.1, 4:1:0.1, 3:1:0.1, 2:1:0.1, 1:1:0.1)) to obtain seven frac- tions. A mixture of chloroform and methanol was used as the mobile phase to separate all the fractions. Next, the fractions with the same TLC profiles were combined and concentrated for subsequent separation on the reversed- phase silica gel column chromatography. Fraction 3 (1g) was separated with CH3OH:H2O (3:1, 2:1, 1:1) to yieldcompound 1 (16.8mg) by reversed-phase silica gel column chromatography.
2.3 Spectral Analysis
An isolated compound was subjected to an ultraviolet spectrometer (Puxi UV-1950, Beijing, China) and DAD to check their UV absorption wavelengths. Dimethyl sul- foxide-d6 (DMSO-d6,Sigma-Aldrich, New Zealand) was used as the nuclear magnetic resonance (NMR) solvent to dissolve the compound. The NMR spectra were recorded on a Bruker AVANCE III 400 instrument at 400MHz for1H and 125MHz for13C using standard pulse programs and acquisition parameters. Chemical shifts were reported with δ (ppm) referencing to the NMR solvent DMSO-d6.The MS spectra were obtained by infusing the sample into the Waters mass spectrometer(Waters Xevo, USA) in ne- gative ion mode.
2.4 Quantification of the Isolated Compound
2.4.1 Preparation of standard solutions
CA isolated fromwas used as a reference standard for their quantification. CA was dissolved into acetonitrile at a concentration of 2.000mgmL−1for stock standard solution, which was stored at 4℃. The calibrationworking solutions were freshly obtained during the experi- ment.
2.4.2 Chromatographic conditions
An Agilent 1100 series HPLC system (Agilent Corpo- ration, USA) was applied for the quantification analysis, consisting of a DAD, a low pressure squat pump, an on- line degasser, a thermostat column compartment, and an au- tomatic sample injector. The Agilent positive-phase Zor- bax® SB-CN column (250mm×4.6mm, 5μm) was used foranalyzing the target, and the column temperature was main- tained at 30℃. The mobile phase consisted of water (A) and acetonitrile (B), and its gradient elution sequence was as follows: 0–5min, 30% B; 5–30min, 50% B; and 30–35min, 30% B. The flow rate was set at 1.0mLmin−1. The de- tection wavelength was 205nm, and the injection volume was set to 10µL. The external calibration curves were used for the quantification of the compound. The Agilent Chem- Station software (Agilent Corporation, USA) was used for acquisition and data analyses.
2.4.3 Sample preparation for quantification
The saponins fromwere extracted from a CEM MARS6TM microwave extraction system equipped with 16 Teflon vessels (CEM Corporation, USA). About 2g ofbody wall tissues were added to the microwave extraction vessel with 70% ethanol (25mL). Each vessel was closed up and shaken quickly for several seconds. These vessels were placed inside the microwave extraction system. The microwave power, temperature, and time were set at 400W, 45℃ and 10min, respectively. Af- ter extraction, the vessels were taken out and cooled down to room temperature, after which the extracts were filter- ed using a funnel. The folded filter paper (aperture 30–50µm) was placed inside the funnel. The residue and thefunnel were washed with 5mL ethanol every time and the solution was collected together in a flask. Subsequently, the collected solution was distilled to dry at low pressure using a rotary evaporator at 50℃. About 10mL of distilled water was added to the residues in the flask, and the re- sulting solution was passed through an Oasis HLB solid phase extraction column (Waters, 500mg), which hadpre- viously been activated with 5mL methanol and 5mLwa- ter successively. The column was washed with 5mL 10%methanol aqueous solution, after which the target objects were eluted with 5mL methanol, and the eluents were col- lected and evaporated to a volume of 1mL using a gentle stream of nitrogen. The solution was filtered through a 0.22µm membrane (MicroAnalytix, New Zealand) and taken for HPLC analysis.
2.5 Validation of HPLC Method
An acetonitrile stock solution containing CA was pre- pared and diluted to appropriate concentration ranges for the establishment of calibration curves. Six different con- centrations of the analytes were injected in triplicate, and the concentrations were0.005, 0.015, 0.05, 0.15, 0.5, and 1.0mgmL−1, respectively. The limit of detection (LOD) and limit of quantitation (LOQ) were determined, which were described through the concentrations with peak heights of 3- and 10-times of the baseline noise, respectively. Accu- racy was determined by spiking the sample with different concentrations of the standards before extraction. The re- covery rate was expressed by comparing it with the calcu- lated and theoretical concentrations. Precision was exam- ined by inter-day and intra-day precision. Inter-day preci- sion was expressed by analyzing six individually prepared sample solutions on the same day. Intra-day precision was checked by comparing the results of analyses performed on two different days. The variations within one day and within three days were calculated based on peak areas.
3 Results and Discussion
3.1 The Structure Elucidation of Compound
Compound 1 consisted of white amorphous powder. The compound showed red spots through TLC. The λmaxwas 205nm, as determined by HPLC-DAD. The molecular ion [M-H]−at m/z 1053.63 amu shown in the ESI-MS spec- trum indicated that the molecular formula of compound 1 was C53H82O2. The1HNMR,13CNMR, and distortionlessenhancement by polarization transfer spectra indicated that compound 1 was composed of the triterpenoid backbone, a methylglucopyranosyl moiety, a quinovopyranosyl, and two xylopyranosyls (Table 1). Meanwhile, the13CNMR spectra displayed 53 carbon signals, of which 8 were as- signed to the methyls, 13 to the methylenes, 25 to the me- thines, and the remaining 7 to the quaternary carbons. The carbon signals displayed two carbonyl carbons at δC213.6and δC175.97. The carbon signals displayed two C=C double bonds at δC150.73, δC145.39, δC110.75, and δC129.89. In accordance with the literature(Avilov and Sto-nik, 1988; Xue, 2010; Alexandra, 2014), the proton and carbon signals of compound 1 in the1H NMR and13C NMR spectra were similar to those of CA. The structure of the compound is shown in Fig.1. The com- pound was referred to CA, which was the first time to be extracted from. The yield of CA was 0.028‰.
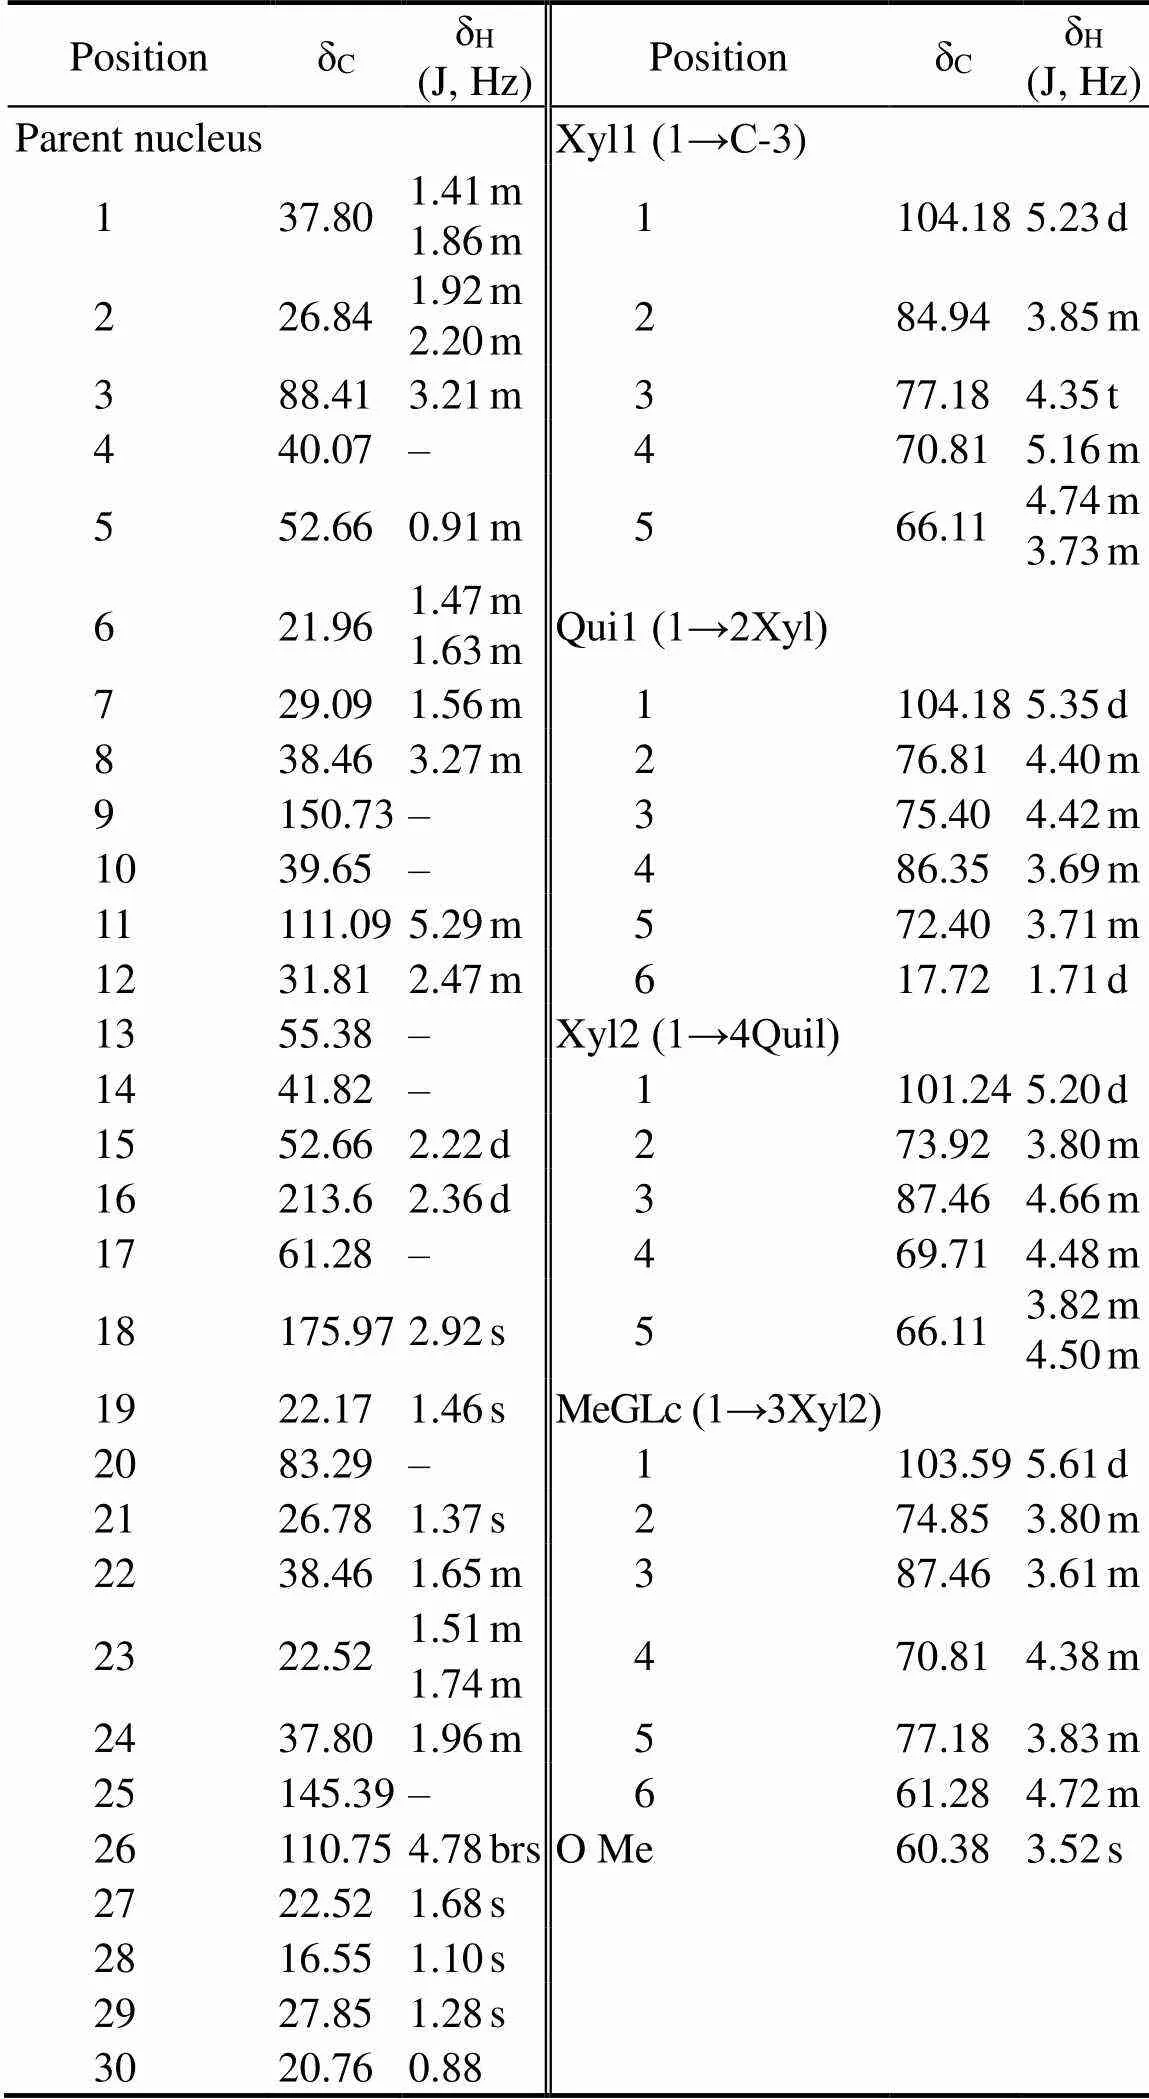
Table 1 13C NMR and 1H NMR chemical shifts for cladoloside A (CA) in DMSO-d6
Notes: J, coupling constant; s, single peak; d, double peaks; m, mul- tiple peaks; bs, broad single peak; t, triplet peaks; ‘–’, not available.

Fig.1 The structure of cladoloside A (CA).
3.2 Optimization of MAE Conditions
In the study, ethanol was selected for the extraction of saponins in. The optimal concentration of etha- nol was investigated by comparing the effects of different concentrations in the range of 60%–90% (v/v). From Fig.2, 70% (v/v) ethanol was the best extraction solvent. As the maximum volume of the microwave extraction vessel was 30mL, in order to acquire the best extraction efficiency, the 70% ethanol volumes in the range of 10–30mL were further investigated, as shown in Fig.3. When the extrac- tion volume was 25mL, the yield of CA was the highest.
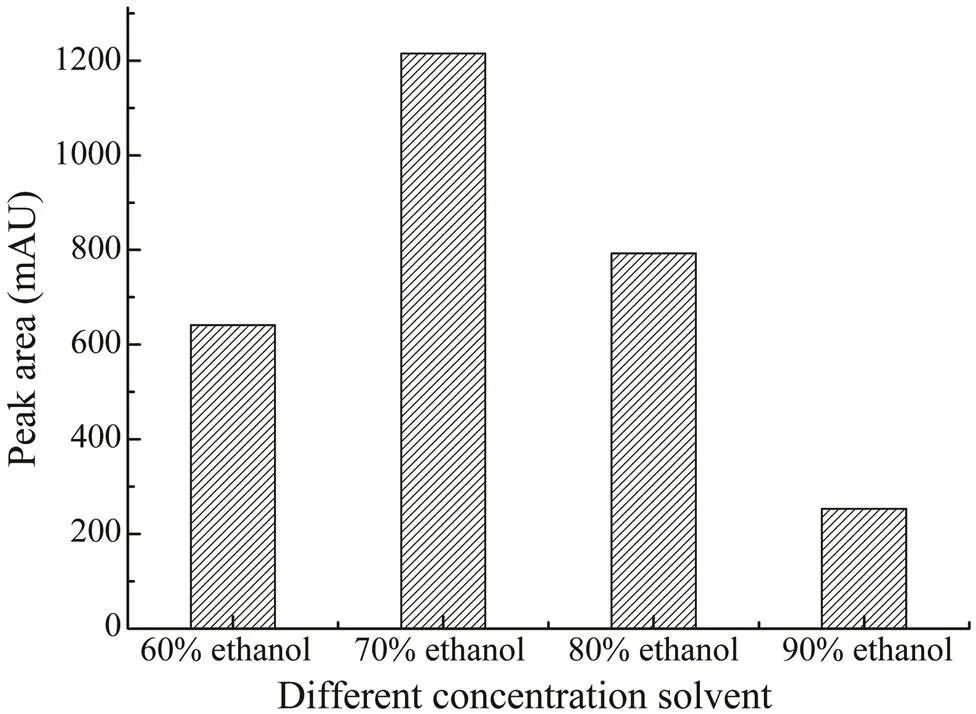
Fig.2 The effects of different concentrations of ethanol (60%–90%) on the extraction yields of CA.
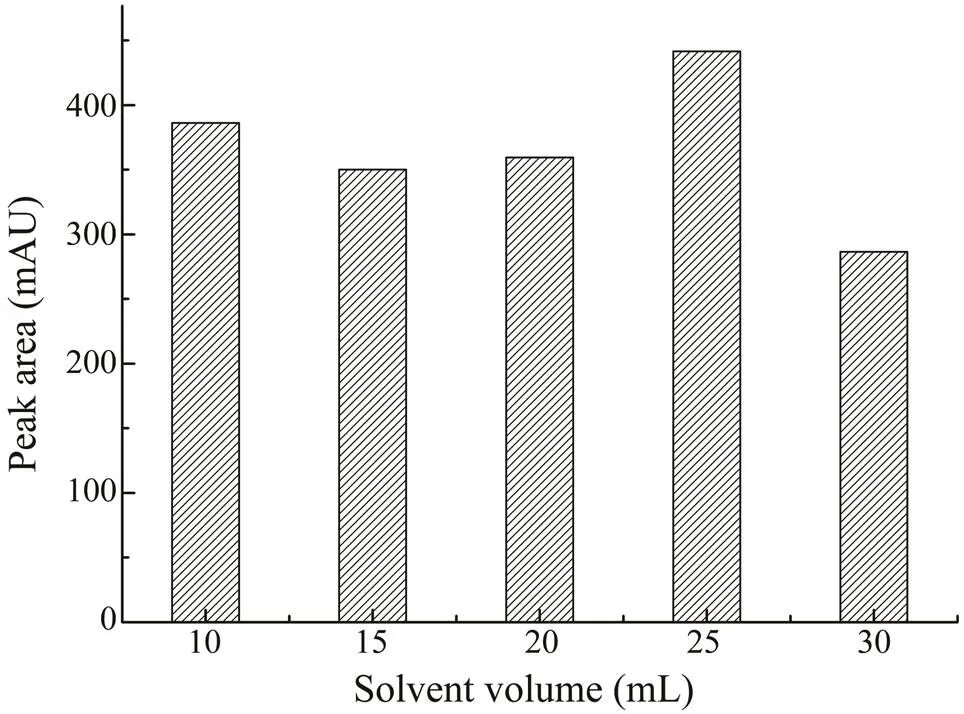
Fig.3 The effects of different extraction solvent volumes (10–30mL) on the extraction yields of CA.
To monitor the effect of irradiation time, samples were extracted with 70% (v/v) ethanol for 5, 10, 15, 20, and 25min. As shown in Fig.4, the maximum extraction yield was obtained at 10min and set as the optimal time for MAE.The temperature was also an important factor in MAE. Weoptimized the temperature byperforming extractions at 35,45, 55, 65, 75, and 85℃. As shown in Fig.5, in the begin-ning, when the heating temperatureswere set from 35℃ to 45℃, the extraction rate of CA increased as well. When the temperature rose to 55℃, the CA yield started to de- crease. At a higher temperature, the solvent could be rapid-ly absorbed by the cellular matrix, which can cause cell wall rupture quickly, increasing the release of components into the solvent, causing a higher extraction rate. In com- parison, as the temperature exceeds a certain point, it will cause the degradation of thermolabile compounds. Thus, the contents of CA might decrease if the temperatureis too high. Considering the results,45℃ was the best heating con- dition for extraction.
Finally, the effect of microwave power on extraction ef- ficiency was also investigated. The microwave power was set to 400, 800, and 1600W. With the same conditions, it can be clearly observed that the sample was destroyed whenmicrowave power was set to 800 or 1600W. This is be- cause the higher microwave power increases the tempera- ture inside the microwave, which may result in the destruc-tion of cells, eventually reducing the yield. Thus, the micro- wave power of 400W was selected as the optimal condition.
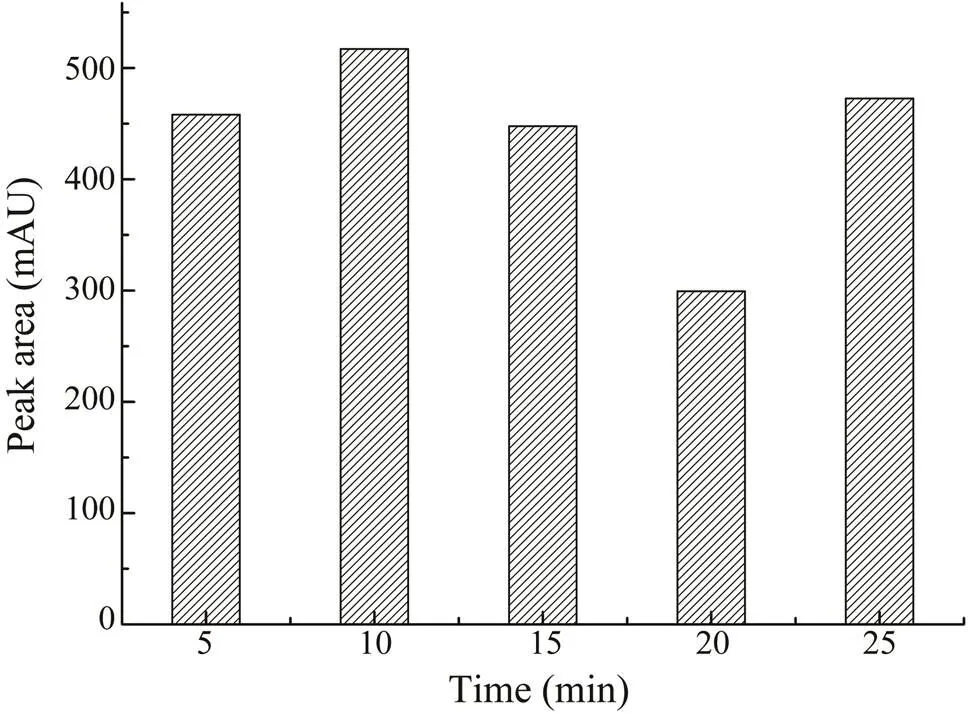
Fig.4 The effects of different extraction times (5–25min) on the extraction yield of CA.
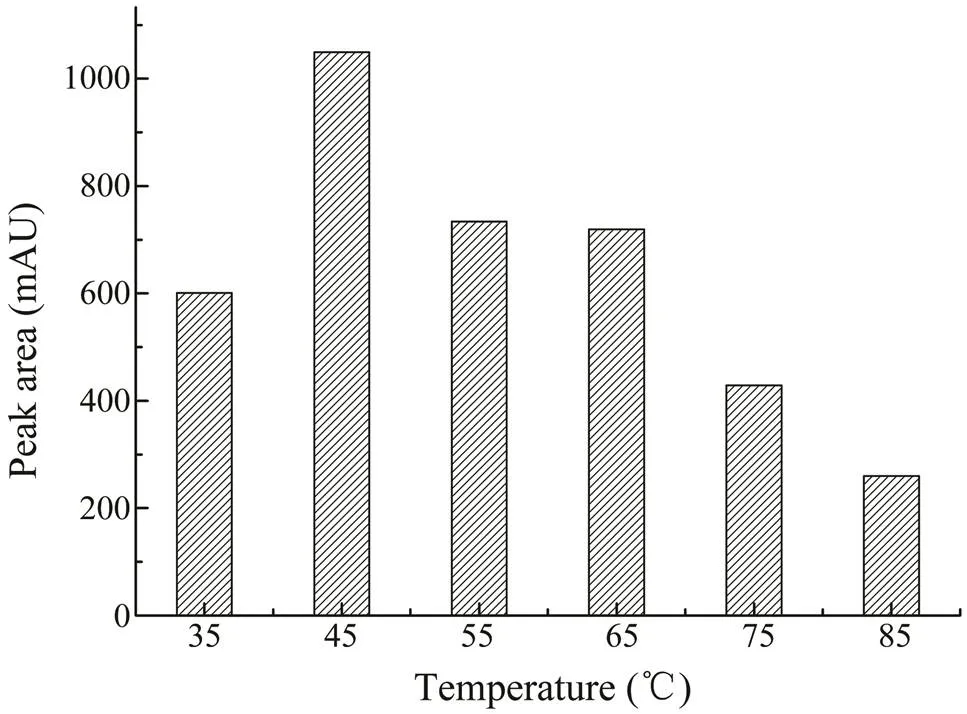
Fig.5 The effects of different irradiation temperatures (35–85℃) on the extraction yield of CA.
3.3 Method Validations
Fig.6 shows the chromatographic separation result of CAby HPLC-DAD. Good linearity of the CA was obtained in a relatively wide concentration. The correlation coefficient was 0.9990, and the standard calibration curve equation was=1264+2.917. The inter-day and intra-day preci- sion rates were 2.5% and 3.2%, respectively. The LOD and LOQ were 0.0015 and 0.005mgmL−1, respectively.
Three level spiked samples (10, 20, and 50μgg−1) were selected for continuous injection five times. The average recovery rates were 90.1%, 92.2%, and 104%, and the pre- cision rates were 4.5%, 2.3%, and 2.5%, respectively, for the three samples. The verification results showed that the developed method could provide good accuracy and high sensitivity for CA analysis.
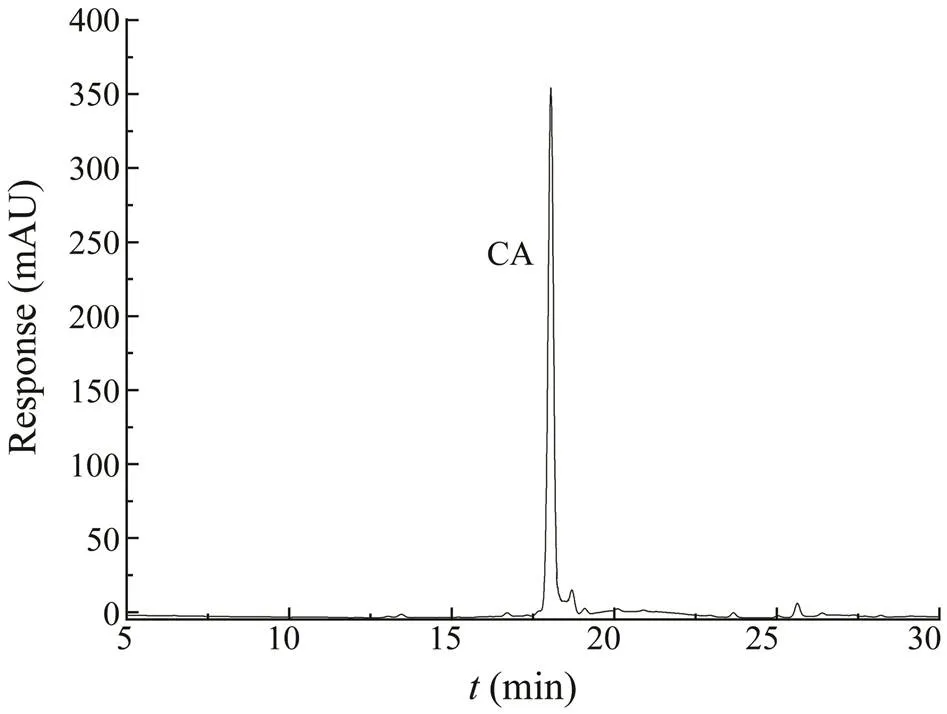
Fig.6 The HPLC-DAD chromatogram of CA.
3.4 Application of the Developed Method
To determine the CA, the described method was applied on different tissues of. The analytical results are shown in Table 2. As can be observed from Table 2, the concentration of the CA was the highest in parapodium. The concentration sequence of the CA was as follows: pa- rapodium>muscle>body wall>viscera>coelomic fluid.Sea cucumber saponins are generally considered as a che- mical defense against predators, the distribution of which may relate to defensiveness (Magali., 2015). Accord- ing to the previous studies(Van., 2011; Magali., 2015), sea cucumber may release saponins into the seawa- ter from the skin or from interior organs when subjected to stress. This phenomenon may explain why CA has dif- ferent concentrations in different parts of the body. CA is a non-sulfate saponin with poor water solubility and low toxicity. The saponins could slowly diffuse into the water due to the absence of sulfate and hydroxyl groups; thus, they take longer to reach the predator (Magali., 2015). When parapodium is exposed outside the skin, the concen- trations may be higher.

Table 2 CA concentrations in different parts of A. japonicus
The contents of CA in the sea cucumber from different harvesting seasons were determined using the described method. The CA concentrations were 46.3μgg−1in April and 22.5μgg−1in November. From the data, we can see that the CA content was higher in April.
In a summery, the saponin CA was first extracted fromin this studyColumn chromatography wasperformed for the purification of the compounds from 80% ethanol extract. The structure was identified based on spec- troscopic methods and literature references. CA has beenisolated from the Vietnamese sea cucumberin 2014(Alexandra., 2014). Alexandra.(2014) studied the cytotoxic activity of CA on mouse spleen cells and hemolytic activity on mouse red blood cells, and the results showed strong cytotoxicity and hemolysis. Whe- ther CA isolated fromhas the same function needs further study in the near future.
4 Conclusions
In this study,a rapid and simple method based on MAE followed by HPLC-DAD was performed for the first time for the quantitative determination of CA insamples. MAE, with relative high extraction efficiency, re- duced extraction solvent and short sample preparation timewas found to be a suitable technique to extract saponins fromfor quantitative determination.The optimal MAE conditions were as follows: extraction time of 10min,temperature of 45℃, and solvent volume of 25mL 70% ethanol under 400W. In addition, low limits of determina- tion and quantification, precision, and satisfactory reco- veries were obtained with the proposed method. The pro- posed method was successfully applied to analyze the sa- ponin CA in different tissues ofThe study of the proposed method provided quantitative technical sup- port for the quality control of. Furthermore,it could be an auxiliary analysis method for elucidating the molecular mechanism of pharmacological effects of sapo- nins.
Acknowledgements
This study was supported by the National Key R&D Program of China (No. 2018YFD0900105),the Entrepre- neurship Program for High-Level Talent of Dalian(No.2018RD10), the Liaoning Revitalization Talents Program(No. XLYC1907109), and the Liaoning Key Research and Development Program (No. 2018228004).
Alexandra, S. S., Anatoly, I. K., Sergey, A. A., Pelageya, V. A., Pavel, S. D., Ekaterina, A. Y.,., 2014. Triterpene glyco- sides from the sea cucumber. II. Struc- ture and biological action of cladolosides A1–A6., 9 (10): 1421-1428.
Avilov, S. A., and Stonik, V. A., 1988. New triterpenen glyco- sides from the holothuriansp., 24 (5): 656, DOI: 10.1007/BF00633413.
Ganzler, K., Salgó, A., and Valkó, K., 1986.Microwave extrac- tion, a novel sample preparation method for chromatography.,371: 299-306, DOI: 10.1016 /S0021-9673(01)94714-4.
Gao, Z. Y., Wang, R., Guo, F. J., Jia, Q., and Li, Y. M., 2014. Determination total saponin content in sea cucumbers., 20 (15): 89-92 (in Chinese with English abstract).
Guillaume, C., Karim, M., Dina, L. S., Corentin, D., Marie, D., Igor, E.,., 2016. Chemical characterization of saponins contained in the body wall and the Cuvierian tubules of the sea cucumber(Delle Chiaje, 1823)., 68: 119-127, DOI: 10.1016/j.bse.2016.06.005.
Guo, S. S., Yang, L. M., Zhang, Y. M., Yang, L., and Han, M., 2015.Determination of contents of total saponins and mono- mer saponins inby micro-assisted extraction me- thod., 36 (2): 1-6, DOI: 10.1007/s11783-011- 0280-z.
Liu, H. L., Kong, X., Chen, J. W., and Zhang, H. B., 2018.sequencing and transcriptome analysis ofto reveal genes related to biosynthesis of triterpenoids., 491: 358-367, DOI: 10.1016/j.aquaculture.01.012.
Magali, H. E., Roberto, A. E., Francisco, A. S., and Yves, S., 2015. Biological and taxonomic perspective of triterpenoid glyco- sides of sea cucumbers of the family Holothuriidae (Echino- dermata, Holothuroidea)., 180: 16-39, DOI: 10.1016/j.cbpb.2014.09.007.
Menchinskaya, E. S., Pislyagin, E. A., Kovalchyk, S. N., Davydo- va, V. N., Silchenko, A. S., Avilov, S. A.,., 2013. Antitu- mor activity of cucumarioside A2-2., 59: 181- 191, DOI: 10.1159/000354156.
Menéndez, J., Arenillas, A., Fidalgo, B., Fernández, Y., Zubizar-reta, L., Calvo, E. G.,., 2010. Microwave heating process- es involving carbon materials., 91: 1-8, DOI: 10.1016/j.fuproc.2009.08.021.
Van, D. S., Caulier, G., Todesco, M., Gerbaux, P., Fournier, I., Wisztorski, M.,., 2011. The triterpenoid glycosides of, usefulness and efficiency as achemical de- fense mechanism against predatory fish.,214: 1347-1356, DOI: 10.1242/jeb.050930.
Xu, C., Zhang, R., and Wen, Z. Z.,2018. Bioactive compounds and biological functions of sea cucumbers as potential func- tional foods., 49: 73-84, DOI: 10. 1016/j.jff.2018.08.009.
Xue, C. H., Yu, L. F., Dong, P., Xu, J., Li, Z. J., and Xue, Y.,2010. Isolation and identification of three triterpene glycosides from sea cucumberSelenkaof Qingdao., 40 (8): 60-65 (in Chi- nese with English abstract).
Yu, S., Gao, J., Hao, J. W., and He, T. T., 2016. Study on ultraso- nic-assisted extraction oftotal saponin by response surface methodology., 55 (20): 5348-5351 (in Chinese with English abstract).
Yu, S. R., Ye, X. W., Huang, H. C., Peng, R., Su, Z. H., Lian, X. Y.,., 2015. Bioactive sulfated saponins from sea cucumber., 81: 152-159, DOI: 10.1055/ s-0034-1383404.
Zhang, R., Wang, Y. H., Liu, Y. F., Yang, J., Jiang, T. F., and Lv, Z. H., 2013. Isolation, preparation and analysis of triterpene glycoside Holotoxin A1in, 4 (8): 8-14 (in Chinese with English abstract).
Zhang, Y., Li, H. J., Dou, H. T., He, Z. F., Wu, H. J., Sun, Z. G.,., 2013. Optimization of nobiletin extraction assisted by microwave from orange byproduct using response surface me- thodology., 22: 153-159, DOI: 10.1007/s10068-013-0061-5.
November 25, 2020;
February 3, 2021;
June 1, 2021
© Ocean University of China, Science Press and Springer-Verlag GmbH Germany 2022
. E-mail: zunchunz@hotmail.com
(Edited by Qiu Yantao)
 Journal of Ocean University of China2022年2期
- Journal of Ocean University of China的其它文章
- Study of the Wind Conditions in the South China Sea and Its Adjacent Sea Area
- A Spatiotemporal Interactive Processing Bias Correction Method for Operational Ocean Wave Forecasts
- Characteristics Analysis and Risk Assessment of Extreme Water Levels Based on 60-Year Observation Data in Xiamen, China
- Underwater Target Detection Based on Reinforcement Learning and Ant Colony Optimization
- Polar Sea Ice Identification and Classification Based on HY-2A/SCAT Data
- Thermo-Rheological Structure and Passive Continental Margin Rifting in the Qiongdongnan Basin,South China Sea, China