
Solution Blowing of Palygorskite-Based Nanofibers for Methylene Blue Adsorption
2023-01-11 03:14LIUChangMAYouwei马友伟GUOYingWANGXueming王学明SHILeiLILeiZHUANGXupin庄旭品
LIU Chang(刘 畅), MA Youwei(马友伟), GUO Ying(郭 莹), WANG Xueming(王学明), SHI Lei (石 磊) , LI Lei (李 磊)*, ZHUANG Xupin(庄旭品)*
1 State Key Laboratory of Separation Membranes and Membrane Processes, Tiangong University, Tianjin 300387, China2 School of Textile Science and Engineering, Tiangong University, Tianjin 300387, China3 School of Chemistry and Chemical Engineering, State Key Laboratory for Metal Matrix Composite Materials, Shanghai Key Lab of Electrical Insulation & Thermal Aging, Shanghai Jiao Tong University, Shanghai 200240, China
Abstract: Palygorskite (PG) adsorbent with superior adsorption property and ion-exchange ability is highly desired in the field of dye removal. However, it generates high amounts of precipitation due to the granular form, resulting in secondary pollution after adsorption. Herein, the novel high porosity PG-based nanofibers that are easy for operating and retrieving have been fabricated using effective solution blowing and subsequent calcination. The obtained highly efficient adsorption nanofibers exhibit large specific surface area about 170.50 m2/g with average diameter from 243 nm to 365 nm. Based on the abovementioned nanofibrous structure and negatively charged PG, the solution blowing of PG-based nanofibers (SBPNs) showed high adsorption capacity for methylene blue (MB) (112.36 mg/g). In addition, the adsorption of SBPNs is well described by the Langmuir isotherm model. This work provides new SBPNs forming process for the fields of dye removal, which may achieve the production of PG adsorbents at the industrial level.
Key words: palygorskite (PG); nanofiber; solution blowing; calcination; adsorption; methylene blue (MB)
Introduction
Dyes are widely used in daily life and various industries. At present, more than 100 000 kinds of synthetic dyes are being used throughout the world and their production reaches 7×10⁷t/a[1]. However, dyes are degraded slowly in nature due to their highly toxic, mutagenic and carcinogenic, posing a serious threat to human health and the environment[2-4]. Recently, as a low-cost and easy-to-operate technology, adsorption has an excellent effect on removing dyes from bodies of water, which has caught public attention.
With the development of adsorption techniques, more advanced adsorbents have played an increasingly important role in water remediation, such as activated carbon[5], natural minerals or clay[6], natural biomass[7], and inorganic adsorbents[8]. Among them, palygorskite (PG) is a magnesium-rich clay mineral that is highly abundant, especially in China. It has superior adsorption property and can remove dyes from wastewater due to its ion-exchange ability[9]. Furthermore, PG is negatively charged due to the absence and substitution of central cations inside its lattice and thus adsorbs cationic dyes easily by electrostatic interaction[10-11]. However, it generates high amounts of precipitation due to its granular form, resulting in a secondary pollution after adsorption[12].
Recent studies suggest that nanofibers enhance adsorption performance due to their high porosities, micropores and large specific surface areas[13-15]. Compared with nanoparticles, the nanofibrous structures make them easier to operate and recycle after usage. Thus, nanofibers are generally exploited as highly efficient carriers of adsorbents, such as montmorillonite[16], diethylenetriamine[13], and iron oxide[17]. In recent years, various techniques, such as electrospinning[18], supramolecular self-assembly[19], melt-blown[20]and solution blowing[21], have been used to fabricate nanofibers. Among them, the solution blowing process has attracted considerable attention due to the high efficiency in large-scale nanofibers production. In the above techniques, polymer nanofibers are fabricated through high-speed gas flows, which are used as fiber-formation driving forces. For instance, Kolbasovetal.[22]prepared series of biopolymer nanofibers by solution blowing to remove heavy metals from water. The solution blowing soy protein nanofibers could be scaled up to the industrial level[23]. Meanwhile, our group successfully fabricated activated carbon nanofibers by subjecting polyacrylonitrile (PAN) to solution blowing and then to calcinaion. The obtained nanofibers showed extremely high adsorption capacities[5].
In the present work, PG-based nanofibers were fabricated through solution blowing for the first time. PG and PAN were subjected to solution blowing and the followed calcination process. PAN was used as an assistant fiber-forming polymer to prepare nanofibers containing PG. The obtained composite nanofibers were then calcined into PG-based nanofibers in the air. The structural changes and morphological evolutions of the fibers were discussed. Lastly, methylene blue (MB), a common cationic compound, served as a model dye to study the adsorption behavior of the nanofibers under different conditions.
1 Experiments
1.1 Materials
Natural PG powder was obtained from Dingbang Mineral Technology Co., Ltd. (Xuzhou, China) and sieved through a 600 mesh (23 μm). PAN (Mw: 38 000 g/mol) was purchased from Toray Industries Co., Ltd. (Shenzhen, China). MB was acquired from Beina Chuanglian Biotechnology Research Institute (Beijing, China). Dimethylformamide (DMF), sodium hydroxide pellets (NaOH), and hydrochloric acid (HCl) were purchased from Tianjin Guangfu Regent Company (Tianjin, China). All the reagents used were of analytical grade without further modification. Only distilled water was used to prepare the solutions.
1.2 Preparation of solution blowing PG-based nanofibers (SBPNs)
PAN and PG nanofibers were firstly prepared via solution blowing. The procedure was as follows: 60 g PG was mechanically dispersed in 500 mL of PAN solution (12% by weight percent) to form a spinning solution, and fed into the mold. Then the polymer solution was attenuated into superfine filaments by high velocity air at 0.32 MPa. The nanofibers were collected on a nylon net and intertwined to form a nonwoven mat. The schemata of the solution blowing process can be seen in our previous work[24]. The solution-blowing nanofiber mats were calcined in a program-controlled furnace (Tianjin Zhonghuan Furnace Co., Ltd., Tianjin, China) at a series of temperatures (300, 400, 500, and 600 ℃) for 4 h in the presence of air to obtain SBPNs. The samples were first heated from ambient temperatures to 250 ℃ at a rate of 2 ℃/min to stabilize the fiber structures and then the rate of increase was set to 4 ℃/min until the desired temperature. The samples were labeled as SBPNs-Ta, where Ta represents the calcination temperature.
1.3 Characterization
The morphologies and microstructures of the fibers were observed by field emission scanning electron microscopy (FE-SEM, S-4800, Hitachi Co., Japan) and further characterized by transmission electron microscopy (TEM, JEM-2100, JEOL, Japan). X-ray diffraction (XRD) data were obtained using an X-ray diffractometer (D8 Discover with GADDS, BRUKER AXS, USA) with Cu-Kαradiation (40 kV, 150 mA) from 5° to 80°. The molecular changes in the fibers were recorded by Fourier transform infrared spectroscopy (FTIR, Nicolet 6700, Thermo Nicolet Corporation, USA). A thermogravimetric analyzer (TG) furnished with differential thermal analysis (DTA, NETZSCH STA 409, Germany) was used to investigate the thermal properties of the samples in ambient air at a heating rate of 10 ℃/min. The specific surface areas and pore volumes of the samples were determined by a N2adsorption isotherm with a micropore physisorption analyzer (ASAP 2020, Micromeritics corporation, USA) combined with Brunauer-Emmett-Teller (BET) and Barret-Joyner-Halenda (BJH) models.
1.4 Adsorption studies of MB
A series of adsorption experiments were performed to evaluate the adsorption properties of the SBPNs. For the adsorption isotherm studies, a set of different initial concentrations of MB solutions in the range of 20-100 mg/L was prepared through a typical procedure. After that, the fixed quality of 20 mg SBPNs was added to 25 mL of each obtained MB solution. The resulting solutions were then placed into an air bath shock machine (SHZ-82, Jintan Machine Co., Ltd., Shanghai, China) at a shaking rate of 150 r/min and under a constant temperature of 25 ℃ for 24 h to achieve adsorption equilibrium. Subsequently, the upper liquids of the solutions were fetched out. The absorbances of these liquids at 664.5 nm were obtained using a UV-VIS spectrophotometer (UV-1800, Shanghai MAPADA Instrument Co., Ltd., Shanghai, China). The concentrations before and after the adsorption process were determined by applying absorbance into a standard calibration curve function, which was constructed by measuring the absorbance of a set of known MB concentrations. For the calculation of the maximum adsorption capacity of the adsorbent, the above testing data were fitted to the Langmuir model by
Ce/qe=1/kLqm+Ce/qm,
(1)
whereCeis the equilibrium solution concentration after adsorption(mg/L),kLis Langmuir constant related to the energy of adsorption(L/mg), andqmis the maximum adsorption capacity(mg/g). The amount adsorbedqe(mg/g) can be confirmed by
qe=((C0-Ce)V)/m,
(2)
whereC0(mg/L),V(L), andm(g) represent the initial concentration, volume of MB solutions and mass of SBPNs, respectively.
To determine which model had the best performance in analyzing the testing data, the Freundlich model was also used. Its function is
lnqe=lnKc+(1/n)lnCe,
(3)
whereKcis the constant for the Freundlich isotherm which roughly expresses the adsorption capacity of the adsorbent, andnis the Freundlich exponent which indicates the adsorption intensity. Furthermore, the effects of the calcination temperature, initial solution concentration, pH on adsorption capacity were also examined through adsorption experiments.
2 Results and Discussion
2.1 Fabrication of SBPNs
With PAN as an assistant polymer, the formation of solution jets and fibers in the spinning process was evident. The formed nanofibers are shown in Fig.1. The as-spun fibers entangled together into a fibrous membrane with the diameter from 270 nm to 520 nm.

Fig.1 SEM image of SBPNs
TG and DTG were conducted to analyze the thermal decomposition characteristics of the SBPNs, as shown in Fig.2. The TG profile for the PG powder demonstrated that the weight loss of PG mainly contained four processes corresponding to four dehydration steps, the removal of hygroscopic and zeolitic water (below 278 ℃), coordinated water (304-479 ℃), water-hydroxyl groups water (479-663 ℃), and the cleavage of the Si—OH (above 663 ℃) in sequence[25]. However, the total weight loss fraction of PG was 18.4% when the temperature rose up to 695 ℃. Meanwhile, the TG curve of PAN clearly showed that its weight loss was divided into three stages: evaporation of volatiles before 300 ℃, cyclization of cyano groups at about 309 ℃, and oxidation and cracking of the backbone between 313 ℃ and 695 ℃[26]. Therefore, when the mass changes of PAN were combined with those of PG, the decomposition of the SBPNs involved a premier weight loss before 335 ℃ because of the volatilization of their components with low boiling point. The sharp exotherm peak at about 324 ℃ was due to the cyclization reaction in the cyano groups. Another weight loss in SBPNs from 335 ℃ to 664 ℃ was ascribed to the breakage of chemical bonds, such as C—C, Si—OH bonding. The results indicated that the SBPNs had better thermal stability than that of PAN alone[27], which ensured the integrity of SBPNs after high-temperature calcination. SBPNs were selected to calcine at 300, 400, 500 and 600 ℃ for the fabrication of corresponding nanofibers.

Fig.2 TG thermograms of PAN, PG, SBPNs and DTG pattern for SBPNs
After calcination, the SBPNs gradually became rough on surface and tangled together into nanofibrous network, as shown in Fig.3. Moreover, the average diameters of SBPNs (365 nm) were visibly attenuated to 355, 310, 255 and 243 nm under different calcination temperatures, which were named SBPNs-T300, SBPNs-T400, SBPNs-T500, and SBPNs-T600, respectively. Furthermore, the SBPNs-T600 was nearly composed of large amounts of orientated PG rods, revealing that the PG nanorods dissolved in the polymer solution were aligned when being ejected through the spinneret. These features were also observed in TEM images of the SBPNs-T400 and SBPNs-T600 (Figs. 3(e)-3(f)).

Fig.3 SEM images of (a) SBPNs-T300, (b) SBPNs-T400, (c) SBPNs-T500, (d) SBPNs-T600; TEM images of (e) SBPNs-T400 and (f)SBPNs-T600
2.2 Structural studies of SBPNs
The XRD patterns for the SBPNs revealed their microstructures and crystal structure changes. As shown in Fig.4, the characteristic diffraction peaks of PG at 8.4°, 13.9°, 19.8° and 27.6° changed uniformly at increased calcined temperature. The intensity of these peaks got a slight increase when calcination temperature increased from ambient temperature to 300 ℃, and then a more pronounced enhancement was observed when the calcination temperature rose to 400 ℃[28]. Thus, the relative content of PG in the sample was enhanced, exposing PG to air and subsequently increasing adsorption sites. Simultaneously, the diffraction peaks of quartz (26.7°) and dolomite (31.0°) at a low content became sharp and thus were consistent with the variation in PG. When further heated to 500 ℃ and 600 ℃, the peak intensities of PG distinctly decreased in that ribbon-layer structure and lattice of PG were partially destroyed in the removal process of crystal water and hydroxyl[29]. In case of PAN, the peak intensity of PAN (16.7°) heated at 300 ℃ remarkably increased, indicating that the molecular chains of the amorphous region of PAN gradually moved at higher temperatures to form quasi-crystalline structures[30-31]. After being calcined at 400 ℃, the diffraction peak around 22.0° became broad, and a new peak at 42.6° appeared, implying the appearance of amorphous carbon materials[32]. As the temperature rose to 500 ℃, the characteristic peaks of carbon got blunt and then disappeared when the temperature was further increased to 600 ℃. This finding proved that carbon content diminished due to its oxidation.

P—PG; Q—quartz; D—dolomite.Fig.4 XRD patterns of SBPNs, SBPNs-T300, SBPNs-T400, SBPNs-T500, and SBPNs-T600


Fig.5 FTIR spectra of SBPNs, SBPNs-T300, SBPNs-T400, SBPNs-T500, and SBPNs-T600
2.3 Surface area and pore structure
The N2adsorption-desorption isotherms of SBPNs (shown in Fig.6) showed that SBPNs-T400 performed type Ⅰ curve with a combination of H2and H3hysteresis loops while the other two displayed type Ⅳ curves with H3hysteresis loop, demonstrating that SBPNs-T400 primarily had both ball-like and crack-like micropores and the latter two mainly were with crack-like mesopores[37]. This phenomenon was further explored by combining the isotherms with BET and BJH methods to establish the microstructure parameters of SBPNs as specific surface areaS, pore volumeVand pore widthW(shown in Table 1). In general,S,VandWhad a profound impact on adsorption properties[38]. Notably, the BET, micropore and external surface area (corresponding toSBET,Smicro, andSext, repectively) of SBPNs-T300 respectively increased from 8.249 8 m2/g, 1.064 0 m2/g and 7.185 8 m2/g to 170.495 4 m2/g, 94.582 8 m2/g and 75.912 6 m2/g for SBPNs-T400. This result was possibly attributed to the disaggregation of the crystal structures and formation of porous carbon materials[34], which also confirmed the results of the above analyses. After the calcination temperature rose from 400 ℃ to 600 ℃,SBETdecreased along with the decrease ofSmicrowhileSextwas nearly invariant, indicating that at the higher temperature the carbon residual ulteriorly burned and the crystal bundles and aggregates were destroyed[6]. The loss of micropores of the SBPNs-T400 caused the increase of the relative quantity of mesopores, which resulted in theVtotaland average pore widthWafor SBPNs-T600.
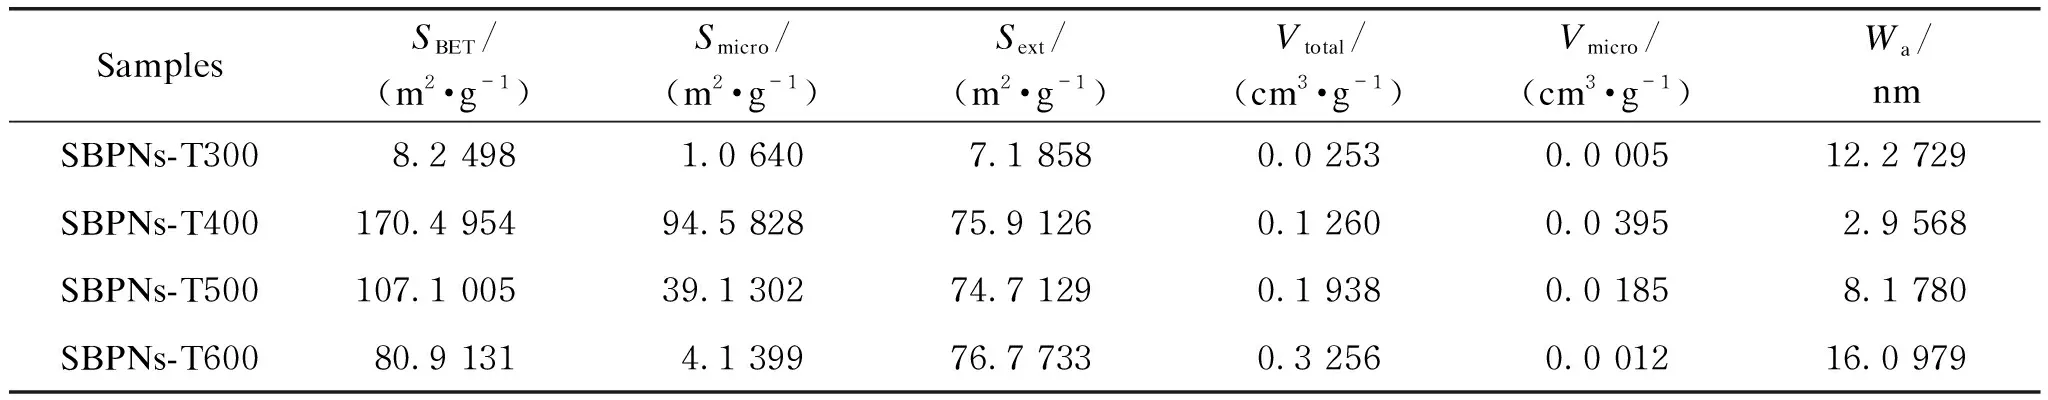
Table 1 Textural characteristics of SBPNs-T300, SBPNs-T400, SBPNs-T500, and SBPNs-T600

Fig.6 N2 adsorption-desorption isotherms of SBPNs-T300, SBPNs-T400, and SBPNs-T600 (the inserted picture is the enlargement of SBPNs-T300 isotherm)
2.4 Adsorption studies for MB
In this section, the influence of various factors, including calcination temperature, initial solution concentration and pH, on adsorption capacity of MB was discussed. Furthermore, the Langmuir and Freundlich isotherm models were adopted to interpret the adsorption data.
2.4.1Adsorptionisothermstudies
To determine the maximum adsorption capacity of the SBPNs, we performed batch experiments where the same amount of absorbent was poured into varying initial concentrations of MB solution. As presented in Fig.7(a), the equilibrium adsorption capacityqeincreased with the increasing equilibrium solution concentration. Then, the obtained data was evaluated by fitting them to two different isotherm models[39].
In the Langmuir model, monolayer adsorption is assumed to occur on the surface of an adsorbent filled with homogenous adsorption sites[40]. Based on Eq. (1), the graph shown in Fig.7(b) betweenCe/qeandCewas plotted to determine the correlation parameters. The results visibly proved that the Langmuir model was successfully applied to describe the adsorption process of MB on SBPNs-T400. The maximum adsorption capacityqmand adsorption rateKLwere calculated by the slope and intercept of the fitting curves, respectively, which are organized in Table 2. Moreover, another essential dimensionless parameter corresponding to the adsorption process, which was determined to be favorable or unfavorable by
RL=1/(1+KLC0).
(4)
The Freundlich model is an experiential function where adsorption is assumed to occur on the heterogeneous surface[41]. On the basis of the above data and Eq. (3), the graph of lnqeand lnCeprovided a linear curve by which theKcandncould be easily confirmed. The calculated parameters are shown in Table 2.
Basing on the linear correlation coefficientR2, we deduced that the Langmuir model was better than the Freundlich model with respect to fitting the equilibrium adsorption data. Thus, the surface of sorbent was full of monolayer adsorption sites, which stopped adsorbing sorbate when occupied. Besides, the maximum adsorption capacity of SBPNs-T400 was 112.36 mg/g, which was far superior to 78.1 mg/g of heated PG alone[9]. In addition, theRLcalculated from Eq. (4) lay in the range of 0-1 andnwas 3.14 falling in the range of 1-10, which demonstrated the MB adsorption capacity was favorable[7, 42].

Fig.7 MB adsorption capacity of SBPNs-T400: (a) adsorption isotherms; (b) Langmuir fitting curve; (c) Freundlich fitting curve

Table 2 Parameters calculated by the three adsorption isotherm models
2.4.2Effectofcalcinationtemperature
To study the effect of calcined temperature on the adsorption property of SBPNs, we performed experiments where SBPNs calcined at different temperatures were added into a series of concentrations (20-100 mg/L). The tested data were fitted by the Langmuir model to obtain the maximum adsorption capacityqm, the variation trend ofqmwith different calcination temperatures is displayed in Fig.8(a). Originally,qmincreased tardily with increasing calcined temperature until 300 ℃ and then sharply increased to 112.36 mg/g at 400 ℃ from 27.46 mg/g at 300 ℃. These situations could be attributed to that the PG was included in as-spun fibers resulted in PG hardly approached and adsorbed MB dye molecules when placed into solutions. While increasing calcination temperatures less than 300 ℃, the SBPNs underwent cyclization and dehydration reactions. The underwent cyclization made fiber structures more compact but prevented MB from diffusing into the surface of PG, whereas the dehydration reactions promoted the adsorption of dye molecules and played a stronger role than the underwent cyclization, thus slightly improving the overall adsorption performance of the fibers. After SBPNs was calcined at 400 ℃, not only a portion of PAN oxidized to gas rendered PG more exposed and enhanced the relative contents of PG, but also the high temperature brought PG more negative potential and made parts of PAN turn into carbon residues resulting in the huge increase in SBETfrom 8.249 8 m2/g (SBPNs-T300) to 170.495 4 m2/g (SBPNs-T400), as proven in previous structure analysis. These phenomena are conducive to enhancement of the adsorption capacities of the fibers. However, with the higher calcination temperature, the depletion of carbon residue brought out the steady decline in SBETof SBPNs and the destruction of the PG structures reduced the adsorption capacities of the fibers for MB dye on the sorbent, which could explain the behavior that the maximum adsorption capacity firstly decreased to 102.25 mg/g at the calcined temperature of 500 ℃ from 112.36 mg/g at 400 ℃ and then to 71.48 mg/g at 600 ℃.
2.4.3EffectofinitialMBconcentration
The effects of initial solution concentration on the adsorption capacity and the removal efficiency were assessed by putting 20 mg of SBPNs into 25 mL MB solution at different initial concentrations in the range of 20-100 mg/L, shaking them for over 24 h to reach the equilibrium stage. The obtained data were used to calculate adsorption capacity and removal efficiency that was expressed as
Re=(C0-Ce)/C0.
(5)
As illustrated in Fig.8(b), the results revealed that the adsorption capacity increased with the rise of initial MB solution concentration due to the higher concentration providing more stronger driving force for dye transfer[43]. It was clear that SBPNs and SBPNs-T300 grew at a slow rate and quickly leveled off while the rest increased rapidly matching their maximum adsorption capacity.
With respect to removal efficiency, as the initial MB concentration increased from 20 mg/L to 100 mg/L, the removal efficiency of SBPNs-T600 dropped from 95.6% to 55.7% (shown in Fig.8(c)). The rest also had different levels of decrease. The reason for these was associated with the limited active adsorption sites on a certain amount of adsorbents and that it could not adsorb other dye molecules when the adsorption site was occupied[44].
2.4.4EffectofpHvalueofsolution
It has been established that pH values have a significant impact on the adsorption process of MB[45]. To explore the effect of pH levels, batch experiments where 20 mg of SBPNs-T400 was mixed with 25 mL of MB solution (100 mg/L) adjusted with dilute HCl or NaOH solution to the pH range of 1-12 were conducted. As shown in Fig.8(d), the adsorption capacity increases gradually with pH level increasing to 4.00, followed by a dramatic increase to 96.45 mg/g at pH 5.87 and then tends to be gentle at higher pH values. Under acidic conditions, some nucleophilic groups in SBPNs-T400 as hydroxyl and carboxylic adsorbed hydrogen ions, which repelled positively charged MB[7,46]. However, there was still 31.2 mg/g of adsorption capacity (pH=1.67) on account of their micropore and mesoporous and the π-π stacking interactions between cyano group and MB[47]. As pH increased, SBPNs-T400 would provide more silanol groups (Si—OH) to appeal to MB due to more vital hydrogen-bond interaction[48]. Notably, the further increase of adsorption capacity at pH of 11.21 was caused by the additional precipitation of MB molecules[49].

Fig.8 MB adsorption capacity of SBPNs: (a) effect of calcined temperature on maximum adsorption capacity; (b) initial MB solution concentration on adsorption capacity; (c) removal efficiency; (d) effect of pH values on the adsorption of SBPNs-T400
3 Conclusions
In summary, the novel SBPNs was fabricated by solution blowing technique followed by post calcination treatment. The resultant fibers were characterized to analyze the changes in their morphologies, structures, and chemical compositions. As sorbents, the SBPNs exhibited favorable adsorption properties that were superior to those of only heat-treated PG. Subsequently, the Langmuir model fitted the adsorption isotherms better than the Freundlich model, suggesting that monolayer adsorption occurred. Most importantly, the maximum adsorption capacity for SBPNs-T400 was the highest among those of SBPNs, owning a value of 112.36 mg/g. Moreover, the higher the initial MB concentration was obtained, the more significant the adsorption capacity was. Meanwhile, the adsorption capacity of MB increased with the rise of pH in the range of 1-10. Overall, the SBPNs exhibited strong potential as recoverable adsorbents for water purification.
 Journal of Donghua University(English Edition)2022年6期
- Journal of Donghua University(English Edition)的其它文章
- Conductive Polyacrylonitrile Fiber Prepared by Copper Plating with L-Ascorbic Acid as Reducing Agent
- Fabrication and Characterization of Yarn-Based Temperature Sensor for Respiratory Monitoring
- Anti-wrinkle Finishing of Cotton Fabrics with Pyromellitic Acid Enhanced by Polyol Extenders
- Preparation and Characterization of Sepiolite Microfibers with High Aspect Ratio
- Active Absorption of Perforated Plate Based on Airflow
- Customer Churn Prediction Model Based on User Behavior Sequences