
Identif ication of key taste components in Baccaurea ramif lora Lour.fruit using non-targeted metabolomics
2023-01-22 09:45JiChnFngninWuHuhnWngChunGuoWngnZhngPisiLuoJingZhouWnwnHoGungyoYngJinjinHung
食品科学与人类健康(英文) 2023年1期
Ji Chn, Fngnin Wu, Huhn Wng, Chun Guo, Wngn Zhng,Pisi Luo, Jing Zhou, Wnwn Ho, Gungyo Yng,*, Jinjin Hung*
a Jiangxi Provincial Key Laboratory for Bamboo Germplasm Resources and Utilization, Jiangxi Agricultural University, Nanchang 330045, China
b School of Life Science and Food Engineering, Hanshan Normal University, Chaozhou 521041, China
c College of Coastal Agricultural Sciences, Guangdong Ocean University, Zhanjiang 524088, China
d Guangxi South Subtropical Agricultural Science Research Institute, Guangxi Academy of Agricultural Sciences, Longzhou 532415, China
e Sun Yat-sen University Cancer Center, State Key Laboratory of Oncology in South China, Collaborative Innovation Center for Cancer Medicine, Guangzhou 510060, China
Keywords:Baccaurea ramif lora Taste Metabolites prof iling Non-targeted metabonomics analysis
A B S T R A C T Among the numerous fruit species of Baccaurea ramif lora Lour., ‘LR’ (white f lesh) and ‘BR’ (pink f lesh) are two kinds of local strains with high edibility. In order to study the metabolic causes of taste differences, we performed the non-targeted metabonomics analysis of ‘LR’ and ‘BR’ using LC-MS/MS. 541 metabolites were totally identif ied, and 45 kinds of metabolites (carbohydrates, fatty acids, f lavonoids and terpenoids, etc.) were different between the two strains. The results indicate L-sorbose, D-(+)-glucose, citric acid, L-phenylalanine and oleamide, α-eleostearic acid were the main primary metabolites. The significant difference existed in pathways of unsaturated fatty acids between the studied two strains by pathway enrichment analysis. The results demonstrate that the different in composition, as well as the abundance of primary and secondary metabolites may be the potential causes of taste differences, which provides a new insight into the possible metabolic factors setting off the changing taste of B. ramif lora.
1. Introduction
Baccaurea ramifloraLour., a wild fruit tree from tropics to north tropics, is a small evergreen or semi-deciduous tree belonging to the Phyllanthaceae family.B. ramifloragrows in South China (mainly in Hainan, Lianjiang Guangdong, South Guangxi and Southwest Yunnan, etc.) and Southeast Asia countries such as India, Nepal, Myanmar, Thailand, etc. [1-3]. UnlikePhyllanthus emblica, another plant of Phyllanthaceae which has been commercially used as traditional fruit or traditional medicine [4-8],B. ramiflorahas not been commercially cultivated and is an underutilized fruit species [9]. Currently, local strains are mainly grown around the village or the courtyard. The f lowering and fruiting period ofB. ramiflorais fromlate May to early August, and it’s about one and a half months earlier ofHainan province than other provinces in China. The pulp ofB. ramifloracontainsa variety of nutritional components such asvitamin C, titratable acid and sugar [10,11]. It tastes sweet and sour, tender and smooth, and can be eaten fresh or processed into juice, preserved fruit, jam and wine [12].Due to the different f lowering and fruiting period ofB. ramif lorafrom different provenance, it has the potential to make up for the shortage of fruits in the current season. Previous studies have proved thatB. ramif lorahas medicinal function for its antiinflammatory, antioxidant activity, anti-tumor effect and brain protection activity, etc. [13-15].
There are abundant germplasm resources of unknownB. ramifloravarieties, and most of them are local strains, unified evaluation standard has not been established. Their fruits are in varied phenotypes and quiet different quality, the peels maybe red, pink,purple, green, yellow or white and the flesh maybe milky white, pink or purple [9,12]. Currently, ‘BR’ (pink flesh) and ‘LR’ (white flesh)(Fig. 1) are two local strains in Guangxi tasting well with more cultivation. Compared with ‘LR’, better in pulp color and taste makes ‘BR’more popular. However, the ‘LR’ has a thicker peel and is easier to store.
Water soluble sugar, organic acids, nucleotides, free amino acids,sodium ion, and taste peptides and its derivatives are the main taste compounds in food [16-18]. Non-targeted metabolite analysis is a fast and reliable method based on liquid chromatography-tandem mass spectrometry (LC-MS/MS), which is used to detect a variety of plant metabolites [19,20]. Recently, few studies on the metabolites of theB. ramiflorafruit was reported [12]. However, metabonomics analysis has not been used to identify the taste compounds inB. ramiflora, the metabolic pathways and main taste compounds ofB. ramifloraare still unclear. In order to figure out the components of metabolites and main taste compounds inB. ramiflorafruit, as well as the difference of metabolites during fruit ripening, nontargeted metabonomics analysis was used to identify the metabolites and abundance. The carbohydrate, organic acid, amino acid, fatty acid and flavonoid metabolites in the two strains were analyzed by LC-MS/MS, and the study can make us better understand the taste difference of the pulp.
2. Materials and methods
2.1 Plant materials
Two local strains ofB. ramiflora, ‘LR’ (green peel and white pulp when ripe) and ‘BR’ (white peel and pink pulp when ripe)(Fig. 1) were selected and used in this study. These two selected germplasm resources have been screened and preserved by local villagers for many years, and have been widely planted in Fangchenggang and Chongzuo area of Guangxi province, China.Samples were collected from healthy fruit trees more than 10 years old grow in villagers’ homes near Nasuo middle school in Fangcheng District, Fangchenggang, Guangxi province, China (N 21°42′33″, E 108°6′29″, h 20 m).
2.2 Sample preparation and metabolite extraction
We selected three well-grown trees for LR and BR strain,respectively, and collected 6 fully mature fruits from each tree. Then 4 pulps of same strain were randomly selected to mix together as one biological sample, 3 biological were prepared for each strain and 3 biological replicates were performed. The samples were stored in liquid nitrogen immediately after collection, then taken back to the laboratory and stored at –80 °C until the metabolites were extracted.50 mg of sample was weighed and placed in a 1.5 mL centrifuge tube, added 800 μL of extraction solution (methanol:water =7:3,V:V, pre-cooled at –20 °C) and 20 μL of internal standard, added two small steel balls, grinded in a tissue grinder (50 Hz, 5 min). After ultrasonic in a water bath at 4 °C for 30 min, the sample was kept in a refrigerator at –20 °C for 1 h. Centrifuged at 14 000 r/min for 15 min at 4 °C, 600 μL of supernatant was taken and passed through a 0.22 μm filter membrane, the filtered sample was collected and placed in a sample bottle for LC-MS analysis.
2.3 UPLC-MS/MS analysis
The extracts were analysed by non-targeted metabonomics using an UPLC-HRMS/HRMS system (UPLC, Waters 2D UPLC, USA;HRMS, Thermo Fisher Scientific, USA). Sample solutions (5 μL)were injected on to a Hypersil GOLD aQ chromatographic column(1.9 μm, 100 mm × 2.1 mm, Thermo Fisher Scientific, USA). The UPLC mobile phase was 0.1% formic acid (solvent A) in water versus 0.1%formic acid in acetonitrile (solvent B) and the gradient was 0 min, 5% B;2 min, 95% B; 22 min, 95% B; 27.1 min, 5% B solution. The flow rate was 0.3 mL/min at a temperature of 40 °C.
Primary and secondary mass spectrometry data were collected using a Q Exactive mass spectrometer. The scanned mass-to-charge ratios (m/z) was 150-1 500, the primary resolution was 70 000, the AGC was 1 × 10⁶, and the maximum injection time (MIT, injection time) was 100 ms. Top 3m/zpeaks for fragmentation and secondary information collection were selected according to the precursor ion intensity, the secondary resolution was 35 000, AGC was 2 × 10⁵,MIT was 50 ms, and the fragmentation energy (stepped NCE) was set at 20, 40, 60 eV. Sheath gas flow rate and Aux gas flow rate of ion source (ESI) were 40 and 10, respectively. Spray voltage (|kV|) of positive ion mode and negative ion were 3.80 and 3.20, respectively.The ion transfer tube temperature (capillary temp) was 320 °C, the auxiliary gas heater temp (aux gas heater temp) was 350 °C.
2.4 Quality control measurement
Quality control (QC) sample were prepared by mixing equal volumes (20 μL) of each sample. The chromatogram overlap,principle component analysis (PCA), number of peaks and peak response intensity differences of QC was used to evaluate the repeatability and stability of the LC-MS analysis process.
2.5 MS data and statistical analysis
Import the raw data collected by LC-MS/MS into compound discoverer 3.1 (Thermo Fisher Scientific, USA) for data processing.Data processing includes peak extraction, retention time correction of intra group and inter group, adduct ion merging, missing value filling, background peak labeling and metabolite identification, and the information of compound molecular weight, retention time,peak area and identification results were exported in the end. The identification of metabolites combines multiple databases including BERRY Library (Berry’s self-built standard library), mzCloud and ChemSpider (HMDB, The Human Metabolome Database; KEGG,Kyoto Encyclopedia of Genes and Genomes; LipidMaps, The Lipid Metabolites and Pathways Strategy).
The results from compound discoverer 3.1 were imported into metaX for data preprocessing, including normalize the data to obtain relative peaks area by Probabilistic Quotient Normalization (PQN) [20],batch effect correction via local polynomial regression fitting signal correction by quality control-based robust LOESS signal correction (QCRLSC) [21], deletion of the compounds in QC samples whose relative peak area coefficient of variation (CV) were greater than 30%.
The metabonomic R software package metaX and the metabonomic information analysis process independently developed by Berry Hekang Gene Company was used for data preprocessing,statistical analysis (includes PCA, FC and VIP etc.), and metabolite classification and functional annotations [22]. PCA is used to reduce the dimensions of multivariate original data, so as to analyze the grouping, trend (similarities and differences within and between the sample group and between groups) and outliers of the observed variables in the data set value (whether there were abnormal samples).After log2conversion of data, a PLS-DA (partial least squares method discriminant analysis) model was established between the comparative analysis group (two groups of samples), and the method used for scaling was Par. 7 fold cross validation was performed when the model was established. In order to judge the model quality,PLS-DA model was tested for 200 times of response permutation testing. The variable importance projection (VIP) values of the first two principal components of PLS-DA model was used to screen the differential metabolites, combined with the results of fold change and student’st-test from univariate analysis. Both PCA and fold change were calculated by log2, and the screening criteria wereP-value < 0.05,VIP ≥ 1, fold-change ≥ 1.2 or ≤ 0.83. Up and down of differential metabolites is based on LR/BR.
3. Results
3.1 Non-targeted metabolite analysis of B. ramiflora
To better understand the flavor differences between two local strains ofB. ramiflora, we performed non-targeted LC-MS/MS-based metabolite analysis of ‘LR’ and ‘BR’, which represented milky whiteand pink- fleshed-cultivars, respectively. In total, 541 metabolites were identified, of which 361 were identified by positive ion mode and 201 by negative ion mode, and 21 of them were repeated (Table S1).The identified components included a large number of primary metabolites (12 carbohydrates, 3 organic acids, 7 amino acids and 8 its derivatives, 2 vitamins, 41 fatty acids) and secondary metabolites(42 flavonoids, 8 phenol, 6 phenolic acids, 26 phenylpropanoids, 4 steroids and 5 its derivatives, 75 terpenoids), which affect the fruit taste potentially (Table S1). In the previous, Pandey et al. have researched few nutrients contents like carbohydrate (86.14%), crude protein (5.43%), crude fat (1.24%), crude fibre (3.6%) and some mineral elements (calcium 23.77 µg/L, magnesium 21.67 µg/L,potassium 375.37 µg/L, sodium 7.99 µg/L, iron 29.55 µg/L,molybdenum 1.03 µg/L, zinc 0.97 µg/L, copper 14.33 µg/L, manganese 37.29 µg/L) using traditional methods [23]. Compared with the previous investigation, our research on the identification the specific substances in the pulp ofB. ramiflorawas more systematic.
3.2 Statistical analysis of identified metabolites
PCA analysis of the metabolite peak area in the positive and negative ion mode were performed by processed the log2,respectively. The PCA separated the two localB. ramiflorastrains and QC samples clearlywith a significant difference ofP< 0.05(Fig. 2). Lg transformation on the peak area of each metabolite and subsequent hierarchical clustering analysis were performed to eliminate the influence of quantity on pattern recognition. This analysis revealed two distinct groups related to ‘LR’ and ‘BR’, respectively (Fig. 3). Thus,PCA and cluster analysis suggested that these two varieties had distinct metabolic characteristics.
After school, the girls invited me to join them in front of the school. I was thrilled to be a member of the club, however tentative. We waited. For what, I didn’t yet know. Oh, how I wish I had gone home, but I had a lesson to learn.
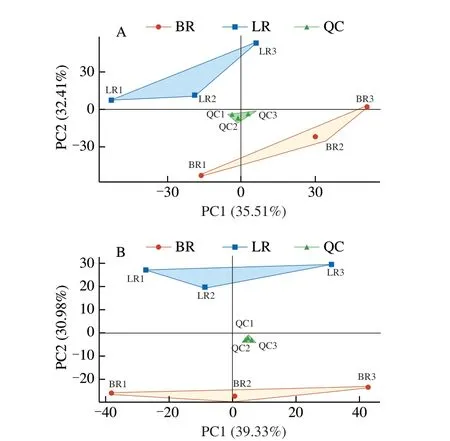
Fig. 2 PCA analysis of metabolites identified from ‘LR’ and ‘BR’. Equal volumes of ‘LR’ and ‘BR’ fruit samples were mixed for use as a QC.(A) Positive ion model; (B) Negative ion model.
PCA was performed to identify the differential metabolites between ‘LR’ and ‘BR’, and 57 differential metabolites were screened(Table S2) with a fold_change ≥ 1.2 times (up-regulated) or ≤ 0.83 times (down-regulation). These selected metabolites were screened again using a VIP values (VIP ≥ 1) from the PLS-DA model. In the response sequencing test figures of PLS-DA analysis model (Fig. S1),R2YandQ2were close to 1, andQ2was higher than 0.5, indicating that the model was more stable and reliable. In addition, whenR2andQ2were the response sequencing test, they-intercept ofR2andQ2regression lines was less than 0, indicating that the prediction effect of this model was better. Through the above screening methods, 45 different metabolites between the two local strains ofB. ramiflora(Table S2) were identified. 19 metabolites (13 in positive ion mode,and 6 in negative ion mode, respectively) of them were up-regulated and 26 metabolites (16 in positive ion mode, and 10 in negative ion mode, respectively) were down-regulated in ‘LR’ compared with ‘BR’(Fig. 4). Furthermore, the 45 metabolites can be divided into more than 11 different types, and most of them were carbohydrates, fatty acids, flavonoids, and terpenes (Fig. 5).
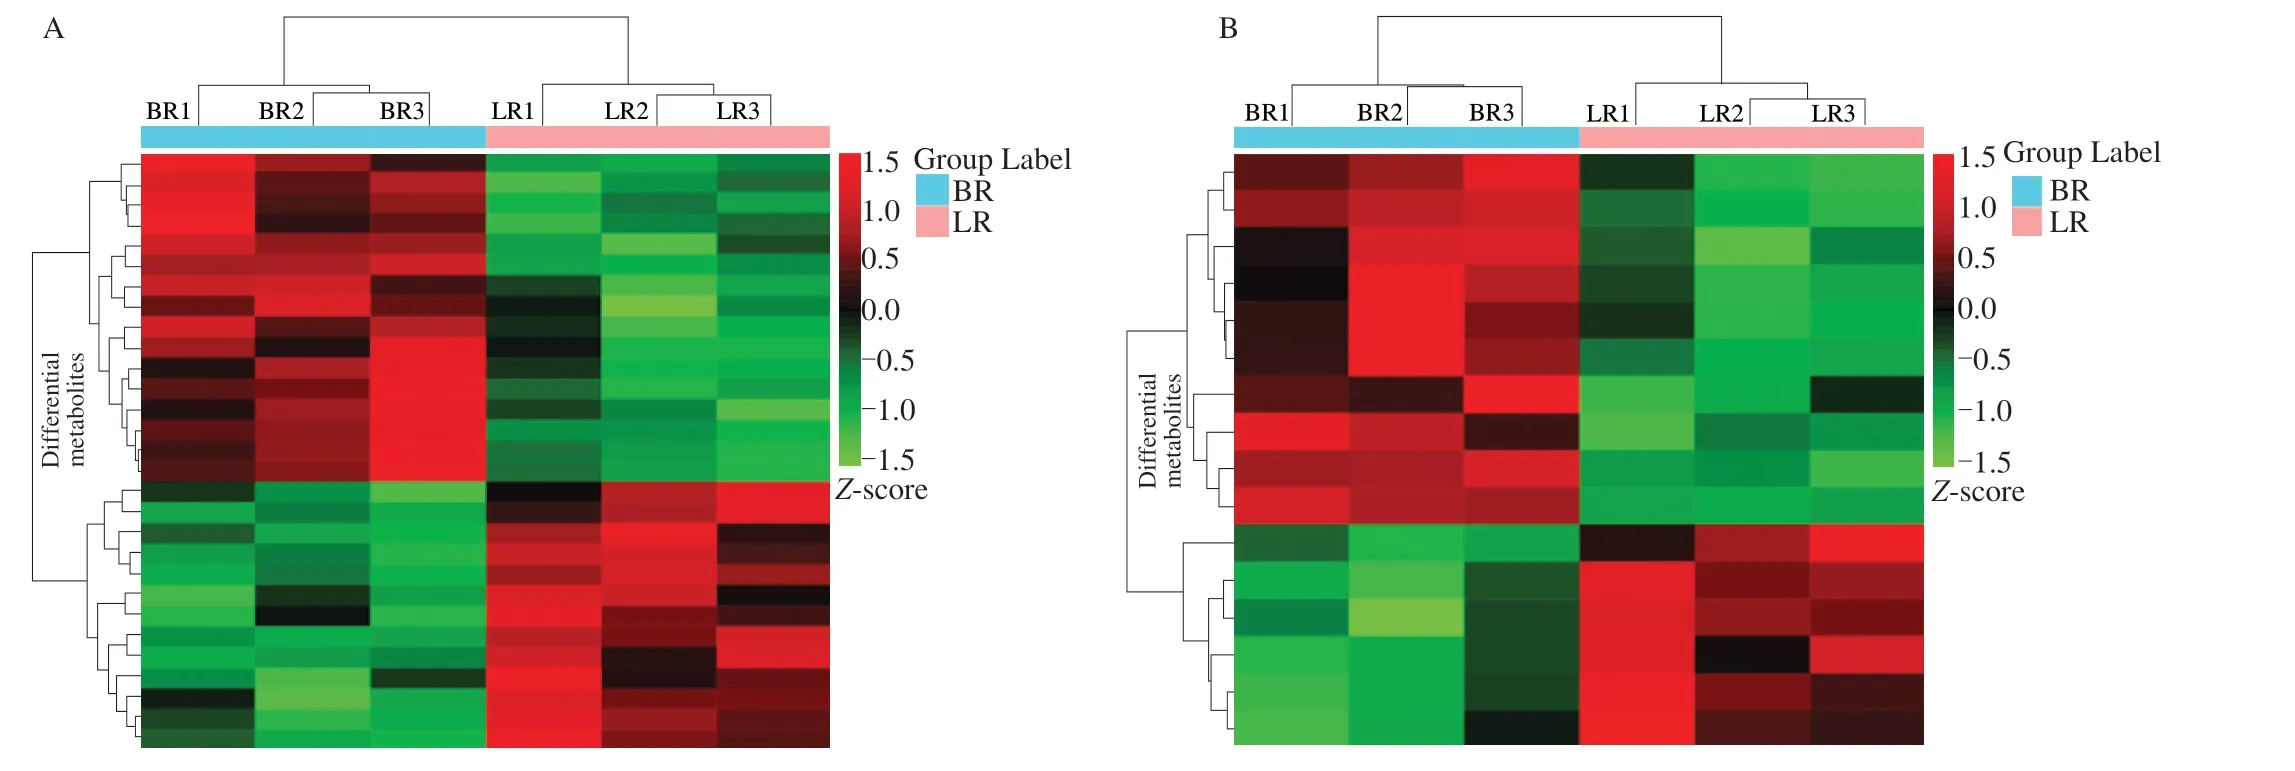
Fig. 3 Cluster analysis of metabolites from samples of ‘LR’ and ‘BR’. The colour indicates the level of accumulation of each metabolite, from low (green) to high (red). The score represents the deviation from the mean by stand ard deviation units. (A) Positive ion model; (B) Negative ion model.
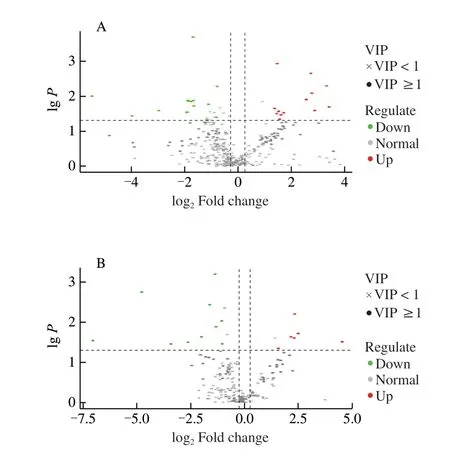
Fig. 4 Differentially accumulating metabolites between ‘LR’ and ‘BR’.Volcano plot of the 562 metabolites identified. Differential metabolites were defined as metabolites with fold change ≥ 1.2 or ≤ 0.83 in ‘LR’ compared to ‘BR’. A threshold of VIP ≥ 1 was used to separate differential metabolites from unchanged metabolites. (A) Positive ion model; (B) Negative ion model.
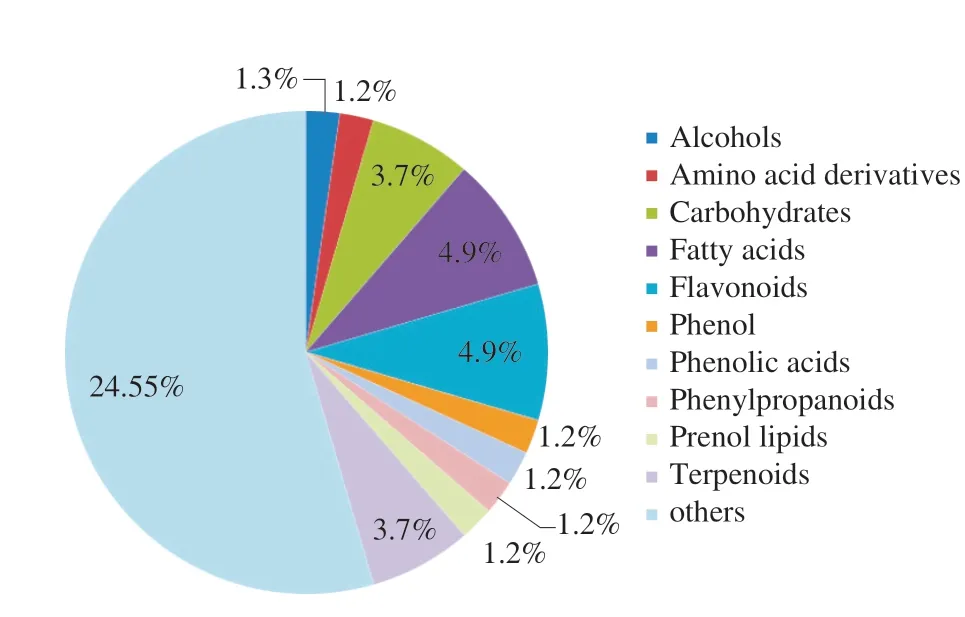
Fig. 5 Pie chart depicting the biochemical categories of the differential metabolites identified between ‘LR’ and ‘BR’. The first denomination is quantity, and the second denomination is percentage.
3.3 Enrichment analysis of metabolic pathways of differential metabolites
The metabolic pathway withP-value < 0.05 was the metabolic pathway with significant enrichment of differential metabolites. The enrichment analysis of metabolic pathway of differential metabolites was carried out based on KEGG (Kyoto Encyclopedia of Genes and Genomes) database. We mapped the metabolites to the KEGG database and view the information about the pathway. The results showed that most of the metabolites were mapped to “metabolism”, but few belonged to other systematic information classification, such as environmental information processing, cell process, genetic information processing and drug development (Figs. S2 and S3), which was consistent with the expectation. Subsequently, we performed KEGG pathway enrichment analysis to identify the differences in metabolic pathways between these two local strains. The enrichment analysis identified significant differences in the metabolites from three plant metabolic pathways(ubiquinone and other terpenoid-quinone biosynthesis, biosynthesis of unsaturated fatty acids, phenylalanine, tyrosine and tryptophan biosynthesis) between the two varieties (P< 0.05) (Fig. 6).
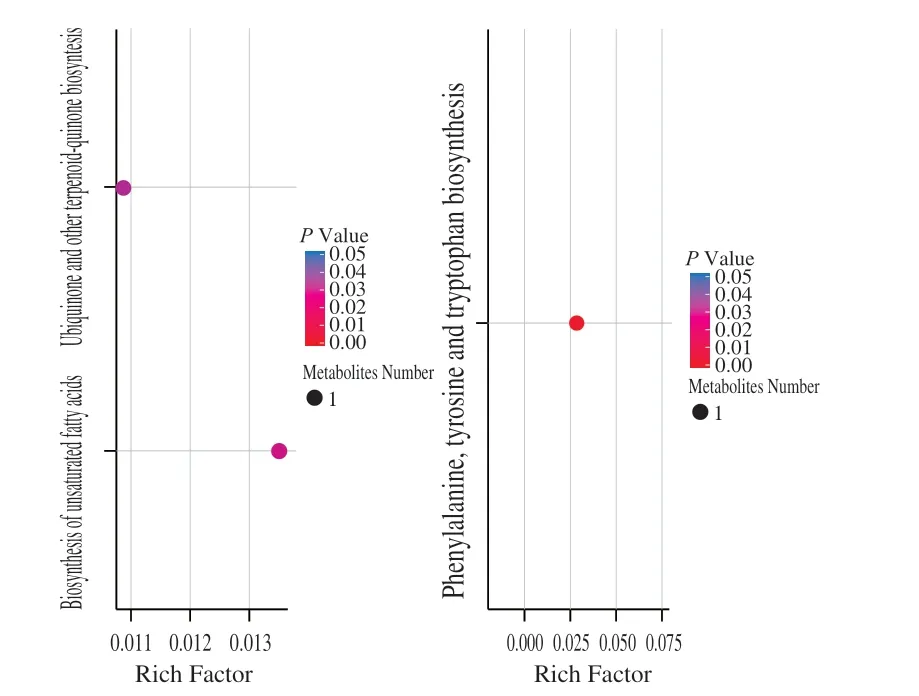
Fig. 6 The X-axis enrichment factor (Rich Factor) is the number of different metabolites annotated in this pathway divided by all identified metabolites annotated in this pathway. The higher the value, the higher the ratio of different metabolites annotated in this pathway. Dot size represents the number of differentially expressed metabolites annotated to this Pathway. (A) Positive ion model; (B) Negative ion model.
3.4 The main ingredient related to the taste of pulp
Fruit taste is the most important consideration of consumers, fruit color can affect consumers’ preference. In addition, the shelf life can determine the freshness value of fruit. So we focused on the types of metabolites that may contribute significantly to the taste, color and shelf life of fruit. Therefore, the main components of carbohydrate,organic acid, amino acid, fatty acid, flavonoids and terpenoids have become our key research content. 12 kinds of carbohydrates were identified in both local strains,L-sorbose,D-(+)-glucose and bis (methylbenzylidene)sorbitol were the major ingredients (Table 1).Based on fold change and VIP value, three sugars, nystose,D-(+)-glucose and sibiricose a3, were identified as differentially accumulated, all their concentrations were significantly greater in ‘BR’ than in ‘LR’ (Student’st-test,P< 0.05). Three organic acids were identified in both strains without significant difference in accumulation (Table S1, Table 2), and the relative abundance of citric acid was the highest (Table 1). We identified 6 kinds of amino acids and 7 kinds of derivatives in total, withL-phenylalanine,L-tyrosine andDL-arginine,L-alanyl-L-proline, methionine sulfoxide and 2-hydroxyphenylalanine making up the majority (Table S1). Of these, only gabapentin accumulated at significantly higher concentration in ‘BR’ than ‘LR’. We identified 38 kinds of fatty acids (Table S1),mainly oleamide,α-eleostearic acid and corchorifatty acid f (Table 1).Four fatty acids, farnesyl acetate, eicosapentaenoic acid, jasmonic acid and corchorifatty acid f, were differentially accumulated and lower concentrations occurred in ‘BR’ than ‘LR’ (Table 2). Eight phenols(mainly forsythoside E, helicid and androsin) and six phenolic acids(mainly isobutyl 4-hydroxybenzoate, ethylparaben, and paeonolide) were identified (Table S1). Lauryl gallate, one of the identified phenols, was up-regulated with a 4.51 fold-change in ‘LR’ compared to ‘BR’ (Table 2).
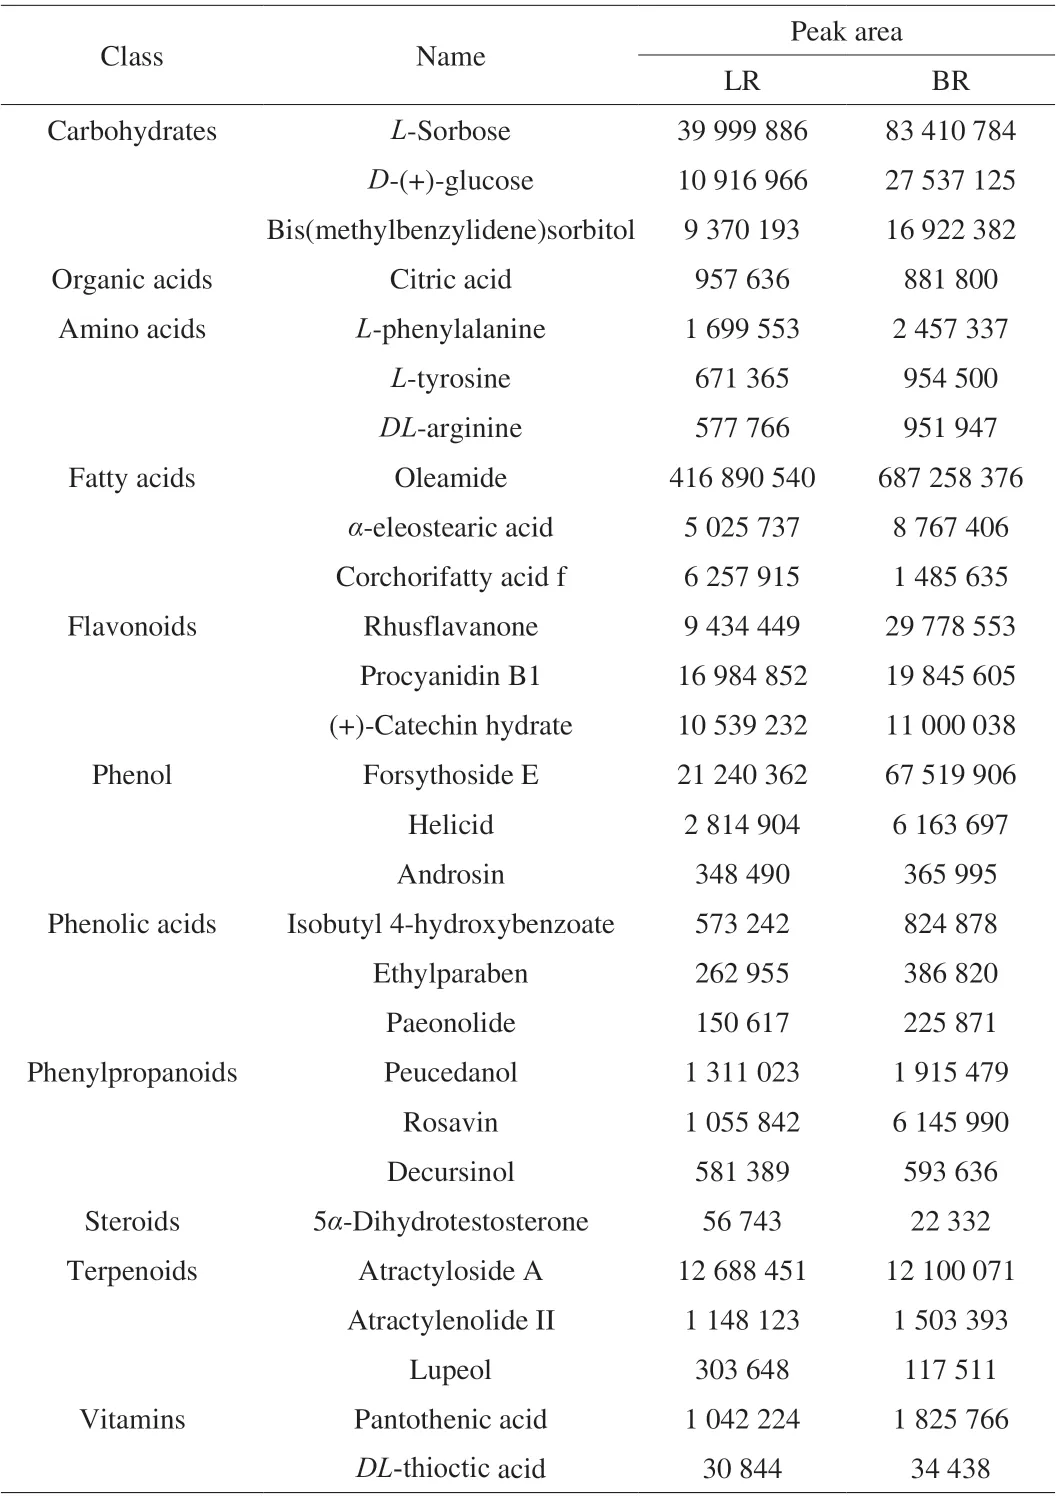
Table 1 The principal content of pulp metabolites of B. ramiflora.
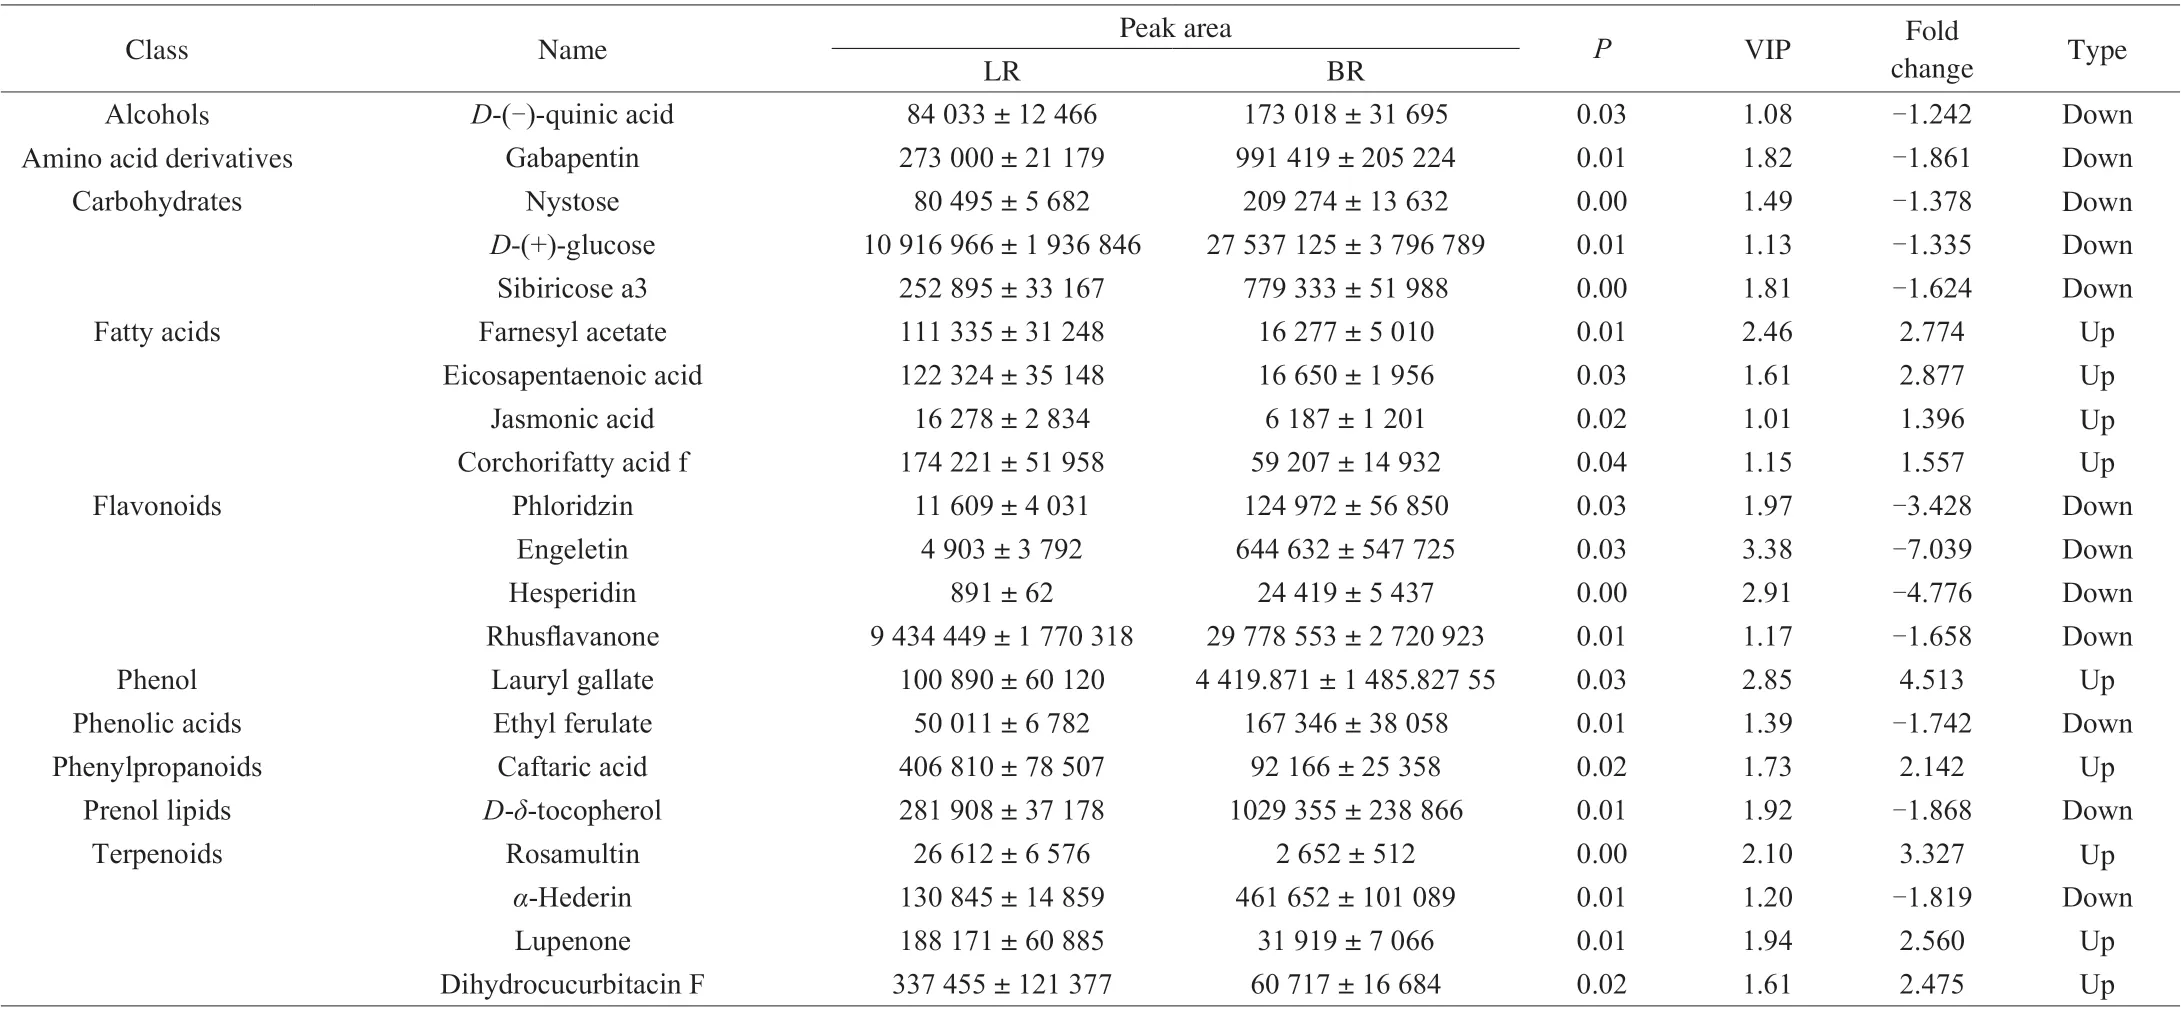
Table 2 Statistics of main differentially accumulating metabolite in the flesh of ‘LR’ and ‘BR’.
3.5 The main component related to fresh color
Color is mainly determined by flavonoids, which are synthesized by the phenylpropane pathway. We identified 34 flavonoids in total(Table S1), mainly rhusflavanone, procyanidin B1 and (+)-catechin hydrate. Of these, phloridzin, engeletin, hesperidin and rhusflavanone were differentially accumulated, and the concentrations of the four flavonoids were significantly greater in ‘BR’ than ‘LR’ (P=0.03, 0.03, 0.00, 0.01, respectively; Table 2). 25 phenylpropanoids(Table S1) mainly composed of peucedanol, rosavin and decursinol were identified without significant differential accumulation.
In addition, 4 steroids, 5 derivatives of steroids, 45 terpenoids and two vitamins (pantothenic acid, dl-thioctic acid) and some other metabolites were also identified (Table S1).
4. Discussion
Non-targeted metabolite analysis utilizing MS/MS data has been used successfully for large-scale metabolite analysis among numerous different plant species [24-26]. Previous studies on the metabolites ofB. ramiflorafruit mainly focused on specific types of metabolites,such as soluble sugar [27], anthocyanins (flavonol pigments) [28,29],volatile oil [30] and sesquiterpene (Sapidolide A) in fruit [31], steroids and polyphenols in leaves, roots and stems [32-34]. However, the general differences in the metabolic profiles of different local strains have not been studied thoroughly until now. In this study, we used LC-MS/MS-based non-targeted metabolomics to explore the possible factors causing the different taste of two representative strains with different colored flesh. We identified a total of 541 metabolites, 45 of which were differentially accumulated in ‘LR’ and ‘BR’. Therefore,this study provides new evidence of metabolic for the taste differences between white- and pink-fleshedB. ramiflorafruit.
The color of the pulp is usually determined by carotenoids and anthocyanins. Flavone and flavonoids are a kind of pigments existing in various plants, which are synthesized by the phenylpropane pathway [46]. The synthesis of anthocyanin is related to flavonoids and phenylpropanoids, which are precursors of anthocyanin synthesis. Flavonoids has the effects of pressure protection on plants and health promotion on human body [47,48]. Branches of the flavonoid biosynthesis pathway involved in the production and regulation of anthocyanins, procyanidins and flavonols [49]. The common phenylpropanoids involved in anthocyanin synthesis are taxifolin dihydroquercetin, kaempferol, naringenin chalcone and naringenin. Our results indicated that the concentrations of flavonoids(such as phloridzin, engeletin, hesperidin, and rhusflavanone)were much higher in ‘BR’ than in ‘LR’, indicating that they may affect the pink color of ‘BR’. According to the results, there were abundant procyanidin B1, isoquercitrin, quercitrin, and taxifolin dihydroquercetin in the pulp ofB. ramiflorafruit, all of which were branches of cyanidin synthesis, suggesting that pink color may be determined by cyanidin. Besides, abundant trilobatin, rutin, naringenin chalcone, eriodictyol, narcissoside, glycitin, poncirin, diosmetin-7-Oβ-D-glucopyranoside and morin in fruit ofB. ramifloramay also be involved in the synthesis of anthocyanin.
The shelf life of the fruit is determined by the external environment and internal metabolites. After years of observation,we found that ‘LR’ has a longer shelf life than ‘BR’. According to our studies, the concentrations of all differential fatty acids (farnesyl acetate, eicosapentaenoic acid, jasmonic acid and corchorifatty acid f)were higher in ‘LR’ than in ‘BR’, suggesting that these four fatty acids may be contributing to prolong the shelf life of fruit. Furthermore, it is safe to speculate that unsaturated fatty acids can extend the shelf life of fruits. Phenolic substances have the functions of scavenging active oxygen, inhibiting the activities of enzymes related to metabolism of, reactive oxygen species and reducing the production of free radicals, as well as chelating transition metals to prevent them from participating in the Fenton reaction [50], and these functions have effects on fruit preservation. The concentration of lauryl gallate in ‘LR’ was 4.5 times higher than that of ‘BR’, indicating that it had a certain effect on the later preservation, indicating that it had an effect on preservation of fruits. Moreover, abscisic acid can promote the development and maturity of fruits, and the higher concentration of abscisic acid in ‘BR’ than that in ‘LR’ brings a negative effect on the preservation of ‘BR’ fruit. All the above factors explained that ‘LR’had a longer shelf life than ‘LR’.
In addition to carbohydrates, organic acids and amino acids, KEGG enrichment analysis also found that metabolites produced by three plant metabolic pathways (ubiquinone and other terpenoid quinone biosynthesis, biosynthesis of unsaturated fatty acids, phenylalanine, tyrosine and tryptophan biosynthesis)were significantly and differentially accumulated between ‘LR’and ‘BR’ (Fig. 6). This indicated that some of the ubiquinones,terpene quinones, unsaturated fatty acids, phenylalanine, tyrosine and tryptophan compounds may also be responsible for fruit taste.Vitamins and phenolic acids were identified in large-scale metabolite analysis (Table S1), but not in the KEGG enrichment analysis (Fig. 6).Therefore, they were considered unlikely to contribute to taste differences between ‘LR’ and ‘BR’.
5. Conclusions
In this study, metabolic analysis based on LC-MS/MS was successfully performed to compare the taste differences between two local strains ofB. ramiflorasystematically. This work provides comprehensive information on the composition and abundance of metabolites in the fruit ofB. ramiflora. The results suggested that these differences in composition and concentration of carbohyrates,organic acids, fatty acids and phenolic compounds might be the primary causes of the differences in the taste between white- and pink-fleshedB. ramiflora. The results also infer that the differences in abundance and species of flavonoids and phenylpropanoids may be the root causes of the differences in color. Besides, compared with white-fleshedB. ramiflora,the white-fleshedB. ramiflorahas a longer shelf life for the higher fatty acid concentration and lower abscisic acid concentration. Our results reveal the main components of the taste of the pulp, clarified the taste difference between the two strains and why the pulp of ‘BR’ tastes better.
Conflicts of interest
The authors have declared no conflict of interest.
Acknowledgements
Forestry Science and Technology Innovation Project of Guangdong province (2018KJCX023); National Science Foundation for Young Scientists of China (31801742); Guangdong Key Laboratory for Functional Substances in Medicinal Edible Resources and Healthcare Products (2021B1212040015); Science and Technology Major Project of Guangxi (Guike AA17204045-4); Science and Technology Project of Chongzuo, Guangxi(Chongkegong 2019029). Thanks to Dr. Zhiqiang Yang from Guangxi South Subtropical Agricultural Science Research Institute, Dr. Jie Chen from Nanjing Forestry University, and Master Huiting Xu from Southwest Forestry University.
Appendix A. Supplementary data
Supplementary data associated with this article can be found, in the online version, at http://doi.org/10.1016/j.fshw.2022.07.027.
- 食品科学与人类健康(英文)的其它文章
- Wine, beer and Chinese Baijiu in relation to cardiovascular health:the impact of moderate drinking
- Comparative analysis of physicochemical properties, ginsenosides content and α-amylase inhibitory effects in white ginseng and red ginsen
- Monitoring and identif ication of spoilage-related microorganisms in braised chicken with modif ied atmosphere packaging during refrigerated storage
- Effect of cooking processes on tilapia aroma and potential umami perception
- Formation mechanisms of ethyl acetate and organic acids in Kluyveromyces marxianus L1-1 in Chinese acid rice soup
- Volatile prof ile and multivariant analysis of Sanhuang chicken breast in combination with Chinese 5-spice blend and garam masala