
Cux1+ proliferative basal cells promote epidermal hyperplasia in chronic dry skin disease identified by single-cell RNA transcriptomics
2023-09-05 00:33MinhuHungNingHuSiyiZhungQiuyunFngJingmingShngZhenWngXiohuToJinguoNiuXingyoLiPeilinYuWeiYng
Minhu Hung ,Ning Hu ,Siyi Zhung ,Qiuyun Fng ,Jingming Shng ,Zhen Wng ,Xiohu To ,Jinguo Niu ,Xingyo Li ,Peilin Yu ,Wei Yng ,,g,*
a Department of Biophysics,and Department of Neurology of the Fourth Affiliated Hospital,Zhejiang University School of Medicine,Hangzhou,310000,China
b Laboratory Medicine Center,Allergy Center,Department of Transfusion Medicine,Zhejiang Provincial People's Hospital,Affiliated People's Hospital,Hangzhou Medical College,Hangzhou,310000,China
c Department of Dermatology,Zhejiang Provincial People's Hospital,Affiliated People's Hospital,Hangzhou Medical College,Hangzhou,310000,China
d Key Laboratory of Craniocerebral Diseases of Ningxia Hui Autonomous Region,Ningxia Medical University,Yinchuan,750000,China
e Department of Neurology of the Fourth Affiliated Hospital,Zhejiang University School of Medicine,Hangzhou,310000,China
f Department of Toxicology,and Department of Medical Oncology of the Second Affiliated Hospital,Zhejiang University School of Medicine,Hangzhou,310000,China
g MOE Frontier Science Center for Brain Research and Brain-Machine Integration,Zhejiang University School of Medicine,Hangzhou,310000,China
Keywords: scRNA-seq Dry skin Proliferative basal cells
ABSTRACT Pathological dry skin is a disturbing and intractable healthcare burden,characterized by epithelial hyperplasia and severe itch.Atopic dermatitis (AD) and psoriasis models with complications of dry skin have been studied using single-cell RNA sequencing(scRNA-seq).However,scRNA-seq analysis of the dry skin mouse model (acetone/ether/water (AEW)-treated model) is still lacking.Here,we used scRNA-seq and in situ hybridization to identify a novel proliferative basal cell (PBC) state that exclusively expresses transcription factor CUT-like homeobox 1 (Cux1).Further in vitro study demonstrated that Cux1 is vital for keratinocyte proliferation by regulating a series of cyclin-dependent kinases (CDKs) and cyclins.Clinically, Cux1+ PBCs were increased in patients with psoriasis,suggesting that Cux1+ PBCs play an important part in epidermal hyperplasia.This study presents a systematic knowledge of the transcriptomic changes in a chronic dry skin mouse model,as well as a potential therapeutic target against dry skin-related dermatoses.
1.Introduction
Dry skin is a common clinical complication of many skin disorders (e.g.,psoriasis and atopic dermatitis (AD)) and systemic diseases (e.g.,chronic kidney or liver diseases and diabetes),resulting in the scaly,thick,and cracked epidermis,damaged barrier function,and severe itch [1].Because of the impaired skin appearance and the persistent itch,patients with pathological skin dryness suffer both psychologically and physically[2].The acetone/ether/water (AEW) treatment induces increased transepidermal water loss,reduced stratum corneum hydration,hyperkeratosis,and elevated scratch behavior,which is a well-established chronic dry skin model and accurately mimics the clinical manifestations in humans [3].Recently,decreased expression of filaggrin,loricrin,and aquaporin 3 has been suggested to participate in the impaired barrier and moisturizing function of the skin in an AEW model[4].However,a systematic and comprehensive study of the pathogenic mechanisms of the AEW model is still lacking.
Accumulative evidence suggests that epidermal hyperplasia is the most obvious histological feature of the AEW model and other dry skin-related diseases,which is mainly attributed to the hyperproliferation of keratinocytes (KC) in the pathological processes[5-7].The delicate regulation of proliferation,differentiation,and desquamation of KC is important for the maintenance of normal skin structure and function [8,9].In contrast to the extensive reports on the composition and function of KC in inflammation,wound healing,tumors,and aging [10-13],a transcriptomic analysis of KC in skin dryness at the single-cell resolution has been largely neglected.Recent studies suggest that the dysregulation of transcription factors (TFs) and cytokines may lead to the hyperproliferation of KC in dry skin conditions [14-17].However,understanding how these modulating factors work together to affect the cellular behavior of KC is still limited.Further investigation into the molecular mechanisms of excessive proliferation of KC may be beneficial in skin homeostasis restoration and dry skin alleviation.
Considering the heterogeneity of KC composition,we performed single-cell RNA sequencing(scRNA-seq)analysis on both Water and AEW-treated mouse skin and classified KC into five subpopulations.We found that AEW treatment altered the differentiation process and cell-cell communication patterns of KC.Compared to the Water groups,the number ofCux1+proliferation basal cells (PBC) was significantly increased in the AEW groups.Cux1+PBC showed enhanced proliferative potential,which may induce KC hyperproliferation through elevated cyclin-dependent kinases (CDKs)and cyclins.Taken together,this study presents a full-scale understanding of the AEW chronic dry skin model and suggests a novel molecular target for the treatment of dry skin.
2.Material and methods
2.1.Dry skin model
Eight-to ten-week-old C57BL/6J male mice were bought from SLAC Laboratory Animal Co.,Ltd (Shanghai,China).Five to six animals were housed per cage,fed under a 12:12-h light-dark cycle at 23-25°C,and given ad libitum access to water and food.Three days before treatment,the upper-back neck skin of the mice was shaved.Then,they were treated twice daily (10:00 a.m.and 06:00 p.m.)consecutively for 7 days with cotton pads (approximately 2 cm×3 cm)immersed in 1:1(V/V)acetone and ether mix solution for 15 s and immediately changed to a new cotton pad immersed in water for 30 s (AEW groups).Otherwise,mice were treated with water for 45 s(Water groups).All procedures were approved by the Animal Advisory Committee at Zhejiang University (Approval number: 21625),following the US National Institutes of Health Guidelines for the Care and Use of Laboratory Animals.
2.2.Human skin samples
Human skin samples from psoriasis patients and healthy control were from Zhejiang Provincial People's Hospital.All procedures were performed in compliance with relevant laws and institutional guidelines with ethical approval (Approval number: QT2022116)for researcher-initiated clinical research.The donors (or their relatives)of the samples used in this study provided written informed consent.
2.3.Single-cell isolation for scRNA-seq
Mice were anesthetized by intraperitoneal injection of 5%chloral hydrate and removed the residual hair by depilatory cream.About 2 cm × 3 cm back neck skin was cut off and carefully removed the subcutaneous fatty tissue.Skin tissue was digested with 4 mg/mL dispaseII(Sigma-Aldrich,St.Louis,MO,USA)in CNT-07 culture medium (CELLnTEC,Bern,Switzerland) for 15 h in 4°C refrigerator on a horizon shaker.After primary digestion,the skin was separated from the dermis with the epidermis.Both dermis and epidermis were digested with 3 mg/mL collagenase A (Roche Diagnostics GmbH Co.,Ltd.,Mannheim,Germany) with 50 U/mL DnaseI (Sangon Biotech Co.,Ltd.,Shanghai,China) in CNT-07 for 1.5 h in 37°C water bath with several times upside down mixing.The secondary digestion solution was transferred to 70 μm filter and then 40 μm filter.The filtered cell solution was centrifuged for 5 min at 1200 rpm twice.Finally,the cell pellet was diluted to the appropriate concentration by CNT-07.
2.4.ScRNA-seq data processing
The R package Seurat(version 4.0.5;http://satijalab.org/seurat/)[18] was used to explore scRNA-seq data in this study.We further eliminated >20% of the low-quality cells that belong to mitochondrial genes.Before performing the principal component analysis(PCA) on the standardized expression matrix,we identified,centralized,and scaled the top 2,000 highly variable genes(HVG)in the standardized expression matrix.We used the DoubletFinder[19]R package(version 2.0.3)to filter potential doublets.A total of 42,738 filtered cells were used for further bioinformatic analysis.To avoid batch effects among experiments and samples,we used canonical correlation analysis (CCA) [20] to process the data.The batch-corrected data were only used for PCA and all other PCAdependent steps.Other analyses were based on the normalized data without batch correction.
2.5.Dimensionality reduction and cell-type annotation
The data was projected onto two-dimensional space using uniform manifold approximation and projection(UMAP)on the top 20 principal components.According to the co-expression features,the cells were clustered using the Find Clusters function(resolution of 0.4).We used the FindAllMarkers function with parameters log2FC.threshold=0.45 and test.use=“wilcox” in Seurat to find unique markers for identified clusters.Clusters were classified and annotated based on expressions of canonical markers for specific cell types.To identify differentially expressed genes (DEGs) between two clusters,we used the FindMarkers function of the Seurat with log2FC.threshold=0.45 and test.use=“wilcox”.
2.6.Defining cell state scores
The AddModuleScore function of the Seurat R package was applied to score the gene expression degree at the single-cell level[21,22].The cell scores were based on the average expression of the genes from the predefined gene set in the respective cells.Gene sets were obtained from the MSigDB database[23](https://www.gseamsigdb.org/gsea/msigdb/).We used HALLMARK_INFLAMMA TORY_RESPONSE,GOBP_RESPONSE_TO_OXIDATIVE_STRESS(GO:0006979),GOBP_KERATINIZATION(GO:0031424),and GOBP_KERATINOCYTE_PROLIFERATION(GO:0043616) to define the inflammatory response,response to oxidative stress,keratinization,and keratinocyte proliferation,respectively.
2.7.Gene Ontology (GO) enrichment analysis and Gene Set Enrichment Analyses (GSEA)
GSEA and GO functional enrichment (over-representation) of DEGs atP<0.05 were analyzed using the R package clusterProfiler version 3.18.1 [24].A cutoff-adjustedPvalue of 0.05 was used to filter the significant enrichment results.
2.8.Cell-cycle discrimination analysis
Using the scoring method outlined in the CellCycleScoring function of the Seurat R package,a cell cycle phase(G1,S,or G2/M)was assigned for each cell based on the expression of its S or G2/M phase genes,including a previously identified core set of 43 S and 54 G2/M genes [21].
2.9.Pseudotime analysis of single cells
Pseudotime trajectory analysis in keratinocytes was generated using R package Monocle(version 2.18.0)[25].Cells were clustered in Seurat and cluster markers were used as input into Monocle to infer differentiation relationships among subclusters of keratinocytes.Specifically,UMAP embeddings and cell subclusters generated from Seurat were converted into cell_dataset objects and then used as input to perform trajectory graph learning and pseudotime measurement with Monocle through independent component analysis (ICA).Cluster marker genes identified were performed to generate a pseudotime route and plotted using the‘plot_pseudotime_heatmap’ function.
SCORPIUS algorithm was applied to infer trajectories in a purely data-driven way and could cross-validate with the results from the Monocle algorithm.
The CytoTRACE score of keratinocytes was calculated using the R package CytoTRACE v0.3.3.The CytoTRACE algorithm can be used to calculate the expression level of genes with the highest correlation with single-cell gene counts of scRNA-Seq data.CytoTRACE algorithm can give each cell a score representing its stemness in a given dataset.CytoTRACE scores ranged from 0 to 1,whereas higher scores indicated higher stemness(less differentiation)and vice versa.
2.10.Transcriptional regulatory network analysis
The GENIE3(version 1.12.0)[26]and RcisTarget(version 1.10.1)R packages in the SCENIC (version 1.2.4) [27] workflow were used to analyze the transcriptional regulatory network with default parameters.The TFs of mm9 were used as reference TFs and downloaded using RcisTarget.The gene expression matrix of the PBC was normalized from Seurat as the input.Firstly,co-expression modules between TFs and the potential target genes were identified through GENIE3 based on the expression matrix.Secondly,for each coexpression module,cis-regulatory motif enrichment analysis was performed among all potential target genes by RcisTarget,and only the target genes enriched with the motifs of the corresponding TFs were selected as direct target genes.Each TF and its direct target genes were defined as a regulon.Finally,the gene regulatory networks of the two subclusters were inferred.
2.11.Cell communication analysis
To systematically analyze the potential cellular communication patterns between PBC and other cell types,CellChat was used to analyze the strength of receptor and ligand interactions.CellChat identified differentially expressed ligands and receptors in PBC and other different cell populations,calculated the probability of each interaction according to the law of mass interaction,then passed the random permutation test,and constructed a weighted directed graph to represent the communication network.
2.12.Hematoxylin and eosin (HE) staining
HE staining was conducted by core facilities at Zhejiang University School of Medicine.Briefly,the skin sections were deparaffinized,rehydrated,washed in distilled water,and then stained in hematoxylin solution for 15 min.The slides were washed for 10 s and differentiated in acidic ethanol for 5-10 s.The slides were washed for 5 min and stained in eosin for 1 min.Finally,the slides were washed for 5 s,dehydrated sequentially in 70%-100%ethyl alcohol,cleared in xylene for 1 min,and mounted with neutral resins.
2.13.Masson's staining
Masson's staining was conducted by core facilities,Zhejiang university school of medicine.Briefly,the skin sections were deparaffinized,rehydrated,and washed in distilled water.The slides were stained in the Weigert's iron hematoxylin staining solution for 5-10 min and differentiated in acidic ethanol for 5-15 s.The slides were washed and stained in the Masson blue staining solution for 3-5 min.The slides were washed and stained in the Ponceau acid fuchsin staining solution for 5-10 min.The slides were washed in the phosphomolybdic-phosphotungstic acid solution for 1-2 min and the weak acid solution for 1 min.The slides were directly stained in the aniline blue solution for 1-2 min and washed in weak acid solution for 1 min.The slides were dehydrated in 95% ethyl alcohol for 2-3 s and 100% ethyl alcohol 3 times,each time for 5-10 s.Finally,the slides were cleared in xylene 3 times,each time for 1-2 min,and mounted with neutral resins.
2.14.In situ hybridization and immunofluorescence staining
The RNAScope®Multiplex fluorescence V2 system (Advanced Cell Diagnostics,Inc.,Newark,CA,USA) was applied to in situ hybridization according to the manufacturer's instructions.Briefly,10 μm paraffin skin sections from the AEW and Water groups were deparaffinized,rehydrated,washed in diethylpyrocarbonate(DEPC)distilled water,and stained with the following probes: mouse-Col17a1 (552141-C1;Advanced Cell Diagnostics) and mouse-Cux1(442931-C2;Advanced Cell Diagnostics).After completing RNAScope,the skin sections were immediately subjected to Ki67(ab15580,1:250;Abcam,Waltham,MA,USA)immunofluorescence staining.The fluorescence intensities of Col17a1 and Cux1 in proliferating basal cells (stained positive for anti-Ki67 antibody in the epidermis)were quantified in both the AEW and Water groups.For skin sections from patients with psoriasis,we performed double immunofluorescence staining with Ki67 (ab15580,1:250;Abcam) and Cux1 (sc-514008,1:100;Santa Cruz Biotechnology,Inc.,Dallas,TX,USA).
2.15.Cell culture
The HaCaT cell line,an immortalized human keratinocyte(CTCC-002-0012) was purchased from Meisen CTCC Co.,Ltd.(Hangzhou,China).Cells were cultured in high glucose Dulbecco's modified Eagle's medium (DMEM) medium (Sigma-Aldrich) supplied with penicillin/streptomycin (Beyotime Biotech Inc.,Shanghai,China) and 10% fetal bovine serum (FBS;Pan Biotech,Bavaria,Germany) in 5% CO2at 37°C incubator.
2.16.Lentivirus infection
The shRNA for human CUX1 based on the previous study [28]was packaged into lentivirus by GenePharma Co.,Ltd.(Shanghai,China).Cells were transfected with lentivirus carrying shRNA-CUX1 or negative control sequences for 24 h and then cultured in a new DMEM medium for 48 h.Stable cells line was screened by 1.5 μM puromycin (MedChemExpress,Monmouth Junction,NJ,USA) for more than 48 h.The shRNA sequences are listed as follows.
LV3-CUX1 human: 5′-AAGAAGAACACTCCAGAGGATTT-3’;
LV3-NC: 5′-TTCTCCGAACGTGTCACGT-3’.
2.17.Real-time quantitative polymerase chain reaction (RT-PCR)
The total RNA of cells was collected by using FastPure®Cell/Tissue Total RNA isolation Kit V2(Vazyme Biotech Co.,Ltd.,Nanjing,China) according to the manufacturer's protocol.cDNA was synthesized by using PrimeScript®RT reagent Kit with gDNA Eraser(Takara Biotech Inc.,Shiga,Japan) according to the manufacturer's protocol.RT-PCR was conducted using the ChamQ Universal SYBR qPCR Master Mix (Vazyme) on a 7500 fast Real-Time PCR system(Applied Biosystems Inc.,Foster City,CA,USA).The primers were obtained from Sunya (Hangzhou,China).All the primers used in this paper are showed in Table S1.The relative mRNA expression level was normalized to reference gene expression level by using the 2-ΔΔCt method.
2.18.Cell proliferation assay
In 96-well plates,HaCaT cells were plated and continuously cultured for 24 h.At 0,24,48,72 h,the original medium in each well was replaced by 100 μL cell counting kit-8 (CCK-8) (Fude Biotech Co.,Ltd.,Hangzhou,China) mix solution.Cells were incubated at 37°C for 4 h.A microplate reader was used to determine each well's absorbance value at 450 nm.
2.19.Clone formation assay
In 6-well plates,20,000 HaCaT cells were plated and cultured continuously for 14 days.Cells were labeled with 1% crystal violet solution for 25 min after being washed twice with phosphate buffered saline (PBS) and fixed with 4% paraformaldehyde (PFA) solution for 15 min.After the cells were fully air-dried,a camera was used to capture the image of each well.
2.20.Cell cycle distribution analysis
In 6-well plates,HaCaT cells were plated and continuously cultured for 24 h.Cells were trypsinized and harvested in an EP tube.After being washed by PBS,the cells were stained in 1 mL DNA staining solution with 10 μL permeabilization solution (MulitiSciences Biotech CO.,Ltd.,Hangzhou,China) for 30 min at room temperature,then 10,000 cells of each sample were analyzed by FACS instrument (ACEA Biosciences,Inc.,San Diego,CA,USA) and NovoExpress®software.
2.21.Statistics analyses
GraphPad Prism8 was used for statistical analyses (GraphPad,San Diego,CA,USA).The comparisons between the two groups were performed by unpaired two-tailed Student'st-test.Percentage comparison was performed by the chi-square test.Gene set score analysis was performed by two-sided Wilcoxon ranksum tests.Data are presented as the mean ± standard error of mean (SEM) withPvalues lower than 0.05 considered statistically significant,*P< 0.05,**P< 0.01,***P< 0.001 and****P<0.0001,respectively.
3.Results
3.1.Identification of cell types in dry skin of the AEW mouse model based scRNA-seq data
The back skin of mice treated with Water and AEW was sampled.The HE staining results revealed that the epidermal thickness in the AEW groups was remarkably increased,compared to the Water groups.Additionally,the epidermis of the AEW groups showed significant (Fig.S1A),as previously reported [3-6].However,Masson's staining results showed that the dermal collagen density of the AEW groups was not significantly different from that of the Water groups (Fig.S1B).These results suggest that AEW treatment mainly impaired the epidermal structure.
To systematically dissect the transcriptomic differences between homeostasis and chronic dry skin at the single-cell level,we carried out scRNA-seq on two biological mixed samples from each group,and each mixed sample contained three mice (Fig.1A).After quality control,we obtained 18,578 cells in the AEW groups and 24,160 cells in the Water groups for downstream analysis (Figs.S1C and D).In addition to preprocessing,integrating samples,and conducting principal component analysis,graph-based UMAP was used to partition high-quality cells into eight clusters (Fig.1B).We defined eight cell clusters based on their well-known specific markers,including fibroblasts (FIB,Dcn+),keratinocytes (KC,Krt10+,andKrt14+),myeloid cells (MYL,Cd74+),T cells (TC,Cd3g+),adipocytes(ADI,Scd1+),endothelial cells (ENDO,Pecam1+),mast cells (MC,Mcpt1+),and vascular smooth muscle cells (vSMC,Acta1+)(Figs.1C and D).By analyzing the AEW and Water groups separately,we also observed the above eight cell clusters and none of the novel cell populations in the AEW groups during the first level clustering(Fig.1E).By comparison,the AEW groups showed an increased average percentage in MYL,but decreased average percentage in KC and vSMC(Fig.1F).We also analyzed four samples from the AEW and Water groups separately,inwhich we still observedeightcellclusters,together with a quantitatively similar average percentage of each one to that observed in the combined examination(Figs.S1E and F).
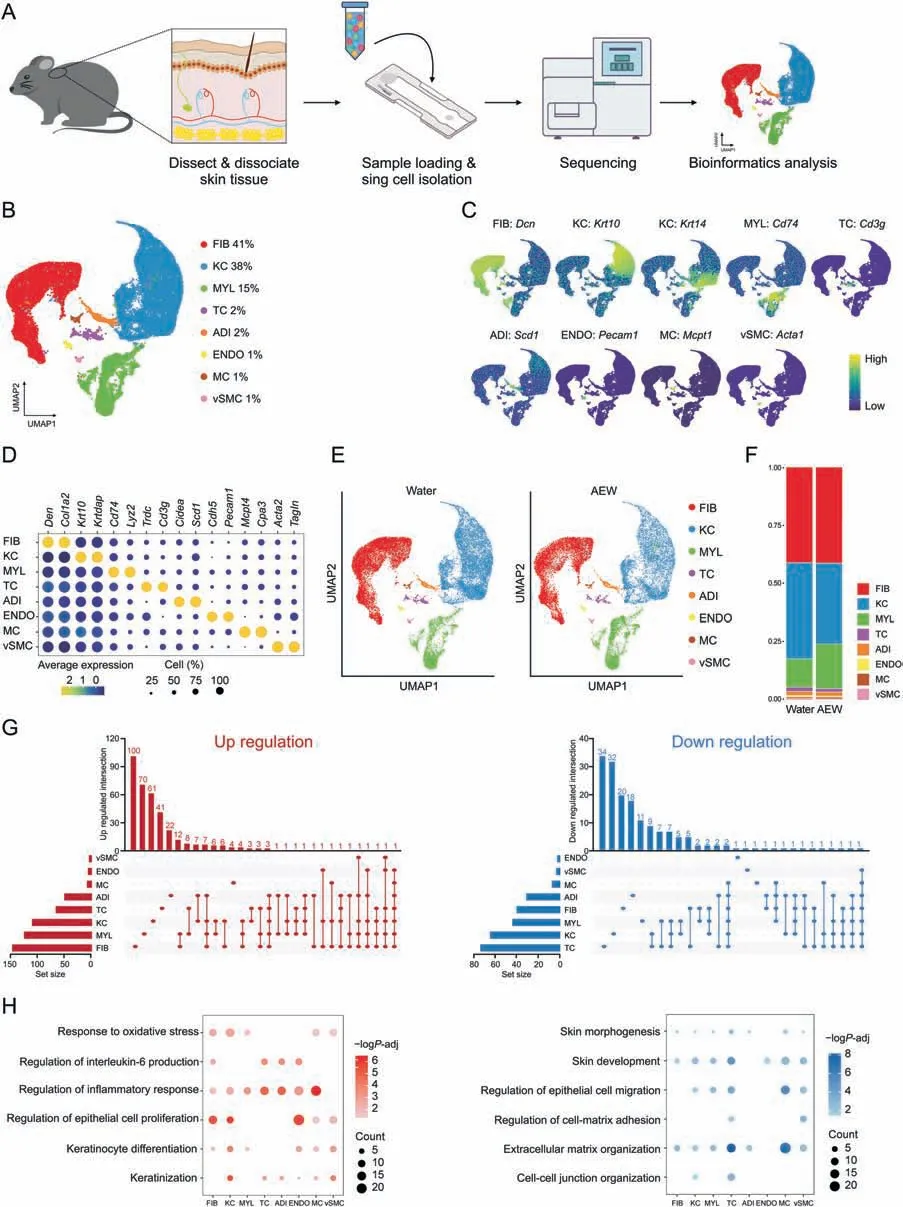
Fig.1.Cell type identification by single-cell RNA sequencing(scRNA-seq)analysis of dry skin in mice.(A)Diagram of the scRNA-seq process in Water-and AEW-treated mice skin samples.(B) Uniform manifold approximation and projection (UMAP) plots for cellular heterogeneity with eight distinct cell clusters identified and color-coded among the total samples.The general identity of each cell cluster is annotated to the right and the percentage of each cell cluster per total cell number is indicated.(C) Normalized expression of marker genes is color coded and projected on the UMAP plot to identify each cell cluster.(D)Dot plot showing the average expression of representative marker genes for each cell type.(E)Separated UMAP plot for Water and AEW datasets;each dot corresponds to a single cell,colored according to cell type.(F)Average cell percentage of each cell type derived from Water and AEW groups.(G) UpSet plot showing the integrated comparative analysis of upregulated differentially expressed genes (DEGs) (left) and downregulated DEGs(right)in major cell types between Water and AEW groups.Up-regulated DEGs:upregulated in AEW group,downregulated in Water group;down-regulated DEGs:upregulated in Water group,downregulated in AEW group.(H)Representative Gene Ontology(GO)terms and pathways enriched in upregulated DEGs(left)and downregulated DEGs(right)based on functional enrichment analysis in different skin cell types.“Count”indicates gene number.The color keys from pink to red(left)or from gray to blue(right)indicate the range of P-values.AEW: acetone/ether/water;FIB: fibroblasts;KC: keratinocytes;MYL: myeloid cells;TC: T cells;ADI: adipocytes;ENDO: endothelial cells;MC: mast cells;vSMC: vascular smooth muscle cells.
We further analyzed the differentially expressed genes(DEGs,|avg log2FC| >0.4 andPadj <0.05) in each cell type (Fig.1G,Table S2).According to DEGs unique to each cell type,FIB,MYL,and KC ranked highest in up-regulation,with 100,70,and 61 DEGs,respectively.By comparison,TC,KC,and MYL ranked highest in down-regulation,with 34,32,and 20 DEGs,respectively.GO analysis revealed that AEW treatment increased DEGs associated with the regulation of the inflammatory response and the regulation of epithelial cell proliferation,while the decreased DEGs were associated with the skin development and the extracellular matrix(ECM) organization (Fig.1H).All cell types of the AEW groups highly expressed inflammatory response genes (Fig.S2A).In contrast,with the exception of ENDO,the other cell types in the AEW groups less expressed ECM organization genes(Fig.S2B).For example,Cma1,the marker gene of MC encodes the chymase-1 protein,and MC infiltration contributes to inflammatory skin diseases like AD[29].Cma1was significantly increased in MC of AEW groups(Fig.S2C).Genes involved in ECM protein production,such asAebp1[30]andLrp1[31],were significantly decreased in the FIB of AEW groups (Fig.S2D).These results indicated that DEGs associated with dry skin were mainly identified in KC and MYL,underlining the role of such cell types in skin dryness.
3.2.Transcriptional classification of mouse keratinocytes into five subpopulations
The dysfunction of KC under dehydration is proposed as the trigger of dry skin.Therefore,we next analyzed KC for moredetailed profiling.All KC were re-clustered into five subpopulations,including spinous cells (SC,Krt1+),basal cells (BC,Krt14+),sebaceous gland cells(SGC,Krt79+),proliferative basal cells(PBC,Mki67+),and granule cells (GC,Lor+) (Figs.2A-C).Both the Water and AEW groups shared the above five clusters of KC(Fig.2D).By comparing the distribution of each KC subpopulation,we found that the AEW group demonstrated increased proportions of PBC and decreased proportions of SC and SGC compared to those in Water group(Fig.2E).
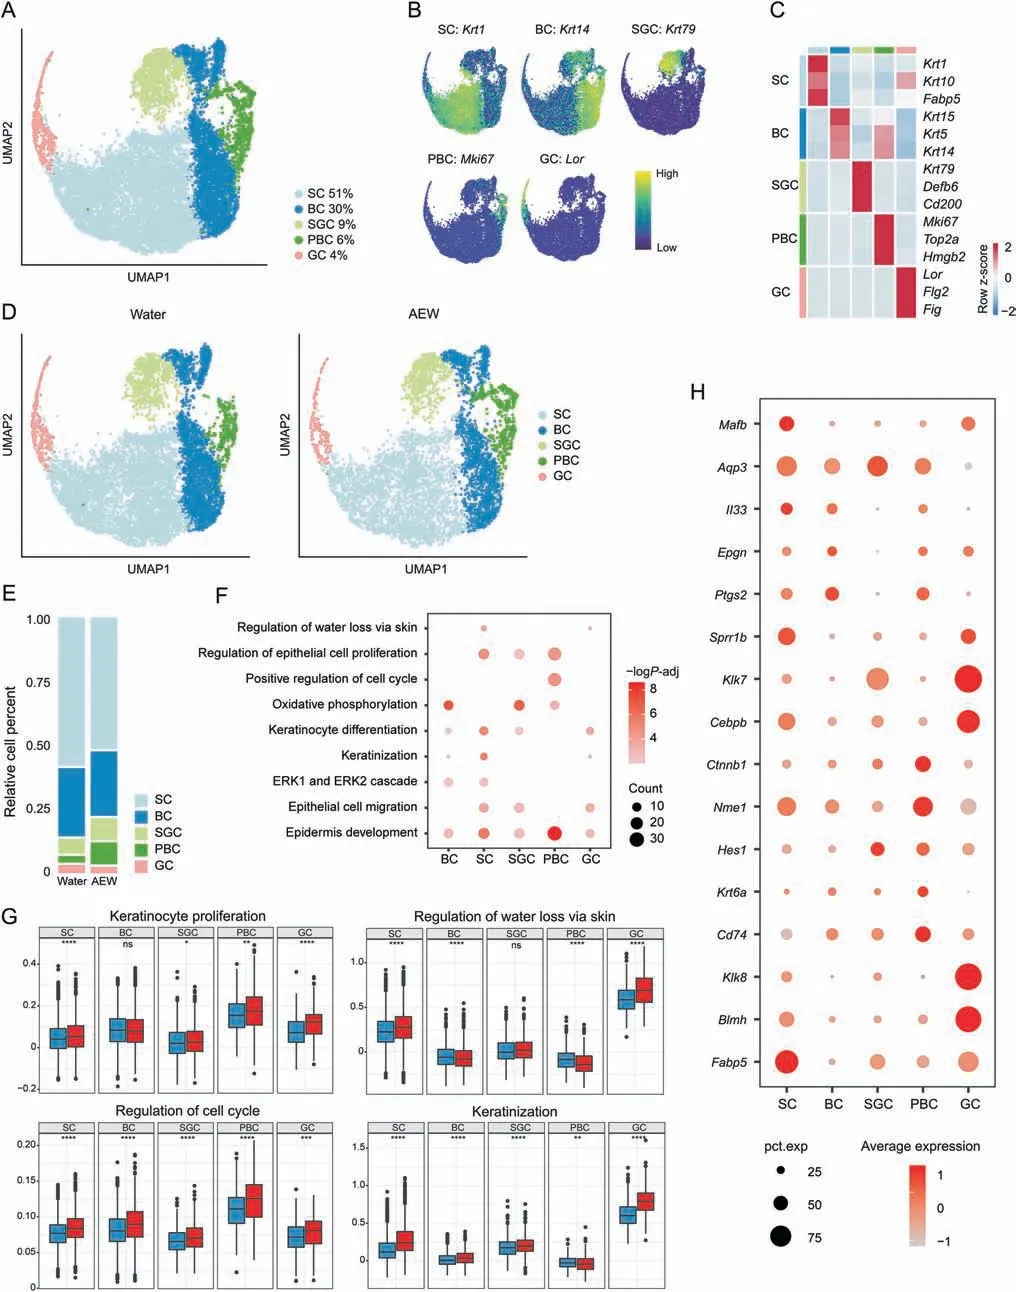
Fig.2.Transcriptional classification of mouse keratinocytes into five subpopulations.(A)Uniform manifold approximation and projection(UMAP)plot for further subclustered five keratinocyte(KC)subpopulations and color-coded in total samples.General identity of each subpopulation is annotated to the right and the percentage of each cell clusters per total cell number is indicated.(B)Normalized expression of marker genes is color coded and projected on the UMAP plot to identify each subpopulation.(C)Dot plot shows the average expression of representative marker genes for each subpopulation.(D)Separated UMAP plot for Water and AEW datasets.Each dot corresponds to a single cell,colored according to subpopulation type.(E)Average cell percentage of each subpopulation derived from Water and AEW groups.(F)Representative Gene Ontology(GO)terms and pathways enriched in up-regulated differentially expressed genes (DEGs) based on functional enrichment analysis in different KC subpopulations.“Count” indicates gene number.The color keys from pink to red indicate the range of P value.(G)Gene set score analysis of different GO biological process terms in various KC subpopulations of both Water and AEW groups.Horizontal lines represent median values,with whiskers extending to the farthest data point within a maximum of 1.5×interquartile range.Two sides Wilcoxon rank-sum is used to determine the statistical significance,*P <0.05,**P <0.01,***P <0.001,****P <0.0001,ns:not significant.(H)Dot plots showing the up-regulated genes in different KC subpopulations between Water and AEW groups shared by at least three subpopulations.The node size positively correlates with the percentage of certain subpopulations.The color key from gray to red indicates low to high gene expression levels.AEW:acetone/ether/water;SC:spinous cells;BC:basal cells;SGC:sebaceous gland cells;PBC:proliferative basal cells;GC:granule cells.
The up-regulated DEGs in KC were mainly related to the regulation of water loss via skin,keratinization,and epidermis development(Fig.2F).Accordingly,genes associated with the regulation of water loss via skin and keratinization showed the highest scores and a remarkable increase in GC.Moreover,genes associated with KC proliferation and positive regulation of the cell cycle showed the highest scores and a remarkable increase in PBC (Fig.2G).Moreover,downregulated DEGs in KC were mainly involved in ECM organization and tight junction (TJ) organization (Fig.S3A).TJ organization-related genes were decreased in SC,BC,and GC,while ECM-related genes were decreased in all types of KC(Figs.S3B-E).
Further analysis of selected upregulated DEGs of KC revealed that the AEW dry skin model shared many similar transcriptional features with other skin diseases.Fabp5is one kind of fatty acid binding protein that responds to chemical-induced skin inflammation and tumorigenesis [32].Cd74,the macrophage migration inhibitory factor(MIF)receptor,is enhanced in the KC of systemic sclerosis and may be associated with the proinflammatory pathways [33].Il33,a well-known type two inflammatory cytokine,has a higher expression rate in the KC of AD [34].All of the above-increased gene expression highlights that the skin of AEW model mice undergoes a severe inflammatory response.KC proliferation-,differentiation-,and migration-associated genes,includingKrt6a,Hes1,Ctnbp1,Cebpb,Aqp3,andMafb,were also upregulated in the AEW model,revealing the potential for accelerated cell development(Fig.2H).
3.3.Pseudotime trajectory analysis reveals keratinocyte differentiation dynamics in dry skin
To investigate whether dry skin conditions affect epidermal development,we applied pseudotime trajectory analysis to reveal the KC differentiation pathway.We observed that all five subpopulations of KC in the AEW groups were arranged into one trajectory,from PBC,BC,SC,to GC,with no bifurcations (Figs.3A and S4A).We also performed SCORPIUS [35],a newly published method for purely data-driven trajectory inference,to verify the above differentiation trajectories of KC,and obtained a consistent developmental trajectory (Fig.S4B).The cell expression proliferation markerMki67was mainly distributed at the beginning of the trajectory,the keratin genesKrt14andKrt11were distributed in the middle,and the loricrin geneLorwas distributed at the end (Fig.3B).We then identified 327 pseudotime-dependent genes from all KC of AEW groups,which changed significantly during different phases(Fig.3C).Genes related to specific biological processes were highly expressed in each transitional period.The PBC state was defined by cluster 1 gene sets,related to DNA packaging,cellular response to DNA damage stimulus,and cell cycle process;the BC state was defined by cluster 2 gene sets,related to skin development,ECM organization,and positive regulation of cell migration;the SC state was defined by cluster 3 gene sets,related to skin development,regulation of water loss via skin,and response to wound;and the GC state was defined by cluster 4 gene sets,related to epidermis development,formation of the cornified envelope,and establishment of the skin barrier.These pseudotime-associated genes included secreted factors (Fig.S4C),ECM (Fig.S4D),and TFs(Fig.S4E).We also found that 58 upregulated-DEGs and 31 downregulated-DEGs in KC of AEW groups were pseudotimedependent genes (Figs.3D and E).Taken together,pseudotime analysis established a basis for exploring KC differentiationregulated programs in the AEW model.
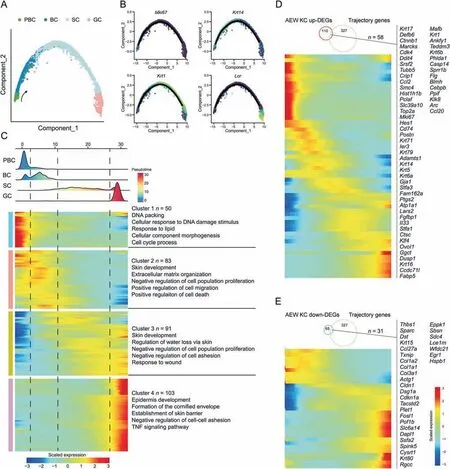
Fig.3.Pseudotime trajectories analysis reveals keratinocyte differentiation dynamics in dry skin.(A)Trajectory reconstruction based on the PBC,BC,SC and GC subpopulations of AEW-treated epidermal cells captures a linear pseudotime progression.Black arrow indicates the development direction.(B) PBC,BC,SC and GC subpopulations marker gene expression across the linear pseudotime progression.(C) Heatmap showing the differentially expressed genes (rows) along the pseudotime (columns) are hierarchically clustered into four clusters.The representative annotated pathways of each cluster are annotated.(D) Expression level heatmap of 58 shared genes between upregulated DEGs in KC subpopulations of AEW group and trajectory-associated genes.(E)Expression level heatmap of 31 shared genes between downregulated DEGs in KC subpopulations of AEW group and trajectory-associated genes.PBC: proliferation basal cell;BC: basal cell;SC: spinous cell;GC: granule cell;AEW: acetone/ether/water;KC: keratinocyte;DEGs: differentially expressed genes;TNF: tumor necrosis factor.
3.4.Novel Cux1-positive PBC state in dry skin
In the AEW skin,the ratio of epidermal Ki67+cells was significantly higher (Fig.S5A),therefore we further investigated the heterogeneity and transcriptional profiles of PBC in the AEW model.We re-analyzed PBC and found that they could be classified into two states (Col17a1hiandCux1hi) (Fig.4A).TheCol17a1histate was characterized byAnxa2,a gene encoding cell surface annexins,andCol17a1,a marker gene of epidermal stem/progenitor cells[11].TheCux1histate was characterized bySlc39a1,a gene encoding zinc ion transmembrane transporter,andCux1,a gene encoding a cell cyclerelated transcription factor [36] (Figs.4B,4C,and S5B).Cux1hiPBC mainly existed in the AEW group(Fig.4D).We then used RNAScope to investigate the existence of the two PBC states in the epidermis.Colocalization analysis of theCol17a1RNA probe with Ki67 protein revealed that approximately 40%of the PBC expressedCol17a1,but AEW treatment did not affect the cell percentage ofCol17a1hiPBC.Colocalization analysis of theCux1RNA probe with Ki67 protein revealed that approximately 28% of the PBC expressedCux1,but AEW treatment significantly elevated the cell percentage ofCux1hiPBC (Fig.4E).Different pseudotime analysis methods (SCORPIUS and CytoTrace) showed that theCol17a1hiPBC had a higher development order thanCux1hiPBC,implying the developmental trajectories from theCol17a1histate to theCux1histate in the AEW model (Figs.4F and G).Therefore,our data demonstrated a novel and dry skin provocativeCux1hiPBC state.
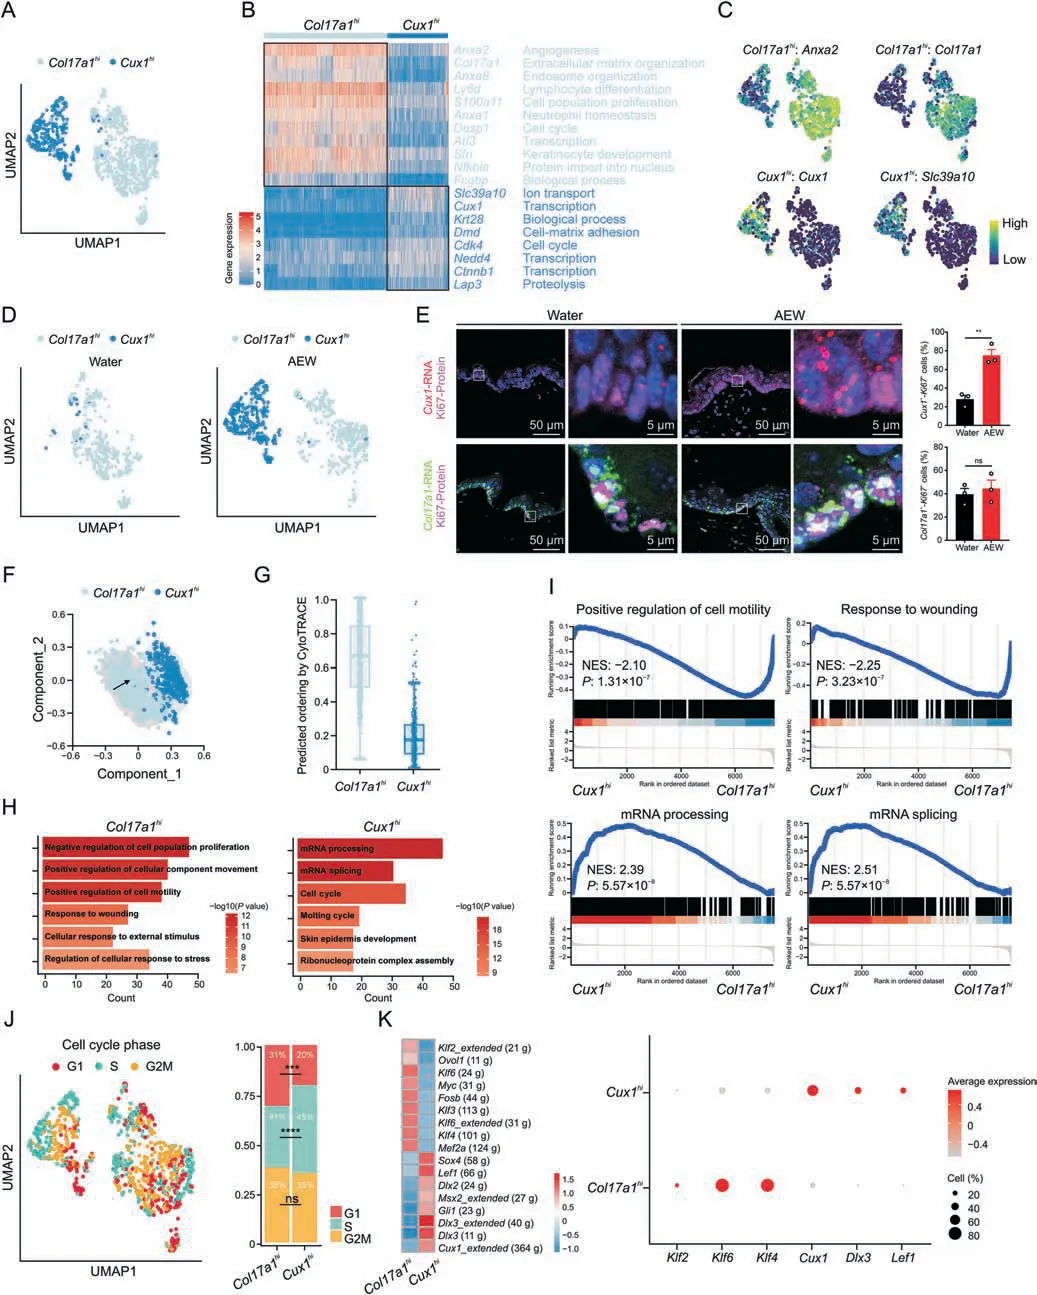
Fig.4.Novel CUT-like homeobox 1 (Cux1)-positive proliferative basal cells (PBC) subpopulation in dry skin.(A) Uniform manifold approximation and projection (UMAP) plot for further subclustered two PBC subpopulations and color-coded in total samples.General identity of each subpopulation is annotated to the right.(B) Heatmap showing the scaled expression levels of representative genes highly expressed in Col17a1hi PBC or Cux1hi PBC.The color key from blue to red indicates low to high gene expression levels.Genes related annotated pathways are listed to the right.(C)Normalized expression of marker genes is color coded and projected on the UMAP plot to identify each PBC clusters.(D) Separated UMAP plot for Col17a1hi PBC and Cux1hi PBC in both Water and AEW datasets.Each dot corresponds to a single cell,colored according to cell type.Black arrow represents cell development direction.(E)RNAScope data showing spatial distribution of Cux1 RNA and Ki67 protein,Col17a1 RNA and Ki67 protein in both Water-and AEW-treated skin.Enlarged image of the white boxed area is shown at the right to highlight the detail of positive cells.Histogram represents statistical result of the percentage of positive cells,n=3 mice for each group.Data are presented as mean ± standard error of mean.Student's t-test was used to determine the statistical significance,**P <0.01,ns: not significant.(F) Results of trajectory analysis of Col17a1hi and Cux1hi PBC,colored by subpopulations.(G) Box plots showing CytoTRACE values for Col17a1hi and Cux1hi PBC.(H) Gene Ontology biological process enrichment analysis of up-regulated differentially expressed genes in Col17a1hi and Cux1hi PBC.(I)Gene set enrichment analysis plots for representative signaling pathways upregulated in the Col17a1hi and Cux1hi PBC(NES:normalized enrichment score,corrected for multiple comparisons using false discovery rate method,P value is shown in plots).(J)UMAP plot showing PBC colored by the cell cycle phase positioning.Cells in G1 phase are colored red,S phase are green and G2/M phase are yellow.Bar graph representing the proportion of each cell cycle stage in Col17a1hi and Cux1hi PBC.Chi-square was used to determine the statistical significance,***P <0.001,****P <0.0001,ns: not significant.(K)Heatmap showing the area under the curve scores of average expression regulation by transcription factors,as estimated using SCENIC,for Col17a1hi and Cux1hi PBC.Dot plots showing average expression levels of representative transcription factor genes.The node size positively correlates with the percentage of certain type of PBC subpopulation.The color key from gray to red indicates low to high gene expression levels.AEW: acetone/ether/water.
The two PBC states also revealed distinct transcriptional features.GO and GSEA analyses suggested that positive regulation of cell motility and response to wounding pathways are enriched inCol17a1hiPBC,while mRNA processing and mRNA splicing are enriched inCux1hiPBC (Figs.4H and I).Col17a1hiPBC had higher scores in differentiation,development,and migration,whileCux1hiPBC had a higher score in proliferation (Fig.S5C).We further assigned the cell cycle phase of individual PBC [37],revealing a remarkably decreasedCux1hiPBC in the G1 phase and an increasedCux1hiPBC in the S phase (Fig.4J).Cell cycle-related genes likeCcna2,Ccnb2,Ccnd1,Ccnd2,Cdk1,andCdk4had higher level inCux1hiPBC(Fig.S5D).Overall,these data indicated thatCux1hiPBC has stronger proliferation activity,which may account for the epidermal hyperplasia in dry skin diseases.
As TFs have a key role in cell proliferation,we next performed SCENIC analysis for both PBC states and found the existence of preferential TFs (Fig.4K).Klf2,Klf4,andKlf6were found to be the key TFs inCol17a1hiPBC,whileCux1,Dlx3,andLef1were the predominant TFs inCux1hiPBC.Hence,our data revealed that the predominant TFs inCux1hiPBC may be a critical regulator of PBC hyperproliferation in the AEW model.
3.5.Potential ligand-receptor interactions between PBC with other cells in dry skin
To investigate potential intercellular communication patterns between PBC and other cell types,we performed CellChat analysis on our scRNA-seq dataset.CellChat detected 22 significant secreted signaling pathways in both AEW and Water groups(Figs.5A and B).8 signaling pathways,including C-X-C motif chemokine ligand(CXCL),insulin-like growth factor (IGF),protein S (PROS),pleiotrophin (PTN),granulin precursor (GRN),C-C motif chemokine ligand (CCL),fibroblast growth factor (FGF) and growth arrestspecific gene (GAS) revealed similar information flow between Water and AEW groups,indicating that they are the equal role in the skin biology function in both treatments.Meanwhile,other 14 signaling pathways significantly changed their information flow in the AEW groups compared with the Water groups: increased pathways like tumor necrosis factor (TNF),visfatin,vascular endothelial growth factor (VEGF),interleukin-6 (IL6),bone morphogenetic protein(BMP),kit,complement,MIF,transforming growth factor beta (TGFβ),epidermal growth factor (EGF),and galectin;decreased pathways like colony stimulating factor (CSF),calcitonin receptor (CALCR),and angiopoietin-like protein(ANGPTL)(Fig.5C).Next,we specially analyzed the role ofCol17a1hiPBC andCux1hiPBC in TNF,VEGF,BMP,and EGF signaling pathways(Figs.5D-H).BothCol17a1hiPBC andCux1hiPBC expressed receptorTnfrsf1ato receive theTnfsignal from MC.Col17a1hiPBC was the major source ofVegfaand the only receiver wasFlt1in ENDO.BothBmp2andHbegffunctioned in both autocrine and paracrine manner.Col17a1hiPBC was both sender and receiver,whileCux1hiPBC merely functioned as the receiver by expressingBmpr1a,Bmpr2,andEgfr.Overall,the above results imply that AEW treatment could affect the biological function of PBC by regulating cellcell signaling networks.
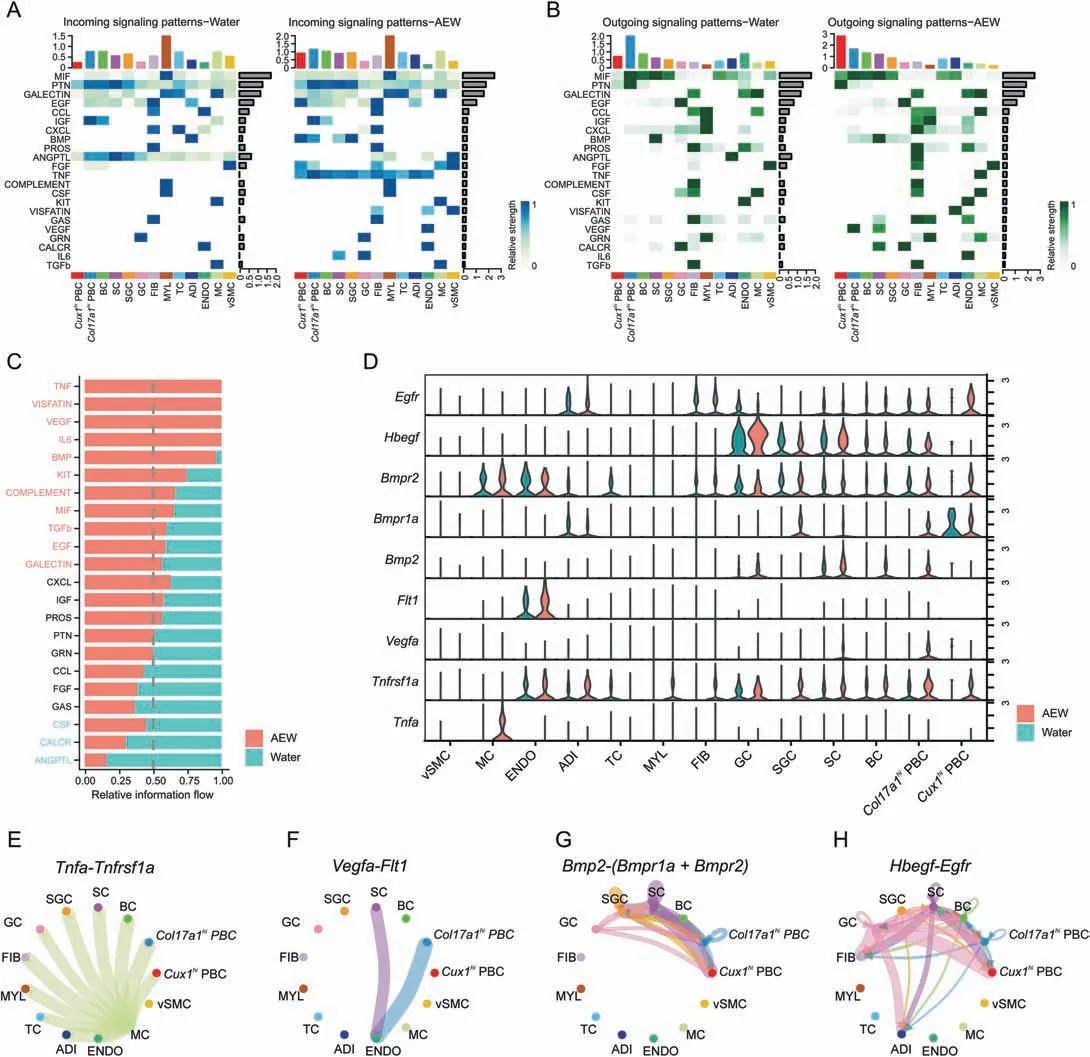
Fig.5.Potential ligand-receptor interactions between proliferative basal cells with other cells.(A)Heatmap plots showing the incoming communication patterns of two PBC states and other skin cell types both in Water and AEW groups.The relative strength of each signal pathway is color coded form gray to blue.(B) Heatmap plots showing the outgoing communication patterns of two PBC states and other skin cell types both in Water and AEW groups.The relative strength of each signal pathway is color coded form gray to green.(C) All significant signaling pathways are ranked based on their differences of overall information flow within the inferred networks between Water and AEW groups.The top signaling pathways colored red are more enriched in AEW group,the middle ones colored black are equally enriched in both groups,and the bottom ones colored green are more enriched in Water group.(D)Violin plots showing the related ligand and receptor genes expression distribution of Tnf,Vegfa,Bmp2 and Hbegf signaling between Water and AEW groups.(E) Circle plots showing the inferred Tnfa-Tnfrsf1a signaling networks between different cell clusters in AEW group.Each cell types are colored coded and edge width represents the communication probability.(F)The Vegfa-Flt1 signaling network in AEW group.(G)The Bmp2-Bmpr1a and Bmp2-Bmpr2 signaling network in AEW group.(H)The Hbegf-Egfr signaling network in AEW group.AEW:acetone/ether/water;FIB:fibroblasts;MYL:myeloid cells;TC:T cells;ADI:adipocytes;ENDO:endothelial cells;MC:mast cells;vSMC: vascular smooth muscle cells;PBC: proliferation basal cell;BC: basal cell;SC: spinous cell;GC: granule cell.
3.6.Transcription factor Cux1 promotes keratinocyte proliferation
The increase ofCux1hiPBC in AEW skin with hyperplasia suggested that it might positively regulate cell proliferation.To verify this assumption,a significantly decreasedCUX1mRNA level was achieved following lentivirus transfection withCUX1target shRNA with negative control shRNA (Fig.6A).CUX1knockdown significantly impaired viability and colony formation in HaCaT cells(Figs.6B and C).Furthermore,the knockdown ofCUX1led to a higher ratio in the G1 phase and a lower ratio in the S phase (Fig.6D).Accordingly,to assess the regulatory effect ofCUX1on cell cycleregulated proteins,qPCR results revealed that the knockdown ofCUX1decreasedCDK2,CCND1,CCND2,andCCNE1mRNA levels,but did not affectCDK4andCDK6(Fig.6E).Taken together,these results indicated thatCUX1promoted cell proliferation in KC.
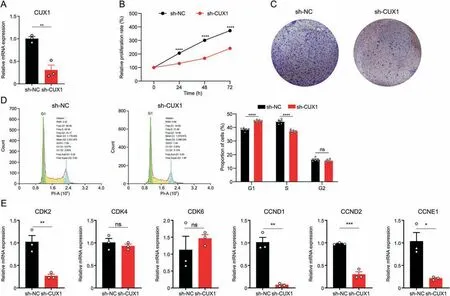
Fig.6.Transcription factor CUT-like homeobox 1(CUX1)promoted cell proliferation on keratinocytes.(A)Relative CUX1 expression of transfected CUX1 shRNA groups and control groups.n=3 replicates for each group.Data are presented as mean±standard error of mean(SEM).Student's t-test was used to determine the statistical significance,**P <0.01.(B)CCK-8 proliferation assay of transfected CUX1 shRNA groups and control groups. n=6 replicates for each group.Data are presented as mean,error bar is too small and not be shown.Student's t-test was used to determine the statistical significance,****P <0.0001.(C)Colony formation assay of transfected CUX1 shRNA groups and control groups.(D)Flow cytometry analysis of transfected CUX1 shRNA groups and control groups.The representative results are on the left.Histogram represents statistical result of the proportion of cells in each cell cycle phases.n=6 replicates for each group.Data are presented as mean±SEM.Student's t-test was used to determine the statistical significance,****P <0.0001,ns:not significant.(E)Quantitative real-time polymerase chain reaction showing the expression level of selected cell cycle associated genes of transfected CUX1 shRNA groups and control groups.Data are presented as mean ± SEM.Student's t-test was used to determine the statistical significance,*P <0.05,**P <0.01,***P <0.001,ns: not significant.sh-NC: short hairpin RNA for with negative control;sh-CUX1: short hairpin RNA for CUT-like homeobox 1.
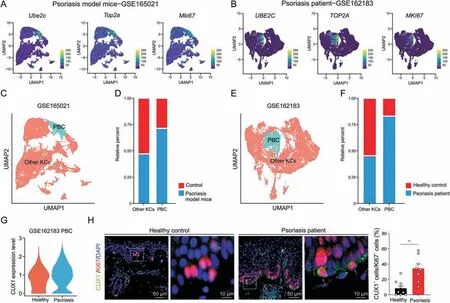
Fig.7.CUT-like homeobox 1 (Cux1)-positive proliferative basal cells were increased in psoriasis.(A) Normalized expression of proliferation marker genes like Ube2c, Top2a and Mki67 in keratinocyte(KC)cluster of single-cell RNA sequencing(scRNA-seq)data of psoriasis model mice(GSE165021).They are color coded and projected on the uniform manifold approximation and projection (UMAP) plot.(B) Normalized expression of proliferation marker genes like UBE2C, TOP2A and MKI67 in KC cluster of scRNA-seq data of psoriasis patient(GSE162183).They are color coded and projected on the UMAP plot.(C)UMAP plot indicating PBC and other types of KC in dataset GSE165021.(D)Average cell percentage of PBC and other types of KC in dataset GSE165021.(E)UMAP plot indicating PBC and other types of KC in dataset GSE162183.(F)Average cell percentage of PBC and other types of KC in dataset GSE162183.(G)Expression level of CUX1 in PBC between healthy control and psoriasis patient.(H)Immunofluorescent staining results showing the spatial distribution of CUX1 and Ki67 protein in skin sections of both patients with psoriasis and healthy controls.Enlarged image of the white boxed area is shown at the right to highlight the detail of positive cells.Histogram represents statistical result of the percentage of positive cells,n=9 for healthy group and n=8 for psoriasis group.Data are presented as mean±standard error of mean (SEM).Student's t-test was used to determine the statistical significance,**P <0.01.KC: keratinocyte;PBC: proliferation basal cell;DAPI: 4′,6-diamidino-2-phenylindole.
3.7.Cux1+ PBC are increased in patients with psoriasis
Psoriasis is the most frequently reported chronic dermatosis in adults and is characterized by dry skin and excessive KC proliferation.To examine the applicability of our findings,we further explored scRNA-seq data from recently published research on psoriasis in both mice and humans [38,39].We used the proliferation markersUbe2c,Top2a,andMki67to distinguish PBC and other types of KC(Figs.7A and B).We found that both in psoriasis model mice and patients,the percentage of PBC was significantly increased compared to controls (Figs.7C-F).To further verify the protein expression of CUX1 in patients with psoriasis and healthy controls,we conducted immunofluorescence staining to paraffinembedded skin sections.The percentage of epidermal Ki67+cells was significantly increased in the patients with psoriasis(Fig.S6A).Moreover,both the scRNA data and the staining results showedCUX1mRNA and CUX1 protein were increased in the PBC of patients with psoriasis (Figs.7G and H).Overall,these results collectively imply that excessiveCux1+PBC may be a frequent process underlying epidermal hyperplasia in psoriasis.
4.Discussion
4.1.scRNA-seq analysis reveals major skin cell subset compositions of the AEW mouse model
We first reported the single-cell gene expression profile from the neck-back skin of AEW model mice to our knowledge.Our data defined eight major cell populations including FIB,KC,MYL,TC,ADI,ENDO,MC,and vSMC in normal murine skin tissue,which is in line with the findings of other studies [40].According to our findings,dry skin had a significantly higher ratio of MYL,which is similar to the findings of previous reports in human and murine psoriasis with strong inflammatory response[7,39].Meanwhile,hundreds of DEGs were changed in chronic dry skin compared to normal skin,highlighting the molecular changes of chronic dry skin.Among them,the gene expression pattern of KC changed the most,suggesting that KC is crucial to the development of dry skin.
4.2.Identification of novel PBC states in the AEW model
A previous study demonstrated that basal cell hyperproliferation in dry skin conditions is more likely caused by a population of amplifying transit cells in the suprabasal layer [41].However,the identification of this hyperproliferative cell type is largely unknown.Interestingly,we identified a novel subpopulation of KC that highly expressedCux1in the AEW group but not in the Water group,which was distributed from the basal to the suprabasal layer (Fig.4E).Cux1,encoding a TF,was originally characterized as a CCAAT-displacement protein,which positively regulates the cell cycle and represents a transcriptional state associated with high mRNA processing,high mRNA splicing,and high cell cycle but low differentiation and migration.These transcriptional characteristics imply a relatively proliferative and developed stem cell state,supported by the high expression ofNedd4andCtnnb1,which encode TFs and play positive roles in KC proliferation[42,43],andCdk4,which encodes a cyclin-dependent kinase that can regulate the G1-S phase transition [44].
Col17a1encodes KC-specific collagen,which is the key structural component of the outer hemidesmosomal plaque [45].Col17a1is also a well-accepted epidermal stem cell marker and represents a relatively quiescent and primitive basal cell state that exists in both humans and rodents under physiological conditions,which underpins our findings[13,46].TheCol17a1hibasal cell state is limited in the basal layer and highly expresses genes associated with the negative regulation of cell proliferation,response to wounding,differentiation,and migration,which is in line with the feature ofCol17a1+basal cells in wound healing [11].Meanwhile,both trajectory analysis and CytoTRACE [47] revealed a temporal differentiation direction from theCol17a1hibasal cell state to theCux1hibasal cell state.
Taken together,our data analysis suggests thatCol17a1hiPBC is activated by a skin dryness-related signaling cascade similar to enhanced oxidative stress and inflammatory response,following which,Col17a1hiPBC transit toCux1hiPBC,initiating cell proliferation and gradually moving upward.
4.3.Potential ligand-receptor interaction patterns analyses in PBC
The pathological process of the AEW model involves many cell types,like eosinophils,basophils,MC,and T cells [5,48,49].To uncover the intercellular ligand-receptor interaction between PBC and other cells in chronic dry skin,we applied CellChat to our scRNAseq data [50].We noted that several signaling pathways,including TNF,VEGF,BMP,and EGF,were significantly enhanced in the AEW group and closely related to PBC.Earlier studies have reported that the higher level of inflammatory cytokine TNF in the skin exacerbates epidermal hyperplasia and skin inflammation[51,52].In our study,we further elucidated the source and the target cell types of the TNF signaling pathways.In the AEW model,theTnfexpression was significantly increased exclusively in MC,and the receptorTnfrsfa1(also calledTnfr1) expression was upregulated in bothCol17a1hiPBC andCux1hiPBC(Figs.5D and E).MCderived TNF-α is intensively involved in modulating inflammatory responses in various dermatoses,including contact hypersensitivity,AD cutaneous granulomas,and tissue fibrosis [53-56].A previous in vitro study also reported that TNF-α can promote KC proliferation[57],but the detailed mechanism of how MC-derived TNF-α signaling regulates PBC proliferation requires further exploration.We also identified another inflammation-related signaling pathway,the VEGF pathway,which was upregulated in the AEW model.Interestingly,the increased expression ofVegfawas only found inCol17a1hiPBC and SC,but not inCux1hiPBC.A previous study has reported that excessive VEGF-A expression caused epidermal hyperplasia and impaired epidermal differentiation [58].Meanwhile,the interaction of VEGF-A and its receptor fms-related tyrosine kinase 1 promotes psoriasis-like disease development [59].Therefore,combining other literature reports and our CellChat analysis,we imply thatCol17a1hiPBC andCux1hiPBC have different cell interaction patterns,which play a significant role in chronic dry skin development but regulate the pathological process through different signaling pathways.
4.4.Cux1hi PBC may function as the drivers of epidermal hyperplasia
Based onCux1hiPBC having more proliferative transcriptional features,we hypothesized that CUX1 would play a central role in basal cell proliferation.Our study revealed thatCUX1knockdown reduced cell proliferation in the HaCaT cell line and demonstrated a slower entry from the G1 phase to the S phase (Figs.6A-D).The mammalian cell cycle is controlled by the CDK protein family and cyclins [60].The G1 phase or G1-S transition is mediated by interphase CDKs such as CDK2,CDK4,and CDK6,and their binding proteins cyclin D and cyclin E.Our results revealed that cyclin D1 and cyclin D2,the first sensor of mitogenic signal,was decreased afterCUX1knockdown,while their G1 phase cofactors,CDK4andCDK6,were unaffected.The mRNA expression of cyclin E1 and its cofactorCDK2were both decreased afterCUX1knockdown(Fig.6E)and the reduction of the CDK2-cyclin E complex is supposed to disturb G1/S transition [61].Accordingly,our scRNA-seq data indicated that several cell cycle-related genes expression were upregulated inCux1hiPBC(Fig.S5).Thus,our data support the view that CUX1 functions as a pro-proliferative TF by upregulating a series of CDKs and cyclins in both murine and human KC.Several studies have reported that CUX1 contributes to cancer development by its pro-proliferation feature [62,63],but there have been few studies on CUX1 and dermatoses.We examined our findings in a psoriasis mouse model and patients with psoriasis,the results of which implied that the accumulation ofCux1+PBCs is a common pathogenic mechanism of KC hyperproliferation in dry skin.
5.Conclusions
In conclusion,we constructed a single-cell transcriptome map of a typical chronic dry skin murine model,the AEW model,and uncovered a novelCux1hiPBC state that likely causes epidermal hyperplasia.The findings will assist us in understanding dry skin pathogenesis and provide novel targets for the treatment of diseases related to dry skin.
CRediT author statement
Minhua Huang:Methodology,Validation,Investigation,Writing -Original draft preparation;Ning Hua:Methodology,Validation,Visualization,Writing -Original draft preparation;Siyi Zhuang:Methodology,Validation,Formal analysis;Qiuyuan Fang:Investigation;Jiangming Shang:Investigation;Zhen Wang:Resources,Validation;Xiaohua Tao:Resources,Validation;Jianguo Niu:administration,Writing-Reviewing and Editing;Xiangyao Li:Conceptualization,Supervision,Resources,Project administration;Peilin Yu:Conceptualization,Supervision,Resources,Project administration,Writing -Reviewing and Editing;Wei Yang:Conceptualization,Supervision,Resources,Project administration,Writing -Reviewing and Editing.
Declaration of competing interest
The authors declare that there are no conflicts of interest.
Acknowledgments
The work was supported by Technological Innovation 2030-Major Projects of Brain Science and Brain-like Research (Grant No.: 2022ZD0206200),the Natural Science Foundation of China(Grant Nos.: 31872796 and 82030108 to W.Yang;32071102 to P.Yu),the National Major Special Project on New Drug Innovation of China(Grant No.:2018ZX09711001-004-005),the key research and development program of Ningxia Hui Autonomous Region (Grant No.:2019BFH02003),Fundamental Research Funds for the Central Universities of China (Grant No.: 2016QNA7002 to P.Yu),and Zhejiang Provincial Natural Science Foundation (Grant No.:LR16H090001 to W.Yang).We thank J.Chen and Q.Huang from the Core Facilities,Zhejiang University School of Medicine for their technical support.
Appendix A.Supplementary data
Supplementary data to this article can be found online at https://doi.org/10.1016/j.jpha.2023.04.004.
 Journal of Pharmaceutical Analysis2023年7期
- Journal of Pharmaceutical Analysis的其它文章
- Single-cell RNA-sequencing and subcellular spatial transcriptomics facilitate the translation of liver microphysiological systems for regulatory application
- Dissecting the brain with spatially resolved multi-omics
- New discoveries in the field of metabolism by applying single-cell and spatial omics
- Single-cell analyses reveal cannabidiol rewires tumor microenvironment via inhibiting alternative activation of macrophage and synergizes with anti-PD-1 in colon cancer
- Single-cell analysis of cellular heterogeneity and interactions in the ischemia-reperfusion injured mouse intestine
- Discovering metabolic vulnerability using spatially resolved metabolomics for antitumor small molecule-drug conjugates development as a precise cancer therapy strategy