
Single-cell analysis of cellular heterogeneity and interactions in the ischemia-reperfusion injured mouse intestine
2023-09-05 00:33LinhongYinMengGoLinXuYnQiLnHnJinyongPeng
Linhong Yin ,Meng Go ,Lin Xu ,Yn Qi ,Ln Hn ,Jinyong Peng ,*
aCollege of Pharmacy,Dalian Medical University,Dalian,Liaoning,116044,China
bSchool of Pharmacy,Anhui University of Chinese Medicine,Hefei,230012,China
Keywords: Single-cell RNA-sequencing Intestinal cells Cell heterogeneity Enterocyte cells Intercellular communication
ABSTRACT Nine major cell populations among 46,716 cells were identified in mouse intestinal ischemia-reperfusion(II/R) injury by single-cell RNA sequencing.For enterocyte cells,11 subclusters were found,in which enterocyte cluster 1(EC1),enterocyte cluster 3(EC3),and enterocyte cluster 8(EC8)were newly discovered cells in ischemia 45 min/reperfusion 720 min (I 45 min/R 720 min) group.EC1 and EC3 played roles in digestion and absorption,and EC8 played a role in cell junctions.For TA cells,after ischemia 45 min/reperfusion 90 min (I 45 min/R 90 min),many TA cells at the stage of proliferation were identified.For Paneth cells,Paneth cluster 3 was observed in the resting state of normal jejunum.After I 45 min/R 90 min,three new subsets were found,in which Paneth cluster 1 had good antigen presentation activity.The main functions of goblet cells were to synthesize and secrete mucus,and a novel subcluster (goblet cluster 5)with highly proliferative ability was discovered in I 45 min/R 90 min group.As a major part of immune system,the changes inTcells with important roles were clarified.Notably,enterocyte cells secreted Guca2b to interact with Gucy2c receptor on the membranes of stem cells,TA cells,Paneth cells,and goblet cells to elicit intercellular communication.One marker known as glutathione S-transferase mu 3(GSTM3)affected intestinal mucosal barrier function by adjusting mitogen-activated protein kinases (MAPK) signaling during II/R injury.The data on the heterogeneity of intestinal cells,cellular communication and the mechanism of GSTM3 provide a cellular basis for treating II/R injury.
1.Introduction
Intestinal ischemia-reperfusion (II/R) injury is associated with many pathophysiological processes,including volvulus,intestinal transplantation,severe burn,trauma,and shock [1].When the ischemic intestine restores blood flow (reperfusion),it will aggravate the harmful effects of ischemia,enhance oxidative stress and activate innate immunity,inflammation,and cell death [2].The survival rate for humans with II/R injury is usually less than 50%[3],because II/R can cause tissue hypoxia,inflammation,and cell infiltration,which will subsequently lead to the loss of the intestinal mucosal barrier [4,5].The mucosal barrier is critical for intestinal health,and its homeostatic maintenance and repair depend on the asymmetric division of intestinal stem cells(SCs)[6].During development,SCs may first transform into pluripotent SCs with a highly proliferative capacity;these cells are known as transitamplifying cells (TACs),which are early intermediate cells in tissue regeneration.The intestinal mucosal epithelium consists of Paneth cells (PCs),enteroendocrine cells (EECs),goblet cells (GCs),and enterocyte cells (ECs) [7].ECs,which represent the most important components of the small intestine based on the function of absorbing nutrients,are differentiated from intestinal SCs located at the bottom of the crypt[8].PCs located at the bottom of the crypts of Lieberkühn are interspersed among intestinal SCs,which can prevent bacterial adhesion and invasion and have prominent roles in innate immune surveillance of the gut[9].When intestinal tissue is damaged,the number of PCs increases rapidly[10].Mature GCs appear in the stratified and monolayer columnar epithelium of the small intestine,and early GCs are present in the relatively undifferentiated mucinous epithelium [11].II/R causes the most serious damage to intestinal epithelial cells[12]and has a significant impact on the immune system of the intestinal mucosa[13].Thus,it is worth studying the overall landscape and temporal heterogeneity of intestinal cells during II/R injury.
Single-cell RNA sequencing (scRNA-seq),which is a wellestablished and effective method,can be used to identify various tissue cell types and provide insights into pathophysiological processes[14].scRNA-seq has been widely used to test the subtypes of intestinal epithelial cells [7,15] and to identify the states of individual cells under various stimuli to understand pathological changes and recovery processes [16].
In this study,we used scRNA-seq to analyze the mouse jejunum in the control,sham,intestinal ischemia 45 min/reperfusion 90 min(I 45 min/R 90 min),and intestinal ischemia 45 min/reperfusion 720 min (I 45 min/R 720 min) groups.These data can provide a deep-level understanding of the composition,change trends,temporal heterogeneity,and mechanisms of intestinal cells during the II/R injury process.
2.Materials and methods
2.1.Mice and treatments
The studies on C57BL/6 mice were approved by the Animal Care and Use Committee of Dalian Medical University (Approval number:AEE20045).Male C57BL/6 mice,aged 8 weeks(20-22 g),were obtained from Liaoning Changsheng Biotechnology Co.,Ltd.(production license: SCXK [Liao] 2020-0001,Shenyang,China).The housing conditions of the mice were maintained at 25 ± 2°C,relative humidity was maintained at 50%±10%,and the light/dark cycle was 12 h.
The mice were fasted for 12 h before the experiments and then divided into four groups (control,sham,I 45 min/R 90 min and I 45 min/R 720 min groups).Each mouse in the I 45 min/R 90 min group was subjected to 45 min of ischemia by ligating small anastomosing vessels to occlude the superior mesenteric artery(SMA),and reperfusion for 90 min was induced by removing the clamp [17].Each mouse in the I 45 min/R 720 min group was subjected to 45 min of ischemia and 720 min of reperfusion.The mice were sacrificed after reperfusion,and serum and jejunum samples were harvested for analysis.The serum levels of diamine oxidase (DAO) and D-lactic acid in the mice were measured according to the kit instructions (Nanjing Jiancheng Corp.,Nanjing,China).Pathological changes in jejunum tissues were observed,and the protein levels of GSTM3 and some proteins of mitogenactivated protein kinase (MAPK) signaling were detected.
2.2.Histological analysis
Jejunal segments of C57BL/6 mouse small intestine tissues were fixed and embedded in paraffin,after which 4 μm paraffinembedded specimens were stained with hematoxylin and eosin(H&E).The assessment of the histopathological scores on intestinal tissues was based on the histological scoring systems described by Chiu et al.[18],which is shown in the Supplementary data.
2.3.Immunofluorescence staining
Paraffin-embedded jejunal tissues were sectioned,deparaffinized,and rehydrated.Subsequently,sections were washed with phosphate buffer saline(PBS),blocked in 1%bovine serum albumin(BSA)and 0.1%Triton X-100 for 10 min and incubated with primary antibody at 4°C overnight,and incubated with fluorescein labeled antibodies and DAPI solution in dark.The samples were photographed by the fluorescence microscopy (Olympus,Tokyo,Japan).The primary antibodies used for the staining were Maf,Apoal,Chka,Gsta1,Lyz1,Itln1,Ccl6,Zg16,Cd4,Cd8,ZO-1,and Claudin-1(Table S1).
2.4.RNA-seq analysis
Total RNA samples were extracted by using the TRIzol reagent(Invitrogen,Carlsbad,CA,USA),and the quality of the extracted RNA was determined (Bioanalyzer 2200,Agilent,Santa Clara,CA,USA),after which the RNA was kept at -80°C.According to the manufacturer’s instructions,cDNA libraries were constructed by using a kit (New England Biolabs,Ipswich,MA,USA).Final cDNA libraries were created and quantified,and the tagged cDNA libraries were pooled and used for HiSeq X Ten sequencing (Illumina,San Diego,CA,USA).Before processing,clean reads were obtained from the raw reads.Differential gene and transcript expression assays were performed with TopHat and Cufflinks [19].HTseq-count was used to count the gene counts,and the RPKM method was used to determine gene expression[20].The differentially expressed genes between the groups were evaluated.
2.5.Single-cell suspension preparation
Jejunal segments of the small intestine from the mesentery were cut into small pieces,and a single cell suspension was prepared(as described previously)[21].The cell activity was more than 70%,the concentration was 500-2,000 cells/μL,and the volume was not less than 200 μL.
2.6.scRNA-seq protocol
Chromium Single-cell 3′Reagent v3 kits (10x Genomics,Pleasanton,CA,USA) were applied to prepare the barcoded scRNA-seq libraries,and specific operations were performed according to the instructions.The Chromium Single-Cell Controller Instrument(10x Genomics (Shanghai) Co.,Ltd,Shanghai,China) was used to obtain the library of each sample.Every obtained library was sequenced on a HiSeq X Ten platform (Illumina),and FASTQ with default parameters was applied [22].Demultiplexing was performed by using the Cellranger tool kit(version 3.0.0).Afterwards,the data were combined by using cellranger aggr.Subsequently,the Seurat(https://satijalab.org/seurat/)package was applied to correct the biased factors.We excluded all cells with fewer than 200 detected genes,more than 5,000 detected genes and more than 40%mitochondrial gene expression content.Clustering was conducted by using Seurat.The top 2,000 variable genes among the cells were selected to calculate 20 principal components by using the Run PCA function.The first ten principal components were used for subsequent cell clustering,and the iterative clustering strategy of cells is provided in the Supplementary data.
2.7.Pseudotime analysis
Monocle2 (v.2.12.0) was used to examine the pseudotime trajectories of intestinal cells.The UMI matrix served as the input,and marker genes(or variable genes)that were detected by Seurat were used for a building trace (q<10-4) [23].
2.8.Gene Ontology and pathway assays
The subclusters of the cell types were established according to the marker genes.To accurately analyze the functions of the cells in each subcluster,a Gene Ontology (GO) analysis was performed.Fisher's exact test was applied to identify the significant GO categories (P<0.05),and the false discovery rate (FDR) was used to correct thePvalues.Furthermore,a pathway test was performed,and the marker genes in each subcluster were annotated based on the Kyoto Encyclopedia of Genes and Genomes(KEGG)database to produce pathway terms.The significance level of the pathway was calculated by using the Fisher’s test to screen the significant pathway term of gene enrichment (P<0.05).
2.9.Single-cell regulatory network inference and clustering(SCENIC)
SCENIC is a tool that is used to infer the regulatory network of transcription factors and their related cellular states based on singlecell data.Based on the database,transcription factors in the cell population,the regulatory genes and the regulatory intensity of each transcription factor in the cells were calculated.Hence,the regulation of different cell clusters by the transcription factors was found.
2.10.Quantitative set analysis for gene expression (QuSAGE)
The QuSAGE test was used to assay the enrichment of the gene sets based on the variance inflation factor algorithm.The R package QuSAGE was used to achieve the enrichment status and enrich significance of each gene set [24].
2.11.Cell-cell communication analysis
Cell communication analysis is a very important aspect of scRNA-seq.Cell PhoneDB provides a perspective to understand how different cell populations interact through the most common pair of ligand receptor relationships (Version 2.0) (top significant pairs=50;P<0.05) [25].
2.12.GSTM3 siRNA transfection in mice
C57BL/6 mice were randomly divided into the sham group,negative control (NC)-sham group,si-GSTM3+I 45 min/R 90 min group,and si-GSTM3+I 45 min/R 720 min group(n=10).Negative control and GSTM3 siRNA (Gstm-Mus-640: 5′-to 3′,CCCAAGACCUGUGUUUACUTT,AGUAAACACAGGUCUUGGGTT,Gene-Pharma CO.,Ltd.,Suzhou,China) were dissolved in 0.9% normal saline (according to the experimental requirements).The mice in the si-GSTM3+I 45 min/R 90 min group and si-GSTM3+I 45 min/R 720 min group were injected with 20 nmol of GSTM3 siRNA 3 times every two days.Similarly,the mice in the NC-sham group were injected with 20 nmol of negative control reagent.Afterwards,they were subjected to II/R injury.After euthanasia,the levels of DAO and D-lactic acid were detected.Pathological changes in jejunum tissues were observed,and the protein levels of GSTM3 and some proteins of MAPK signaling were detected.
2.13.Western blotting assay
Total proteins of intestinal tissues were extracted and quantified by using kits(Beyotime Biotech.Inc.,Shanghai,China);the proteins were then separated on sodium dodecyl sulfate polyacrylamide gel electrophoresis (SDS-PAGE) gels and blotted on polyvinylidene fluoride (PVDF) transfer membranes (Millipore Corp,Boston,MA,USA).After hybridizing with monoclonal antibody at 4°C overnight,the membranes were treated with secondary antibody for 2 h at room temperature.Visualization was performed by using enhanced chemiluminescence,and the bands were detected by the UVP automatic gel imaging system (UVP,Upland,CA,USA).The intensity value of the relative protein level was normalized to βactin.The primary antibodies that were used in this study are listed in Table S1.
2.14.Statistical analysis
The Chiu’s scores,western blotting assay data and kits were analyzed by using GraphPad Prism 9.0 software.One-way analysis of variance (ANOVA) was performed to compare multiple independent groups.*P<0.05 was considered significant.
3.Results
3.1.Overview of intestinal cells
In the current study,an II/R injury mouse model was established for single-cell analysis and pathological assay of the jejunum(Fig.1A).As depicted in Fig.1B,the morphology of the intestinal mucosa was normal with complete columnar epithelial cells and goblet cells in the sham and control groups,and intestinal villi and crypts were well preserved.After 90 min of reperfusion,the jejunum showed jejunal villus exfoliation and crypt layer infarction,intestinal mucosa deformation,loss of surface epithelial cells,and inflammatory cell infiltration.Chiu’s scores were used to evaluate intestinal mucosa injury,as shown in Fig.1C.The Chiu’s scores in the I 45 min/R 90 min group and I 45 min/R 720 min group were 4.53 ± 0.35 and 1.20 ± 0.46,respectively.Furthermore,the differentially expressed genes in the different groups were obtained (shown in Supplementary data) via RNA-seq analysis.The volcano plots of the differentially expressed genes are shown in Fig.1D,and the results also demonstrated the difference in read distribution on the chromosome of each group (Fig.S1A).In the I 45 min/R 90 min group,the reads of chromosome 8 were increased,while the reads of chromosome 9 were decreased,which were significantly different from those in the other groups.The heatmaps also indicated differences in gene expression among groups.(Fig.S1B).Furthermore,the series cluster analysis showed that the genes were divided into eight categories,in which profiles 1,2,5,and 6 showed significances (Fig.S1C),and 1,368 genes were downregulated at I 45 min/R 90 min and upregulated at I 45 min/R 720 min.In contrast,1,483 genes were upregulated at I 45 min/R 90 min and downregulated at I 45 min/R 720 min.The GO enrichment results showed that the expression differences in regulating transcription and DNA template-related genes,mechanical stimulus-related genes,inflammatory response-related genes,and immune response-related genes were the most significant (Figs.1E and S1D).
We performed scRNA-seq to profile a total of 46,716 single cells from the jejunum of C57BL/6 mice in the control,sham,I 45 min/R 90 min,and I 45 min/R720 min groups.Overall,the prenormalization mean reads per cell were 49,950,and the fraction reads in the cells were 78.3%.Additionally,the postnormalization mean reads,the median number of genes,and the median number of unique molecular identifiers (UMIs) per cell value were 35,835,1,342 and 5,238,respectively.Subsequently,thetSNE visualization of the cells in the groups(Fig.1F)and the cell clusters(Fig.1G)were provided.According to the graph cluster trajectory of all samples by pseudo-time analysis,marker heatmap and single-cell gene(scGene) module export heatmap (Figs.S2A-C),21 clusters were recombined into 9 major clusters according to the cell types(Fig.1H).scGene model export heatmap was obtained by using a single-cell gene module analysis (Supplementary data).Specifically,the following cells were identified: B cells and plasma cells(BCs,cluster 9 and 17,Lgkc+andJchain+),dendritic cells(DCs)and tuft cells(DCs,cluster 19,S100a8+,S100a9+),enterocyte cells(ECs,cluster 0,1,4,7,8,10,13,16,Ada+andApoa4+),enteroendocrine fibroblasts(EFs,cluster 4,Chgb+andSct+),goblet cells(GCs,cluster 11,Fcgbp+andZg16+),Paneth cells (PCs,cluster 2,Defa24+andDefa30+),stem cells (SCs,cluster 18,Olfm4+andClca3b+),T cells(TCs,cluster 8,Ccl5+andGzma+),and TA cells(TACs,cluster 3 and 14,Mcub.1+andGm26917+).Cluster-specific genes were used to ascertain the cell type,and the heatmap showed the marker genes in each cell type with statistically significant differential expressions(Fig.2A).Furthermore,the distributions of two marker genes of each cell cluster among the whole cell types according to violin plots are shown in Fig.2B.Moreover,the ECs,PCs,TACs,GCs andTCs were verified (Fig.2C) by immunofluorescence staining,and the expression profiles of the corresponding proteins of two classic marker genes were investigated [26-34].In this study,the quantities of ECs,PCs,TACs,GCs,and TCs were large,and their changes were obvious during the occurrence and development of II/R,which are worthy of further study.
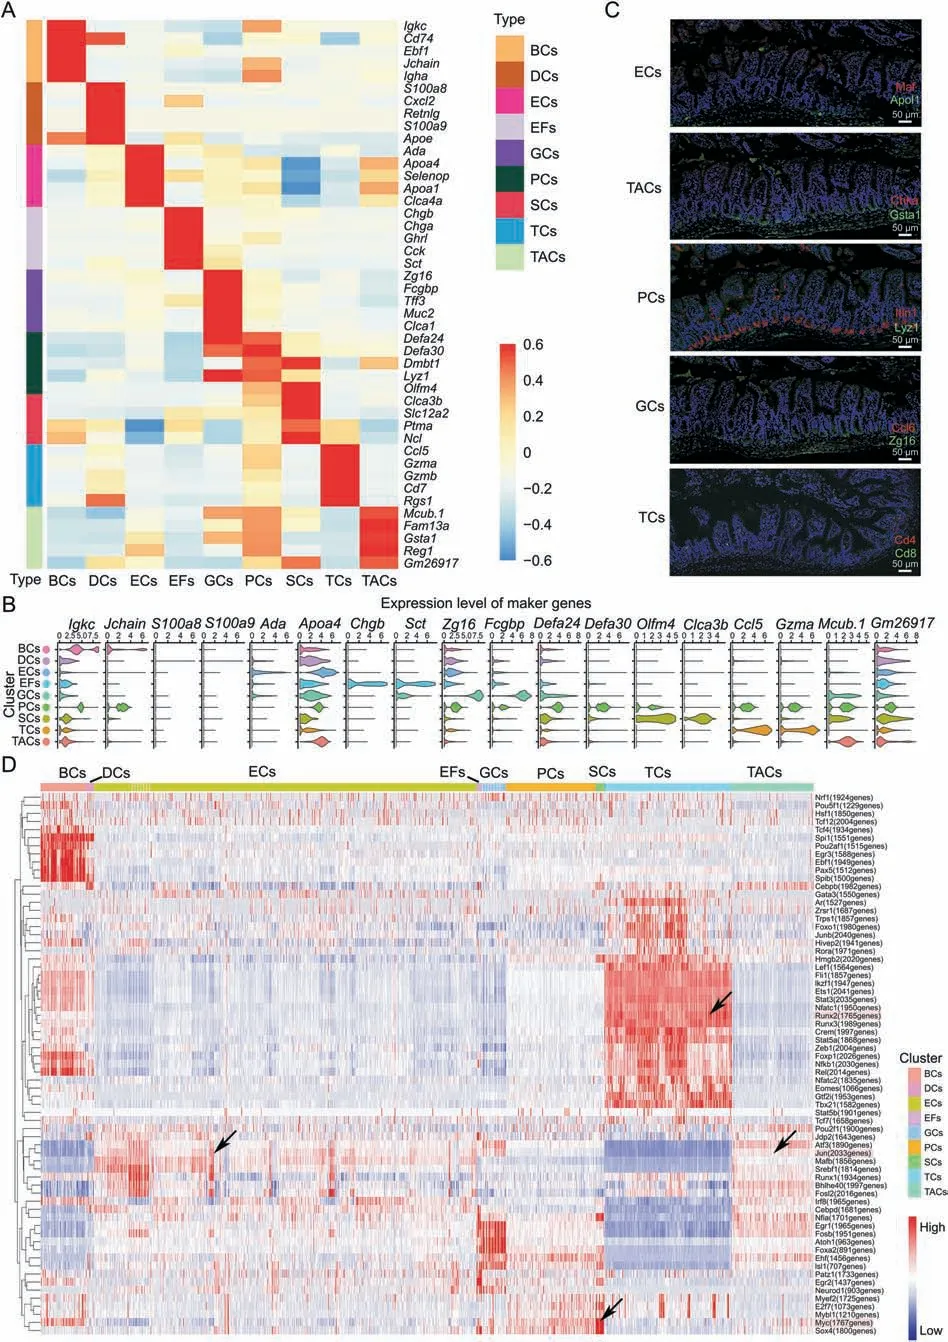
Fig.2.The marker genes of each cell type and transcription factors of the small intestine in intestinal ischemia/reperfusion(II/R)injury.(A)Heatmap showing 5 specific top marker genes with P <0.01 via the Wilcoxon rank-sum test and log-fold change >2 in B cells and plasma cells (BCs),dendritic cells (DCs) and tuft cells,enterocyte cells (ECs),enteroendocrine fibroblasts(EFs),goblet cells(GCs),Paneth cells(PCs),stem cells(SCs),T cells(TCs)and TA cells(TACs).The thin lines distinguish different clusters,and the color depth represents the levels of gene expression,in which red indicates high expression and blue indicates low expression.(B)Expression patterns(violin plot)of two representative genes marking each cell type.(C)Immunofluorescence staining of the representative genes marking ECs,TACs,PCs,GCs and TCs in jejunum from I 45 min/R 90 min groups.(D)Heatmap of SCENIC on each cell type,which shows the number and intensity of regulatory genes on transcription factors and the trend of each cell type in the II/R process.X-axis:cells sorted by clusters(the top color block indicates the cell clusters);Y-axis:transcription factor(the number after the gene name indicates the numbers of regulated genes);Color:the regulation intensity of transcription factor (red represents strong regulation,and blue represents weak regulation).
The SCENIC heatmap(Fig.2D)shows the number and intensitiy of regulatory genes of transcription factors in nine cell clusters.In this case,Junregulated the expression of 2,033 genes,with the strongest regulatory intensity observed in ECs and TACs.Mycregulated the expression of 1,767 genes,with strong regulatory intensity observed in SCs,PCs and BCs.Furthermore,Runx2regulated the expression of 1,765 genes,with strong regulatory intensity observed in TCs.Moreover,the SCENIC data showed that the intensity of regulatory genes of transcription factors in TCs,DCs,and BCs was different from that in other clusters.EFs and GCs had a similar intensity of transcription factor regulatory genes.Furthermore,the intensity trend of the regulatory genes of transcription factors was consistent in ECs,PCs,SCs,and TACs.
3.2.The subclusters,differentiation trajectory,and function of ECs in II/R
ECs were detected as the largest population in the II/R process.To demonstrate the heterogeneity of the cells,ECs of control,sham,I 45 min/R 90 min and I 45 min/R 720 min groups were subclustered into 11 clusters,namely,enterocyte cluster 0(EC0,22.3%of all ECs,Plb1+),enterocyte cluster 1(EC1,12.8%of all ECs,Fabp1+),enterocyte cluster 2 (EC2,12.0% of all ECs,2010109103RIK+),enterocyte cluster 3 (EC3,10.7% of all ECs,Sult6b2+),enterocyte cluster 4 (EC4,10.6% of all ECs,Rpl13+),enterocyte cluster 5 (EC5,10.3% of all ECs,Gm42418+),enterocyte cluster 6 (EC6,9.0% of all ECs,Gpx2+),enterocyte cluster 7 (EC7,7.0% of all ECs,Otop3+),enterocyte cluster 8(EC8,4.0%of all ECs,Plscr1+),enterocyte cluster 9 (EC9,0.9% of all ECs,Dock10+),and enterocyte cluster 10 (EC10,0.2% of all ECs,Mptx2+) (Fig.3A).The violin plots of one marker gene of each cluster summarized in Fig.S3A illustrated that the expression levels of the different marker genes in the sets were different.Subsequently,the relative proportions of each ECs cluster depicted intSNE per experimental group were determined according to different clustering algorithms (Fig.S3B).The overall results were summarized,in which EC0,EC2,EC4,EC5,EC6,and EC7 accounted for 24.79% of the ECs in the sham group.After 45 min of ischemia and 90 min of reperfusion,only a small number of ECs survived(1.70%of all ECs),and the major clusters were EC2,EC5,and EC6,which showed better survivability during injury.With prolonged reperfusion time,the ECs gradually resumed.At 720 min of reperfusion,several new subtypes,including EC1,EC3 and EC8 (25.10% of all ECs),were observed.
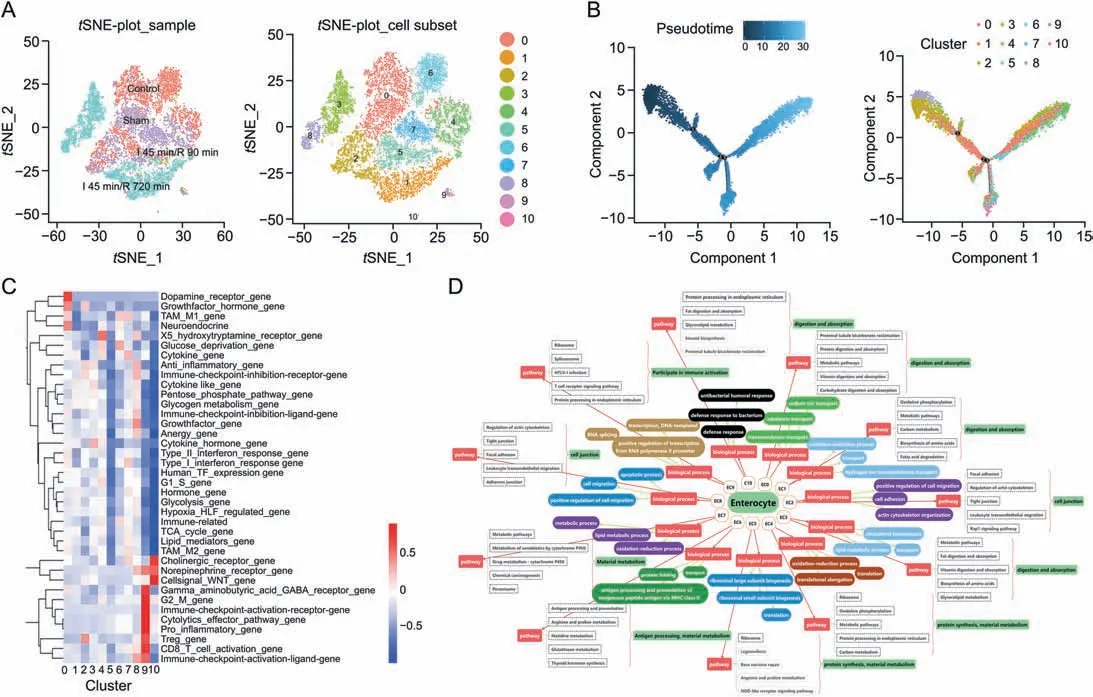
Fig.3.The subclusters,differentiation trajectory,and the function of enterocyte cells(ECs)in intestinal ischemia/reperfusion(II/R)injury.(A)tSNE-plot_sample and tSNE-plot_cell subsets of the ECs.tSNE-plot_sample clustered intestine-specific cells in the control,sham,I 45 min/R 90 min and I 45 min/R 720 min groups,and tSNE-plot_cell subsets clustered by the identified major subclusters,including enterocyte cluster 0 (EC0),cluster 1 (EC1),cluster 2 (EC2),cluster 3 (EC3),cluster 4 (EC4),cluster 5 (EC5),cluster 6 (EC6),cluster 7(EC7),cluster 8 (EC8),cluster 9 (EC9),and cluster 10 (EC10).(B) The pseudotime trajectory and pseudotime tree of ECs in II/R injury.The differentiation trajectory included the arrangement diagram of time distance(color from dark to light was in‘pseudotime’order,and the location with the darkest color was the starting point of the pseudotime;those cells had the characteristics of being undifferentiated or poorly differentiated)and the distribution diagram of subclusters based on pseudotime.(C)Gene set expression box plot of 41 mouse gene sets of ECs.X-axis:subclusters;Y-axis:gene set information;Color:the significance of each subcluster in each gene set(red indicates significance and blue indicates non-significance).(D)Top 3 significant terms of biological processes(P <0.05)and top 5 pathway terms(significant terms have black dashed boxes,P <0.05)of subclusters of ECs.
The pseudotimes of the ECs shared a common differentiation trajectory,and three minor bifurcations on the major trajectory were found(Fig.3B).On the time axis of differentiation,EC2,EC3,and EC8 were located at the start of the timeline with lower differentiation efficiency.Moreover,EC0,EC1,EC4,and EC7 were located at the end of the time axis with the largest and most differentiated parts of ECs.The branches of EC5,EC10,EC9,and EC6 were at the third fork of the major time trajectory.After differentiation,there were differences in biological functions due to different fates.
The SCENIC heatmap of the ECs showed the number and intensity of the regulatory genes of transcription factors in 11 EC subclusters(Fig.S3C).Certain transcription factors and their regulatory genes exhibited a lower intensity in EC2,EC5 and EC6 cells,such asKdm5a(2,288 genes),Taf1(1,872 genes)andFoxk1(1,479 genes).According to the SCENIC and differentiation trajectory assays,the functional classifications of EC subclusters were consistent with the scGene module export heatmap (Fig.S3D).The heatmap of the QuSAGE analysis of ECs demonstrated the activation degree of different gene sets in EC0-EC10(Fig.3C).Overall,in II/R injury,the subclusters of EC0,EC1,EC4,and EC7 were the same class,and the hypoxiainducible factor(HIF)regulated gene,hormone gene,glycolysis gene,humanTF expression gene and G1_S gene were highly activated.EC4,EC7,and EC0 are ECs in different mature states in the normal small intestine.EC1 wasa newcell cluster that exhibiteda lowerexpression of immune-related genes during reperfusion recovery.The subclusters of EC2,EC3,and EC8 were classified into the same category,and anti-inflammatory gene,immune checkpoint inhibition receptor gene,and other genes were highly activated.EC3 and EC8 are new cellswitha high expression of cytokine-like genes during reperfusion recovery,and the EC5,EC6,EC9,and EC10 subpopulations were classified into the same category.
The states and functions of the EC subclusters according to biological process(BP)and pathways of marker genes were recorded.BP(top 3) and pathways (top 5) are shown in Fig.3D.Most of the 11 subclusters of ECs had transporters in BP terms,thus indicating that the cells demonstrated the function of nutrient absorption.The top 3 terms of BP in EC0 were transmembrane transport,cobalamin transport,and sodium ion transport,and the pathways included proximal tubule bicarbonate reclamation,proteindigestion,and absorption and metabolic pathway.Thus,the functions of EC0 cells included digestion and absorption.Therefore,EC1 and EC3 with digestion and absorption activities,EC2 and EC8 with cell junction activities,EC4 and EC5 with protein synthesis and material metabolism activities,EC6 with antigen processing and material metabolism activities,EC7 with material metabolism activities and EC9 and EC10 with immune activation and cellular defense activities were found.Furthermore,EC2,EC5,and EC6 showed better viability during II/R injury.
3.3.The subclusters,differentiation trajectory,and the function of TACs in II/R
The TACs of control,sham,I 45 min/R 90 min and I 45 min/R 720 min groups were decomposed into 9 subclusters (Fig.4A),namely,cluster 0(TAC0,20.8%of all TACs,Papss+),cluster 1(TAC1,16.6% of all TACs,Crlp1+),cluster 2 (TAC2,15.2% of all TACs,Sis+),cluster 3 (TAC3,13.3% of all TACs,Krt19+),cluster 4 (TAC4,11.9% of all TACs,Gm42418+),cluster 5 (TAC5,11.3% of all TACs,Rps8+),cluster 6 (TAC6,6.1%of all TACs,Lcn2+),cluster 7 (TAC7,2.5%of all TACs,Epcam+),and cluster 8(TAC8,2.3%of all TACs,St8sia4+).The violin plots of one marker gene of each cluster are summarized in Fig.S4A.Subsequently,the amounts of TACs depicted intSNE per experimental group based on the different clustering algorithms were summarized (Fig.S4B).In the sham group,the TACs were TAC3 and TAC5 (2.1% of total TACs).After 45 min of ischemia and 90 min of reperfusion,more TACs appeared(88.7%of TACs),and the major subclusters were TAC0,TAC1,TAC2,TAC3,TAC4,TAC5,TAC6,TAC7,and TAC8.At 720 min of reperfusion,the function of the small intestine was recovered,and the number of TACs was decreased(8.8% of TACs with the major clusters of TAC6).
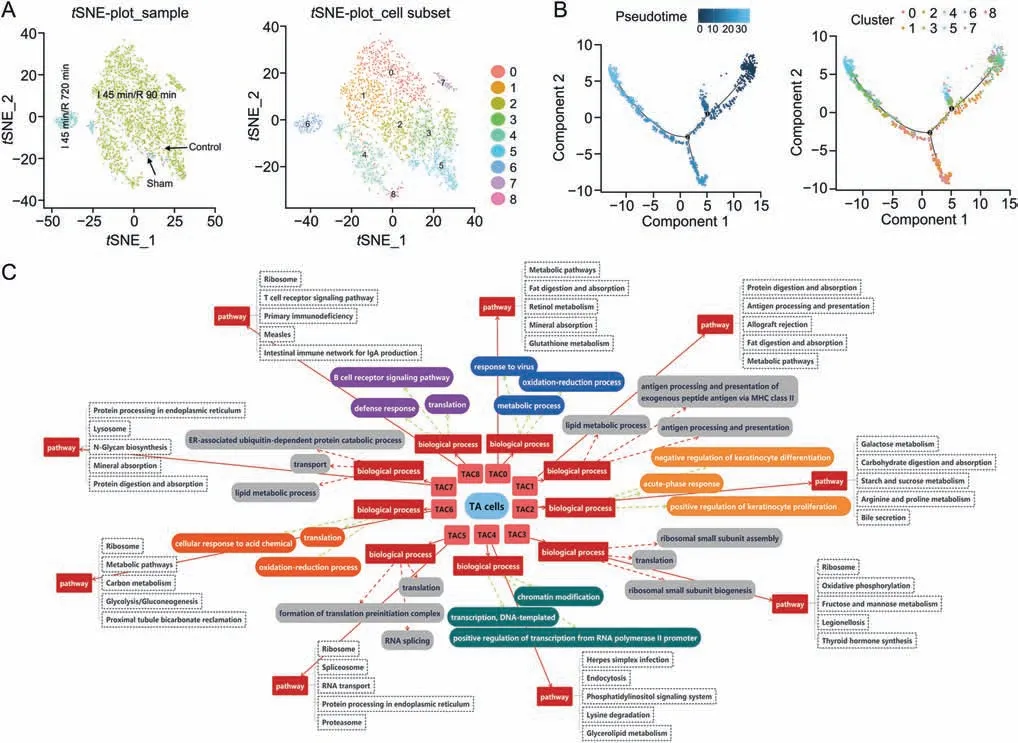
Fig.4.The subclusters,differentiation trajectory,and the function of TA cells(TACs)in intestinal ischemia/reperfusion(II/R)injury.(A)tSNE-plot_sample and tSNE-plot_cell subsets of the TACs. tSNE-plot_sample clustered intestine-specific cells by control,sham,I 45 min/R 90 min and I 45 min/R 720 min groups,and tSNE-plot_cell subsets clustered by the identified major subclusters,including TA cluster 0(TAC0),cluster 1(TAC1),cluster 2(TAC2),cluster 3(TAC3),cluster 4(TAC4),cluster 5(TAC5),cluster 6(TAC6),cluster 7(TAC7),and cluster 8 (TAC8).(B) The pseudotime trajectory and pseudotime tree of TACs in II/R injury.The differentiation trajectory included the arrangement diagram of time distance(color from dark to light was in ‘pseudotime’ order,and the location with the darkest color was the starting point of the pseudotime;those cells had the characteristics of being undifferentiated or poorly differentiated) and the distribution diagram of subclusters based on pseudotime.(C)Top 3 significant terms of biological processes(P <0.05) and top 5 pathway terms (significant terms have black dashed boxes, P <0.05) of subclusters of TACs.
The TAC subclusters shared common differentiation trajectories,and there were two minor bifurcations(Fig.4B).TAC4 was locatedat the starting point of the time axis and represented the initial state of differentiation.In addition,small amounts of TAC3,TAC5,TAC2,and TAC8 were in a state(3.6%of TACs)at the branch on the first fork of the major time trajectory.The number of differentiated cells in the branch was lower.TAC0,TAC1,and TAC7 were in a state(20.9% of TACs),which was the branch at the second fork of the major time trajectory.Moreover,the number of differentiated cells in this branch was large.Furthermore,the majority of TAC0,TAC1,TAC3,TAC5,TAC2,and TAC6 were in a state(38.1%of TACs),which was the major time trajectory after the second fork.TAC5 and TAC6 were located at the end of the time trajectory,and TAC2 and TAC3 were in the middle stage of differentiation.
In the QuSAGE results of the TACs(Fig.S4C),anti-inflammatory gene and immune checkpoint inhibition receptor gene were highly activated in TAC0,TAC1,and TAC7,and the cholinergic receptor gene,TAM-M1 gene,and CD8 cell activation gene were highly activated in TAC4 and TAC8.HIF regulated gene,G1_S gene,and human TF expression gene were highly activated in TAC2,TAC3,TAC5,and TAC6.According to the scGene module results(Fig.S4D),TAC3 and TAC5,TAC2 and TAC6,TAC4 and TAC8 and TAC0,TAC1 and TAC7 were in the same categories.
BP (top 3) and pathways (top 5) of subclusters of the TACs are shown in Fig.4C.TACs proliferated and differentiated rapidly in the intestine after 45 min of ischemia and 90 min of reperfusion.The BP terms translation and proliferation were more significant in some TAC subclusters,including TAC2,TAC3,TAC4,TAC5,TAC6,and TAC8.The pseudotime and scGene module results of the TACs showed that TAC3 could differentiate into TAC5,and TAC2 could differentiate into TAC6,which showed similar functions.However,the cell numbers in different groups showed that TAC5 and TAC6 came from the sham group and I 45 min/R 720 min group,respectively.The difference between them was reflected in the BP term of the oxidation-reduction process in TAC6 cells.From GO and pathway analyses,we found that TAC0,TAC1,and TAC7 showed absorption,metabolism,and antigen processing functions,and TAC8 was closely related to the defense response and immune response.
3.4.The subclusters,differentiation trajectory,and the function of PCs in II/R
Four subsets of PCs were identified from the groups (Fig.5A),namely,cluster 0(PC0,43.5%of all PCs,Reg1+),cluster 1(PC1,38.1%of all PCs,Defa24+),cluster 2(PC2,12.5%of all PCs,Gm14851+),and cluster 3(PC3,5.8%of all PCs,Ptprf+).The violin plots of one marker gene of each cluster are summarized in Fig.S5A.Subsequently,the amounts of PCs depicted in thetSNE per experimental group were determined according to different clustering algorithms (Fig.S5B),in which PC3 belonged to the sham group (1.51% of PCs).After 45 min of ischemia and 90 min of reperfusion,the numbers of PCs were increased(96.97%of all PCs),and these PCs included PC0,PC1,PC2,and PC3.With prolonged reperfusion time,the number of PCs gradually decreased.At 720 min of reperfusion,PCs were greatly reduced (0.83% of all PCs),which was similar to the control group(0.41% of PCs).Based on the distribution of the different subtypes on the pseudotime trajectory (Fig.5B),PC3 was located at the starting point of the time axis with a low differentiation ability,and PC0 and PC1 were proliferative cells.
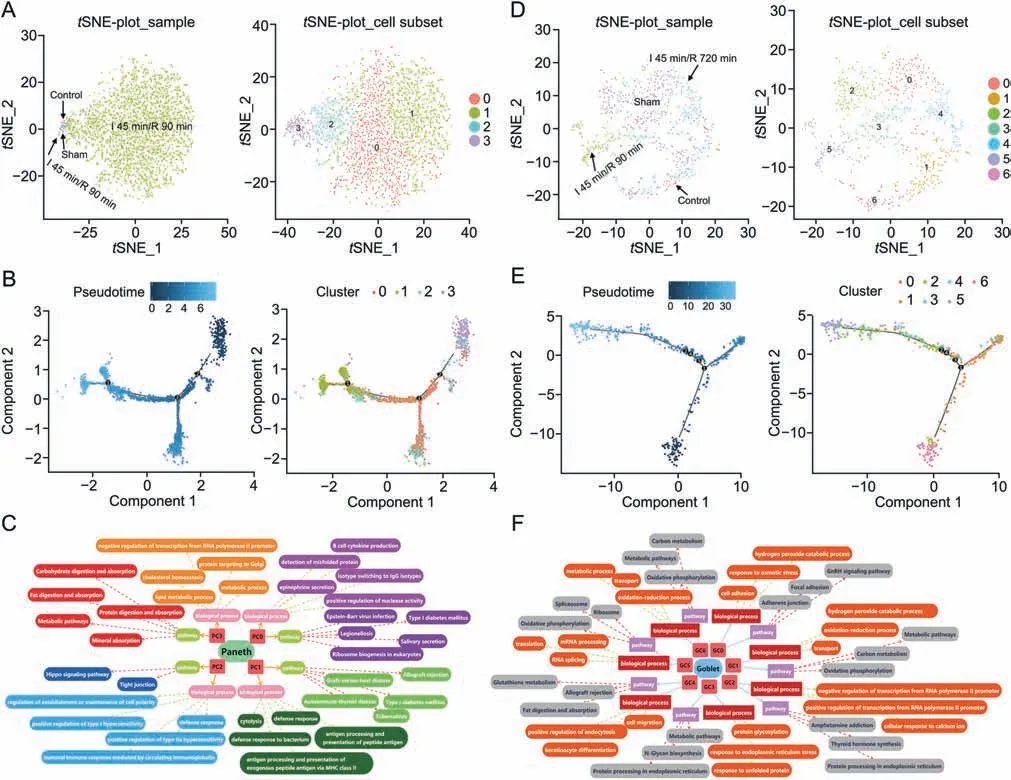
Fig.5.The subclusters,differentiation trajectory,and the function of Paneth cells(PCs)and goblet cells(GCs)in intestinal ischemia/reperfusion(II/R)injury.(A)tSNE-plot_sample and tSNE-plot_cell subsets of the PCs. tSNE-plot_sample clustered intestine-specific cells by control,sham,I 45 min/R 90 min and I 45 min/R 720 min groups,and tSNE-plot_cell subsets clustered by the identified major subclusters,including Paneth cluster 0 (PC0),cluster 1 (PC1),cluster 2 (PC2),and cluster 3 (PC3).(B) The pseudotime trajectory and pseudotime tree of PCs in II/R injury.(C) Top 5 significant biological processes terms (P <0.05) and top 5 significant pathway terms (P <0.05) of subclusters of PCs.(D) tSNEplot_sample and tSNE-plot_cell subsets of the GCs. tSNE-plot_sample clustered GCs by control,sham,I 45 min/R 90 min and I 45 min/R 720 min groups,and tSNE-plot_cell subsets clustered GCs by the identified major subclusters,including goblet cluster 0 (GC0),cluster 1 (GC1),cluster 2 (GC2),cluster 3 (GC3),cluster 4 (GC4),cluster 5 (GC5),and cluster 6 (GC6).(E) The pseudotime trajectory and pseudotime tree of GCs in II/R injury.(F) Top 3 significant biological processes terms (P <0.05) and top 3 significant pathway terms(significant terms with black dashed boxes,P <0.05)of subclusters of GCs.The differentiation trajectory included the arrangement diagram of time distance(color from dark to light was in‘pseudotime’order,and the location with the darkest color was the starting point of the pseudotime;those cells had the characteristics of being undifferentiated or poorly differentiated) and the distribution diagram of subclusters based on pseudotime.
The gene sets of the QuSAGE assay of each subcluster showed that there were also considerable differences (Fig.S5C).For PC0,growthfactor cytokine gene,G1_S gene,and G2_M gene were highly expressed,thus indicating the strong differentiation ability of PC0 cells.For PC1,CD8 cell activation gene,treg gene,cytokine gene,TAM-M1 gene,and immune checkpoint activation receptor gene with high expressions suggested their important roles in immune activation and immune defense of PC1 cells.BP (top 5)and pathways(top 5)of subclusters of PCs are shown in Fig.5C.PC0 cells in the stage of proliferation and differentiation had a significant BP term of B-cell cytokine production.PC1 cells were the main part of immune defense,and PC2 cells also showed functions in the immune response.PC3 cells,which are resting cells with weak immune defense effects,possess the functions of digestion and absorption.
3.5.The subclusters,differentiation trajectory,and the function of GCs in II/R
As shown in Fig.5D,goblet cells were identified into 7 subclusters,namely,cluster 0 (GC0,17.6% of all GCs,Ido1+),cluster 1(GC1,17.6% of all GCs,Rbp2+),cluster 2 (GC2,16.1% of all GCs,Rasa4+),cluster 3 (GC3,15.2% of all GCs,Agr2+),cluster 4 (GC4,13.0%of all GCs,Sprr2a3+),cluster 5(GC5,12.3%of all GCs,C1qbp+),and cluster 6 (GC6,7.9% of all GCs,Ano6+).The violin plots of cluster-specific gene expression of each cluster are shown in Fig.S6A,and the amounts of GCs depicted intSNE per experimental group were determined according to different clustering algorithms (Fig.S6B).The amount of GC6 (7.9% of GCs) was greatly decreased after II/R injury and was barely increased in the recovery process.In contrast,GC5 (12.4% of GCs) showed a strong proliferation ability dominated in the I 45 min/R 90 min group (68.2% of GC5),with numbers at 7.5 times that of the sham group.GC6,which is located at the start of the time axis with a weak cell proliferation ability,was greatly decreased after II/R injury and was barely increased in the process of recovery (Fig.5E).In contrast,GC5,which is located at the end of the time axis with a strong proliferation ability,dominated in the I 45 min/R 90 min group.GC2 and GC3 approached GC5,and GC0,GC1 and GC4 were located on the first branch.
The QuSAGE results of GCs (Fig.S6C) showed that immunerelated genes were highly activated in GC2 and GC3 cells,and immune checkpoint inhibition ligand gene,growth factor gene,and immune checkpoint inhibition receptor gene were highly activated in GC0 and GC4 cells.However,immune-related genes and antiinflammatory genes were less activated in GC1 and GC6.Moreover,GC2 and GC3,GC0 and GC4,and GC1 and GC6 were in the same categories.Furthermore,G2_M gene,cytolytics effector pathway gene,and pro_inflammatory gene were highly activated in GC5.According to the scGene module result of GCs(Fig.S6D),GC1 and TAC6,GC0 and GC4,and GC2 and GC3 comprised the same categories.
The BPs (top 3) and pathways (top 3) of subclusters of GCs are shown in Fig.5F.In GC0 cells,the BP terms were cell adhesion associated with osmotic stress and hydrogen peroxide catabolic process.Thus,the main function of the GC0 cells was cell adhesion,and the functions of GC1 and GC6 cells included mucus secretion and material metabolism.GC2 and GC3 cells were in the stage of cell proliferation and differentiation.GC5 also had the ability of cell proliferation.In addition,GC5 showed a defense response,positive regulation of the adaptive immune response,and negative regulation of the inflammatory response to antigenic stimuli(P<0.05).From the BP terms and pathways of GC4,we found that they were closely related to cell differentiation and migration.
3.6.Subclusters of T cells and their heterogeneity in II/R
As shown in Fig.6A,T cells were divided into 13 clusters,namely,cluster 0 (TC0),cluster 1 (TC1),cluster 2 (TC2),cluster 3(TC3),cluster 4 (TC4),cluster 5 (TC5),cluster 6 (TC6),cluster 7(TC7),cluster 8 (TC8),cluster 9 (TC9),cluster 10 (TC10),cluster 11(TC11),and cluster 12 (TC12).Cluster-specific genes were used to ascertain the cell type with classic markers,and the heatmap showed the genes of each cell type with significantly different expressions (Fig.S7A).The heatmap of 41 mouse gene sets of the 13 subclusters of T cells showed that immune-related genes were highly expressed (Fig.S7B).Afterwards,the amounts of T cells in different groups were analyzed,and the results are summarized in Fig.S7C.TC0,TC1,and TC5 accounted for 4.5% of T cells in the control group and 29.64% in the sham group.After 45 min of ischemia and 90 min of reperfusion,more T cells appeared(49.84%of T cells),and the major subclusters were TC2,TC3,TC4,TC6,TC7,TC8,and TC9,which were used to develop cellular immune function.At 720 min of reperfusion,the number of T cells was decreased (16.05% of T cells).Furthermore,T cells were classified into the following three categories: Innate lymphoid cells (ILCs)(TC11 and TC12),CD4 cells(TC4 and TC9),and CD8 cells(TC0,TC1,TC2,TC3,TC5,TC6,TC7,TC8,and TC10).
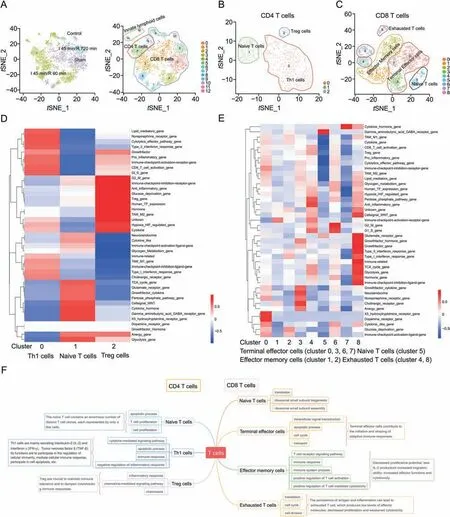
Fig.6.Subpopulations of T cells(TCs)and the heterogeneity of CD4 and CD8 T cells in intestinal ischemia/reperfusion injury.(A)tSNE clustering of T cells colored by control,sham,I 45 min/R 90 min and I 45 min/R 720 min groups,and tSNE clustering of T cells colored according to the 13 identified major cell clusters.(B)tSNE clustering of CD4 cells according to the three identified major cell clusters(Th1,naive and Treg cells).(C)tSNE clustering of CD8 cells according to the 9 identified major cell clusters of terminal effector cells,effector memory cells,exhausted T cells and naive T cells.(D)QuSAGE heatmap of the mouse 41 gene set of CD4 T cells.(E)QuSAGE heatmap of the mouse 41 gene set of CD8 T cells.(F)Some significant pathway terms (P <0.05) and the function of subclusters of TCs.Th1: type 1 T helper;Treg: T regulatory cell.
Afterwards,we further analyzed CD4 and CD8 T cells.As shown in Fig.6B,three subsets of CD4 T cells,including naive cells(cluster 0),T helper effector cells (Th1,cluster 1) and T regulatory cells(Tregs,cluster 2),were found in the II/R process.In the I 45 min/R 90 min group,Th1 cells rapidly proliferated and exhibited the largest number,followed by naive and Treg cells (Fig.S7D).Furthermore,there were 9 subsets of CD8 T cells,which were defined as 4 cell types (Fig.6C),namely,terminal effector cells(clusters 0,3,6 and 7),effector memory cells (clusters 1 and 2),exhausted T cells (clusters 4 and 8),and naive T cells (cluster 5).The number of proliferating effector memory cells,exhausted T cells and naive T cells was the largest in the I 45 min/R 90 min group and gradually decreased during the recovery of intestinal function (Fig.S7E).
The marker heatmaps,marker violin plots,and gene bubble plots of the CD4 cell subsets are shown in Figs.S8A-C.The different activation of gene sets in the three cell lines(Fig.6D)indicated that their functions were different.In Th1 cells,the gene sets of immune-related,TAM-M1 gene,and immune checkpoint inhibitor ligand gene were highly activated.In naive cells(cluster 1),the cell signal-WNT,cytokine hormone,gamma aminobutyric acid GABA receptor and X5 hydroxytryptamine receptor gene sets were highly activated.In Treg cells (cluster 2),the immune checkpoint inhibition receptor gene,anti-inflammatory,Treg gene,and TAM-M2 gene were highly activated.
The marker heatmap and scGene module results of CD8 cells demonstrated the basis of cell classification (Figs.S9A and B).The marker heatmap and gene bubble plot of cell subtypes showed thatGzma,Gzmb,Nkg7,andPrf1were highly expressed in terminal effector cells.In addition,Lag3,Tigit,Pdcd1,Ctla4,andHavcr2were highly expressed in effector memory cells,andCcr7,SellandLef1were more highly expressed in exhausted Tcells.Cd8a,Eomes,Ptprc,andTbx21were more highly expressed in naive Tcells(Figs.S9C-F).Terminal effector cells,which represent the most important component of CD8 cells,began to proliferate in the sham group.The different activation of gene sets in the three cell lines indicated that their functions were different (Fig.6E).Finally,the functions of various T cells in the II/R process are summarized in Fig.6F according to pathways.
3.7.Cell differentiation and cell-cell communication
The pseudotime trajectory of ECs,PCs,GCs,TACs,and SCs in II/R injury was analyzed (Fig.7A),and the results showed that mature epithelial cell types differentiated from common intestinal stem cells via TACs in II/R injury.There were two main differentiation fates in the pseudotime trajectory,which are indicated as state 3 and state 4.The statistical data suggested that most ECs were in state 3 and state 4.TACs differentiated rapidly in the I 45 min/R 90 min group;moreover,most of them were in state 4,and SCs were in state 1 and state 4.Furthermore,most GCs were in state 1,and most PCs were in state 1 and state 5.
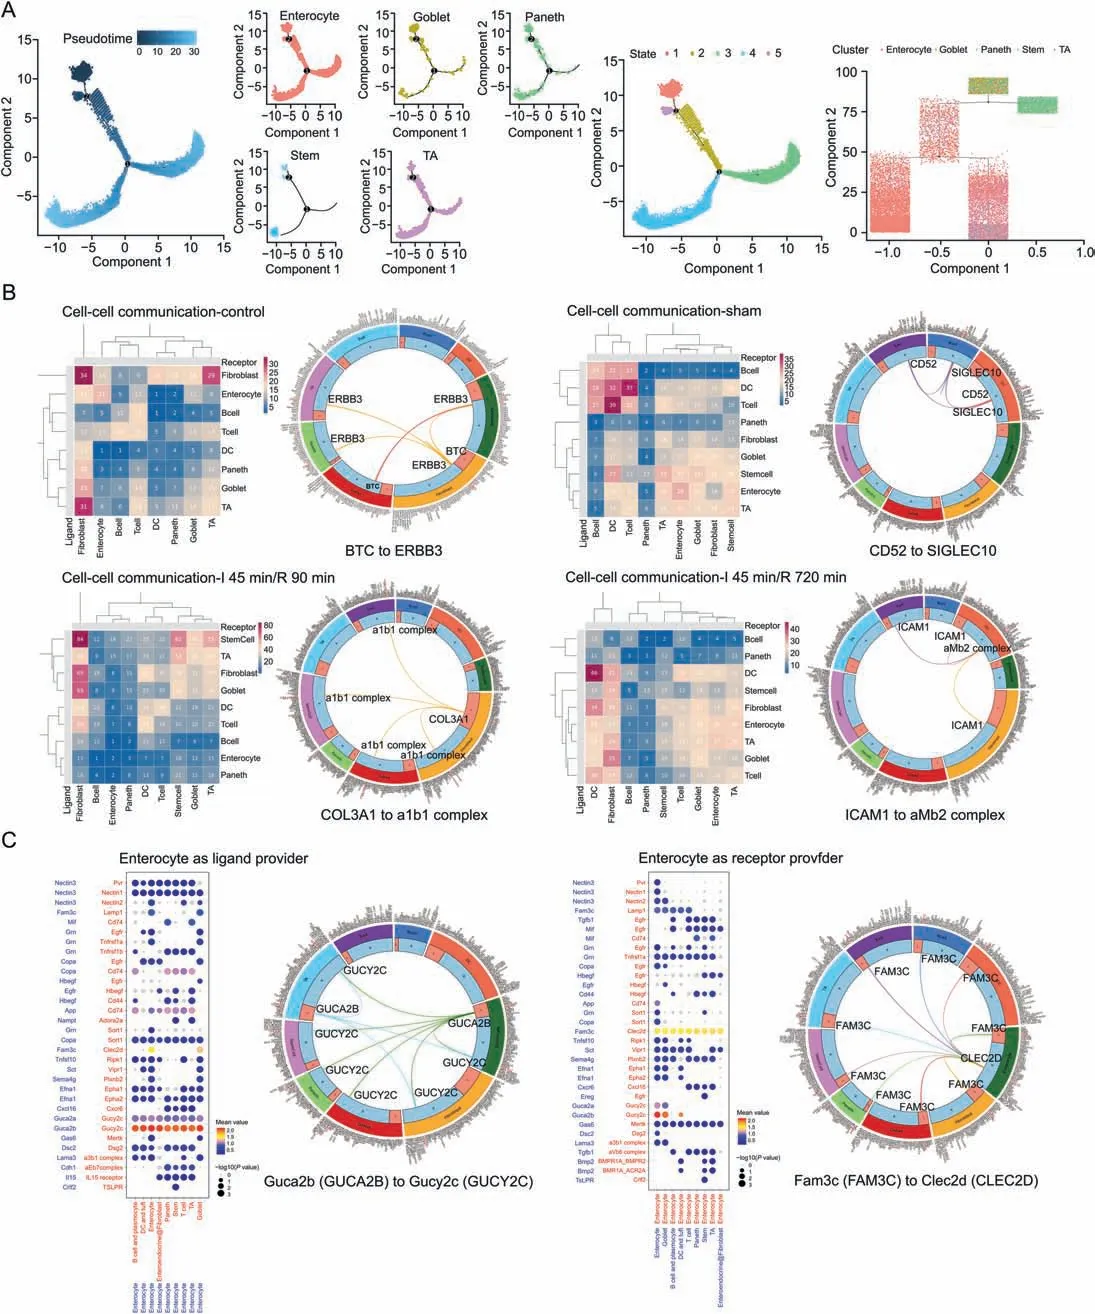
Fig.7.Cell differentiation and cell-cell communication in intestinal ischemia/reperfusion(II/R)injury.(A)The pseudotime trajectory and pseudotime tree of enterocyte cells(ECs),goblet cells(GCs),Paneth cells(PCs),stem cells(SCs),and TA cells(TACs)in II/R injury.The differentiation trajectory included the arrangement diagram of time distance(color from dark to light was in‘pseudotime’order,and the location with the darkest color was the starting point of the pseudotime;those cells had the characteristics of being undifferentiated or poorly differentiated) and the distribution diagram of subclusters based on pseudotime.(B) Heatmaps of cell communication in the control,sham,I 45 min/R 90 min and I45 min/R 720 min groups(P <0.05,rank <1).X-axis:cluster as receptor;Y-axis:cluster as secretory protein;Color:the number of interactions between cell types.(C)Bubble plot of cell-cell interactions between cell types and ECs.ECs were the providers of ligands on the left,and ECs were the providers of receptors on the right.The size of the ball represents the P value,and the depth of the color represents the intensity of the relationship (significant means).
The cell-cell communications among BCs,DCs,ECs,EFs,GCs,PCs,SCs,TCs,and TACs were evaluated,and a cluster analysis was performed according to the number of relationships when different cell types in different groups were used as providers of ligands and receptors (Fig.7B).The interaction between cells was different in the groups,which was associated with the changes in cell number and species during the process of II/R damage.In the control group,the number of intercellular interactions between TACs and fibroblasts and between fibroblasts and fibroblasts was large.A cell phone analysis showed that BTC to ERBB3 played an important role.In the sham group,the values of intercellular interactions between DCs and DCs and between DCs and TCs were larger than those in the control group,thus suggesting that when the body was injured and the intestine was exposed,DC cells and TCs were activated,and the interaction between immune cells was increased.In the I 45 min/R 90 min group,the values of intercellular interactions between SCs and fibroblasts,fibroblasts and fibroblasts,fibroblasts and GCs,and SCs and SCs were larger than those in the sham group.In the group subjected to I 45 min/R 720 min,the values of intercellular interactions between DCs and DCs and between fibroblasts and GCs were large.
It is worth noting that ECs represented the largest cell cluster in the intestine,and their interactions with other cell types were of great value in II/R.The cellphone bubbleplot results mainly showed the first 50 relationships in an ascending order of the rank of partners with ECs as ligands and receptors (Fig.7C).Uroguanylin(Guca2b or Ugn) secreted by ECs can interact with guanylate cyclase C(Gucy2c or GC-C)on the cell membranes of other cells to produce intercellular communication.Clec2d was identified in the present study as a Fam3c receptor,and research on the role of Clec2d and Fam3c in II/R injury will become a heavily researched topic.They are of great value and worthy of further investigation.
3.8.GSTM3 protected intestinal barrier function by adjusting the MAPK signaling pathway
In the present study,we found thatGstm3,which is an important gene of ECs,PCs,and TACs (Fig.8A),proliferated and differentiated rapidly in II/R injury.Thus,Gstm3was selected as the target gene for the molecular investigation of intestinal mucosa damage induced by II/R.GSTM3 siRNA transfection experiments were performed in mice to evaluate the function of GSTM3.Based on Western blotting assays,compared with that in the sham group,the protein level of GSTM3 was increased in the I 45 min/R 90 min group of mice.Compared with that in the I 45 min/R 90 min group,the protein level of GSTM3 was decreased in the I 45 min/R 720 min group.Moreover,GSTM3 siRNA transfection induced a decrease in GSTM3 expression in the si-GSTM3+I 45 min/R 90 min group and in the si-GSTM3+I 45 min/R 720 min group(Fig.8B).The levels of DAO and D-lactic acid in the serum of mice in the I 45 min/R 90 min group were higher than those in the control group.However,there was no significant difference between the control group and the I 45 min/R 720 min group.After GSTM3 silencing,the serum levels of BAO and D-lactic acid in the si-GSTM3+I 45 min/R 90 min groupwere significantly decreased compared with those in the I 45 min/R 90 min group (Fig.8C).In addition,the expression levels of ZO-1 and Claudin-1 (which are markers of intestinal mucosal injury) in the I 45 min/R 90 min group were decreased compared with those in the sham group.GSTM3 siRNA increased the expression levels of ZO-1 and Claudin-1,which showed that GSTM3 siRNA had a protective effect on intestinal mucosal damage(Fig.8D).Furthermore,H&E staining of intestinal tissues in mice after GSTM3 siRNA transfection also showed that GSTM3 siRNA improved the histopathological damage induced by II/R (Fig.8E).The results of the RNA-seq analysis indicated that the MAPK pathway was important for II/R injury(Fig.8F).The verification results are shown in Fig.8G.Compared with those in the sham group,the expression levels of p-ERK/ERK were decreased in the I 45 min/R 90 min group.In addition,the expression levels of p-P38/P38 and p-JNK/JNK were increased in the I 45 min/R 90 min group.After GSTM3 siRNA transfection,the expression levels of p-ERK/ERK were increased in the si-GSTM3+I 45 min/R 90 min group,and the expression levels of p-P38/P38 and p-JNK/JNK were decreased in the si-GSTM3+I 45 min/R 90 min group.Thus,GSTM3 demonstrated an effect on intestinal barrier by adjusting the MAPK signaling pathway.
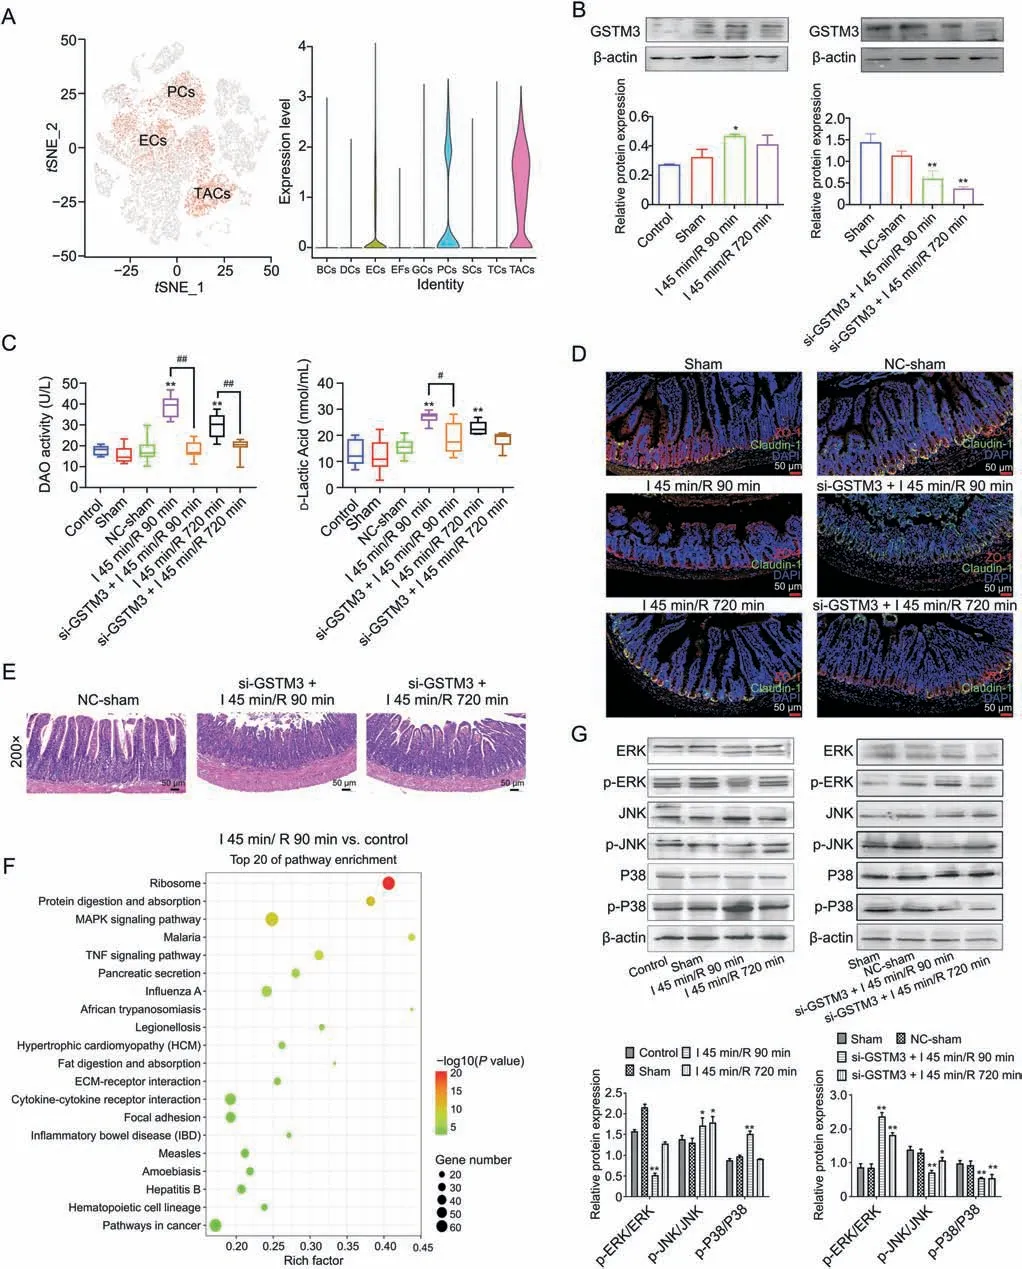
Fig.8.GSTM3 protects intestinal barrier function via the mitogen-activated protein kinases(MAPK)signaling pathway.(A)Distribution of Gstm3 in whole single cells and violin plot of Gstm3 in each cell population.(B) Protein level of GSTM3 in the intestinal tissue of the control,sham,I 45 min/R 90 min and I 45 min/R 720 min groups (*P <0.05,**P <0.01 compared with the control),and protein level of GSTM3 in the intestinal tissue after transfection with GSTM3 siRNA(*P <0.05,**P <0.01 compared with the sham group).(C)The serum levels of diamine oxidase(BAO)and D-lactic acid in control,sham,negative control(NC)-sham,I 45 min/R 90 min,si-GSTM3+I 45 min/R 90 min,I 45 min/R 720 min and si-GSTM3+I 45 min/R 90 min mice(**P <0.01 compared with the control group;#P <0.05,##P <0.01).(D)Immunofluorescence of ZO-1 and Claudin-1 in intestinal tissues of control,sham,NC-sham,I 45 min/R 90 min,si-GSTM3+I 45 min/R 90 min,I 45 min/R 720 min and si-GSTM3+I 45 min/R 90 min groups (200 ×).(E) Hematoxylin and eosin (H&E)staining of intestinal tissues(200×)in mice after GSTM3 siRNA transfection(200×).(F)The top 20 Gene Ontology(GO)enrichment terms of differentially expressed genes in the I 45 min/R 90 min group and control group(log2 fold change cut off:0.585).(G)The expression levels of ERK,p-ERK,JNK,p-JNK,P38,and p-P38 in intestinal tissue from the control,sham,I 45 min/R 90 min and I 45 min/R 720 min groups (*P <0.05,**P <0.01 compared with the control),and the protein levels of ERK,p-ERK,JNK,p-JNK,P38,and p-P38 in intestinal tissues after transfection with GSTM3 siRNA (*P <0.05,**P <0.01 compared with the sham group).
4.Discussion
The characterization of the cell types of an organ is helpful for understanding its development and function.Similarly,an understanding of the damage and repair of an organ also requires the characterization of cell types throughout the entire procedure.A high-resolution,single-cell survey revealed the diversity of cells in the proximal(duodenum and jejunum)and distal(ileum)regions of the mouse intestinal epithelium.The jejunum is located behind the duodenum,with a thick lumen and a thick tube wall.It has a powerful emptying function and involves most cell types,such as ECs,GCs,PCs,EECs,SCs,TACs,and Tuft cells[35,36].In this study,we identified 9 cell populations in the mouse jejunum,including TCs,BCs and the abovementioned 7 cell populations.II/R injury,an important pathogenesis for acute intestinal barrier disruption,can disrupt epithelial integrity,mucosal immunity,and microflora [37].Currently,an increasing number of studies have been conducted at the molecular level to reduce II/R [38].However,relatively few studies have been conducted on cell-based strategies to effectively improve injury.The identification of rare cell types in the process of II/R injury,such as new ECs,short-lived PCs or abnormally proliferating GCs,is very important for understanding the biological function of the intestine in the process of injury and repair.
ECs with important roles in the development,degeneration,and repair of the intestine[39]are located at the tips of the villi,which are more sensitive to the insult of ischemia.After II/R,the mitochondria of ECs were severely damaged,which is particularly important for cellular energy metabolism [40].Furthermore,ECs directly experience the challenge of a large number of microbiota,including pathogens and symbionts,in the intestine.Therefore,a series of strategies have evolved to contribute to host immunity[41].In this study,we observed heterogeneity of ECs in the II/R process.There was a large amount of EC apoptosis after I 45 min/R 90 min.With the prolongation of reperfusion time,the EC number increased rapidly,and intestinal function basically recovered after 720 min of reperfusion.During the course of the II/R process,cell subclusters,such as EC2,EC5 and EC6,emerged with strong vitality in the face of injury.These subclusters have the same characteristics,with low expression levels of the G1-S gene,glycolysis gene,cytokine gene,and TCA cycle gene.In numerous metabolic pathways,such as gluconeogenesis,the TCA cycle,glycolysis and fatty acid oxidation,oxygen plays a critical role,and the adaptation of cells to hypoxia is mediated by transcription factors[42].Our study suggested that the adaptation of cells to hypoxia is the reason why these clusters are less affected by II/R injury.The main function of the intestinal tract is digestion and absorption,and this function is mainly completed by ECs.ECs are the most dynamic and selfrenewing cell type,and it only takes three to five days to migrate from the bottom of the recess to the tip of the villus [43].In addition,cell-cell junctions link cells to each other,and they regulate tissue homeostasis in tissue barrier function,cell proliferation,and migration [44].Thus,adhesion junction-and gap junction-related genes are highly expressed in intestinal regeneration after II/R injury.EC1,EC3 and EC8 are new ECs in the I 45 min/R 720 min group;moreover,EC1 and EC3 perform the function of digestion and absorption,but the main function of EC8 involves cell-cell junction.Compared with ECs existing before injury,they have lower expressions of immune-related genes and higher expressions of cytokine-like genes,anti-inflammatory genes,pentose phosphate pathway genes,and HIF-regulated genes.These findings suggested that these cells have the characteristics of reduced consumption of oxygen and the high expression of anti-inflammatory genes and hypoxia-regulating genes to adapt to changes in the intestinal microenvironment.
During the II/R process,ECs apoptosis can activate SCs division and differentiation programs,and SCs can be divided into SCs and TACs [45].TACs can rapidly produce many differentiated cells during development or regeneration [46].In the present study,TACs were the main source of ECs,which were significantly increased in the I 45 min/R 90 min group.The differentiation trend,cell gene characteristics,and cell function of TACs demonstrated that most TACs are in the stage of proliferation and differentiation and do not have specific functions.Only a few cells that tend to differentiate and mature exhibit the function of ECs,such as TCA0 and TCA1.TAC5 is a TCA in the normal tissue state and is differentiated from TAC3.TAC6 differentiated from TAC2 is the type of TAC in the state after injury.
As a highly specialized cell type,PCs are located at the base of the crypts of Lieberkühn in the small intestine and play integral roles in maintaining intestinal homeostasis and modulating the physiology of the small intestine [47].A previous study demonstrated that mature PCs defend against microbial invasion by secreting antimicrobial peptides,including α-defensins/cryptdins[48],which also play significant roles in the normal injury and repair mechanisms of the intestinal epithelial layer and the levels of intestinal inflammation [49].More intriguingly,defensins and other factors that are secreted by PCs help to sustain and regulate the epithelial stem and progenitor cells cohabiting in the crypts,as well as helping to regenerate the small intestinal epithelium [50].Furthermore,genetic or pharmacological depletions of PCs can attenuate II/R injury [51].During the process of II/R,PCs rapidly proliferate after injury and gradually return to normal with prolonged reperfusion time.Four PC clusters were found,and PC0 cells had a strong ability to differentiate into PC1-secreting peptides and proteins.With recovery from damage,the short-lived PCs disappeared,with only PC3 cells remaining.Moreover,PCs act as regulators and guardians of stem cells and can transform environmental signals into the intestinal epithelial response[52].In this study,the PCs had the same change trend as SCs and TACs,and the intercellular interactions between the three cell clusters wereenhanced in the I 45 min/R 90 min group.
GCs are relatively few in the intestinal tissue,but they play an important role in maintaining intestinal homeostasis [53].These cells specialize in the synthesis and secretion of intestinal mucus,and GCs act as antigen importers and may serve as regulators of innate immune function [54].Our study found that GC5 was a special and novel GC subcluster,in which the proinflammatory gene,cell signal_WNT,and norepinephrine receptor gene were highly activated.During the II/R process,the numbers of GC0,GC1,GC2,GC3,GC4,and GC6 cells were decreased,whereas the number of GC5 cells was substantially increased in the I 45 min/R 90 min group.GC5 was identified by marker genes,including C1qbp,Ifitm2,and Atad3a.These genes are involved in the process of inflammation and infection.C1qbp can participate in the positive regulation of neutrophil chemotaxis,the positive regulation of trophoblast cell migration,and the negative regulation of interleukin-12 production [55,56].More interestingly,the intercellular interaction results showed that GC5 had a strong interaction with TCs and BCs at I 45 min/R 90 min,thus suggesting that GC5 cells may be an important factor for immune regulation.
The immune system of the small intestine includes various immune cells and lytic granule products,which can protect the host against potential toxins and pathogens[57].Increasing evidence has supported the therapeutic potential of the targeting of T cells.However,T cells,including several heterogeneous cell populations,can significantly respond to the intervention [58].Previous studies have shown that CD4 T cells are an extremely important part of immune homeostasis and inflammation,and multiple cell subsets have been described in the intestine [59].In II/R,naive CD4 T cells can proliferate and differentiate into several possible effector subsets,including Th1 and Treg cells.Among them,Treg cells,as a mature subset of CD4 T cells with regulatory functions,play important roles in maintaining immune homeostasis and immune tolerance[60].CD8 T cells are important for the immunoprotection of intracellular pathogens and tumors and can be classically categorized into terminal effector cells,effector memory cells,exhausted T cells,and naive T cells.ILCs have a strong innate immune effect in promoting resistance to intestinal pathogens[61].This study further described the changes and functions of T cells during the process of II/R injury.Th1 cells can mediate the immune response and negatively regulate the inflammatory response.Moreover,Treg cells can participate in the inflammatory response,and effector memory cells are the main part of cellular immunity in II/R injury.
Gucy2c is expressed on the luminal aspect of the intestinal epithelium.It is a transmembrane receptor that binds to its specific ligands (Guca2a and Guca2b) and regulates intestinal barrier function,ion secretion,and epithelial monolayer homeostasis through cGMP-dependent signal pathways [62].In addition,the Gucy2ccGMP signaling axis can promote intestinal mucosal wounding and inflammation,which can also regulate mucosal immune homeostasis.Guca2b and Gucy2c can negatively regulate the expression levels of inflammatory cytokines [63,64].In addition,Gucy2c provides homeostatic signals that modulate ER stress and cell vulnerability as part of the machinery contributing to the integrity of intestinal SCs [65].Thus,Guca2b and Gucy2c can be used as therapeutic targets for II/R injury by regulating the inflammatory response and promoting cell proliferation.In addition,Fam3c secreted by 9 cell types can interact with Clec2d on the cell membrane of ECs to produce intercellular communication.As a cytokinelike protein,Fam3c is widely described in multiple organizations and plays crucial roles in the epithelial-to-mesenchymal transition and subsequent metastasis during cancer progression [66,67].Previous studies have found that Clec2d exists in epithelial cells,leukocytes,and mesenchymal cells and can bind to histones released during the death of necrotic cells [68,69].Fam3c and Clec2d may be potential and attractive therapeutic targets for the treatment of II/R injury.
GSTM3,which is a xenobiotic detoxifying phase II enzyme,is related to the detoxification of carcinogens and the metabolism of exogenous electrophilic substances [70].It has been reported that GSTM3 can exert important functions in many types of diseases,including cancer,Alzheimer’s disease,cataracts,neurocysticercosis,and cystic fibrosis [71].The present study showed that GSTM3 played critical roles in the degree of II/R injury and intestinal barrier function by regulating the MAPK signaling pathway.
5.Conclusion
Characteristic and functional cells in the jejunum,as well as new species generated during the recovery process after II/R injury,were identified in this study.Immune and defensive cells that proliferate in response to injury were also described,and we identified several new cells,including PC1 and GC5.We can gain a better understanding of II/R injury through the heterogeneity of various cells and the generation of specific cells,which can provide a new perspective for therapeutic research on II/R injury.
CRediT author statement
Lianhong Yin:Investigation,Validation,Writing -Original draft preparation,Data curation;Meng Gao:Conceptualization,Methodology,Visualization;Lina Xu:Formal analysis,Data curation;Yan Qi:Software,Data curation,Writing-Reviewing and Editing;Lan Han:Resources,Supervision,Visualization;Jinyong Peng:Conceptualization,Project administration,Writing-Reviewing and Editing.
Declaration of competing interest
The authors declare that there are no conflicts of interest.
Appendix A.Supplementary data
Supplementary data to this article can be found online at https://doi.org/10.1016/j.jpha.2023.02.002.
 Journal of Pharmaceutical Analysis2023年7期
- Journal of Pharmaceutical Analysis的其它文章
- Single-cell RNA-sequencing and subcellular spatial transcriptomics facilitate the translation of liver microphysiological systems for regulatory application
- Dissecting the brain with spatially resolved multi-omics
- New discoveries in the field of metabolism by applying single-cell and spatial omics
- Single-cell analyses reveal cannabidiol rewires tumor microenvironment via inhibiting alternative activation of macrophage and synergizes with anti-PD-1 in colon cancer
- Cux1+ proliferative basal cells promote epidermal hyperplasia in chronic dry skin disease identified by single-cell RNA transcriptomics
- Discovering metabolic vulnerability using spatially resolved metabolomics for antitumor small molecule-drug conjugates development as a precise cancer therapy strategy