
Discovering metabolic vulnerability using spatially resolved metabolomics for antitumor small molecule-drug conjugates development as a precise cancer therapy strategy
2023-09-05 00:33XiangyiWangJinZhangKailuZhengQianqianDuGuoaiWangJianpengHuangYanheZhouYanLiHongtaoJinJiumingHe
Xiangyi Wang ,Jin Zhang ,Kailu Zheng ,Qianqian Du ,Guoai Wang ,Jianpeng Huang ,Yanhe Zhou ,Yan Li ,**,Hongtao Jin ,Jiuming He ,*
a State Key Laboratory of Bioactive Substance and Function of Natural Medicines,Institute of Materia Medica,Chinese Academy of Medical Sciences and Peking Union Medical College,Beijing,100050,China
b NMPA Key Laboratory of Safety Research and Evaluation of Innovative Drug,Institute of Materia Medica,Chinese Academy of Medical Sciences and Peking Union Medical College,Beijing,100050,China
c Beijing Key Laboratory of New Drug Mechanisms and Pharmacological Evaluation Study,Institute of Materia Medica,Chinese Academy of Medical Sciences and Peking Union Medical College,Beijing,100050,China
d New Drug Safety Evaluation Center,Institute of Materia Medica,Chinese Academy of Medical Sciences and Peking Union Medical College,Beijing,100050,China
Keywords: Mass spectrometry imaging Spatially resolved metabolomics Small molecule-drug conjugate Tumor metabolism Targeted tumor therapy
ABSTRACT Against tumor-dependent metabolic vulnerability is an attractive strategy for tumor-targeted therapy.However,metabolic inhibitors are limited by the drug resistance of cancerous cells due to their metabolic plasticity and heterogeneity.Herein,choline metabolism was discovered by spatially resolved metabolomics analysis as metabolic vulnerability which is highly active in different cancer types,and a cholinemodified strategy for small molecule-drug conjugates(SMDCs)design was developed to fool tumor cells into indiscriminately taking in choline-modified chemotherapy drugs for targeted cancer therapy,instead of directly inhibiting choline metabolism.As a proof-of-concept,choline-modified SMDCs were designed,screened,and investigated for their druggability in vitro and in vivo.This strategy improved tumor targeting,preserved tumor inhibition and reduced toxicity of paclitaxel,through targeted drug delivery to tumor by highly expressed choline transporters,and site-specific release by carboxylesterase.This study expands the strategy of targeting metabolic vulnerability and provides new ideas of developing SMDCs for precise cancer therapy.
1.Introduction
Metabolic reprogramming is a widely believed hallmark of malignant tumors[1].Abnormal activation of oncogenes and loss of tumor suppressors drive cancerous cells to reprogram metabolism to enrich nutrients and enhance biosynthesis for tumor proliferation and growth [2].Alterations in tumor metabolism are not merely as downstream consequence of tumor-relevant signal pathways [3];altered metabolites can directly regulate cellular signaling,gene expression,and epigenetics to promote carcinogenesis[4,5].Moreover,metabolic rewiring of tumor cells can affect the destiny of surrounding cells,including stromal cells and immune cells to regulate cancer behavior [6,7].The complex reciprocal interactions between tumor metabolic reprogramming and oncogenic signaling provide rationales and potential targets for targeted metabolic therapy [8].
Currently,a variety of cancer therapies inhibiting metabolic enzymes,which are metabolic vulnerabilities of tumor catabolic,bioenergetic or anabolic pathways,are undergoing preclinical and clinical research [9,10].However,metabolic plasticity can confer tumor cells on resistance to metabolic inhibitors by compensatory mechanism [11,12].Tumor heterogeneity is another major contributor to drug resistance,which leads to variability among patients in drug response [13].Therefore,new strategies are needed to translate metabolic vulnerability into therapies and develop more promising targeted tumor metabolism drugs.
Novel treatment strategies require a deeper and more precise understanding of tumor metabolic vulnerability [14],but intertumoral and intratumoral metabolic heterogeneity causes challenges for identification and utilization of metabolic vulnerability [15].Chromatography-mass spectrometry-based metabolomics analysis has become a powerful tool for tumor metabolism research[16-18].However,the results reflect the average metabolic level of tumor and its microenvironment,losing the spatial distribution information of metabolic alterations in heterogeneous tissues [19].Mass spectrometry imaging (MSI)-based spatially resolved metabolomics can simultaneously obtain the structures and spatial distribution information of thousands of endogenous metabolites and exogenous compounds,providing a new approach to characterize metabolic features in situ [20,21].It may be exploited to accurately acquire metabolic phenotypes in microregions of heterogeneous tumor tissues,which is essential to predict metabolic vulnerability and develop precise cancer therapeutic strategy[22,23].
Small molecule-drug conjugates (SMDCs) specifically bind to targets existing or overexpressed in tumor cells through small molecule ligands,followed by release of the coupled cytotoxic drug which kills cancer cells [24].They have great potential in tumortargeted therapy because they easily permeate into solid tumors,are non-immunogenic,have improved pharmacokinetic properties,and have lower cost [25,26].However,no SMDCs exist in the market because there are very few available small molecule ligands[27].
Herein,we performed spatially resolved metabolomics through home-built airflow-assisted desorption electrospray ionization(AFADESI)-MSI [28-31] on heterogeneous tumor tissues to precisely discover metabolic vulnerability.Choline metabolism was observed highly active in multiple cancer types owing to enhanced choline uptake.Utilizing this metabolic vulnerability,choline was exploited as an active targeting ligand of SMDCs to modify cytotoxic drugs,preventing metabolic plasticity caused by directly inhibiting choline metabolism.The metabolic vulnerability-driven SMDC design strategy(Fig.1) greatly improved the targeting of cytotoxic drugs and reduced their toxicity.More importantly,this work provides a new strategy for targeting metabolic vulnerability which should facilitate further SMDC development to realize more effective and precise therapy.
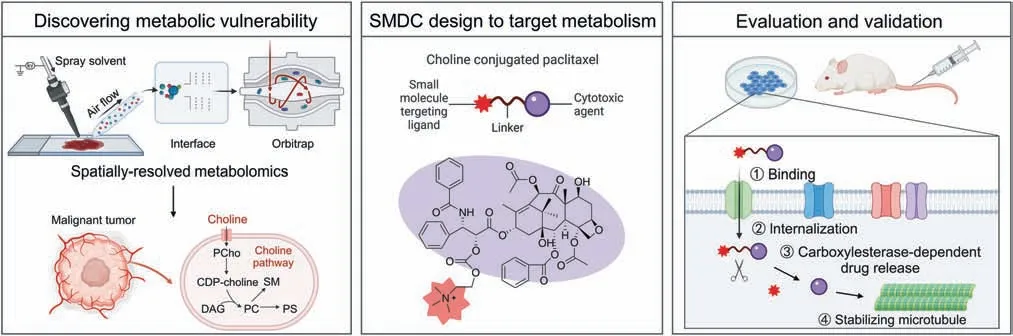
Fig.1.Strategy for the design of small molecule-drug conjugates (SMDCs) based on metabolic vulnerability and spatially resolved metabolomics analysis.CDP-choline: cytidinediphosphocholine;PCho: phosphocholine;DAG: diacylglycerol;PC: phosphatidylcholine;PS: phosphatidylserine;SM: sphingomyelin.
2.Materials and methods
2.1.Chemicals and reagents
Liquid chromatography-mass spectrometry (LC-MS) grade acetonitrile (ACN) and methanol (MeOH) were purchased from Thermo Fisher Scientific (Waltham,MA,USA).Formic acid(FA)was purchased from Merck (Darmstadt,Hessen,Germany).Purified water was obtained from Wahaha (Hangzhou,China).The drug standards paclitaxel (PTX),docetaxel (DTX),and methyl-D9-choline chloride were purchased from Zhenzhun Biotechnologies Co.,Ltd.(Shanghai,China).The four modified taxane compounds were provided by BioDuro Shanghai Co.,Ltd.(Shanghai,China).PTX injection was obtained from Yangtze River Pharmaceutical Co.,Ltd.(Taizhou,China).Hemicholinium-3 (HC-3) was obtained from Sigma-Aldrich(Shanghai) Trading Co.,Ltd.(Shanghai,China).Quinidine and cimetidine were purchased from Macklin (Shanghai,China) and Solarbio (Beijing,China),respectively.Bis(p-nitrophenyl) phosphate(BNPP)was obtained from Shanghai yuanye Bio-Technology Co.,Ltd(Shanghai,China).Huperzine A and neostigmine bromide were purchased from J&K Scientific Ltd(Beijing,China).
2.2.Human and animal sample collection
Four lung cancer tissue samples were obtained from Peking Union Medical College Hospital(Beijing,China).The samples were snap frozen by liquid nitrogen after resection and stored at-80°C for subsequent AFADESI-MSI analysis.The study protocol was approved by the Ethics Review Committee of the Peking Union Medical College Hospital (Approval number: JS-3237) and written informed consent was waived.The patients provided written informed consent and the study protocol was approved by the Ethics Review Committee of the Peking Union Medical College Hospital.
All animal experiments were approved and performed according to the Animal Care and Welfare Committee,Institute of Materia Medica,Chinese Academy of Medical Sciences and Peking Union Medical College(CAMS&PUMC)(Approval number:00003552 and 00009484).Animals were purchased from Beijing Vital River Laboratory Animal Technology Co.,Ltd.(Beijing,China).In the spatially resolved metabolomics research,C57BL/6J male mice (16-18 g)were subcutaneously inoculated with 1 × 10⁷Lewis lung cancer(LLC,lung cancer),EMT6 (breast cancer),C26 (colon cancer),and H22(liver cancer)cells,respectively(8 mice per group).Mice were sacrificed by cervical dislocation when tumors grew to 1,200 mm3.Tumors were collected and stored at -80°C for subsequent AFADESI-MSI analysis.
Isotopic tracing experiment used randomly divided C57BL/6J male mice bearing LLC.Methyl-D9-choline chloride was intravenously(IV)administered on the 7th day after LLC cells inoculation.Mice were sacrificed at 30 min,4 h,10 h,and 24 h after injection(3 mice for each time point),and tumors were collected and stored at -80°C for subsequent AFADESI-MSI analysis.Tumors in the control group(n=3) were collected before injection.
The antitumor activity study used randomly divided C57BL/6J male mice bearing LLC treated with different compounds by IV injection (7-8 mice per group).Drugs were administered on the 1st,4th,7th,and 10th day after LLC cells inoculation using the dosages listed in Tables S1-S3.Mice were sacrificed on the 11th day.
The toxicity experiment used randomly divided male,6-weekold Sprague-Dawley (SD) rats (3 rats per group) with repeated IV injections of PTX-R (6 mg/kg),PTX-R (12 mg/kg),PTX (5 mg/kg),and solvent (control group).Drugs were administered on the 1st,4th,7th,and 10th day.Rats were sacrificed on the 13th day and the related toxicity indicators were detected.
2.3.Tissue section preparation
Tumors were transferred to a cryostat microtome (CM 1860 UV,Leica,Nussloch,Baden-Wurttemberg,Germany)at-20°C and cut into 12-μm-thick consecutive sections.The 12-μm-thick tumor sections were thaw-mounted on microscope glass slides(Superfrost Plus slides,Thermo Fisher Scientific) and stored at-80°C.Tumor sections were dried in a vacuum desiccator(2 h at-20°C,1 h at room temperature)before AFADESI-MSI analysis.The adjacent slices were used for haematoxylin and eosin (H&E)staining.
2.4.AFADESI-MSI analysis
MSI analysis was performed in positive and negative ion mode on a home-built AFADESI platform consisting of the AFADESI ion source and Q-Orbitrap mass spectrometer (Q-Exactive,Thermo Fisher Scientific).The glass slide was fixed at a 3D translational stage manipulated by a SC100 series stepper motor with 0.25 mm/s moving speed in the x direction and 0.25 mm step size in the y direction.The spray solvent (MeOH:H2O=4:1,V/V) was run at a flow rate of 5 μL/min.Data collection was performed by progressively scanning the tissue surfaces.The spray voltage was 7000 V in positive mode and -7,000 V in negative mode.The spray gas (N2)pressure was 0.7 MPa and the extracting gas flow was 45 L/min.The scan mode was full scan at anm/zrange of 100-1,000.The maximum injection time was 200 ms and the AGC target was 3 ×10⁶.The mass resolution was 70,000,and the capillary temperature was 350°C.
The raw data were converted to a data file in .cdf format using Xcalibur (Thermo Fisher Scientific) and imported into MassImager(Chemmind Technologies,Beijing,China)for image reconstruction and data extraction of regions of interest.A two-dimensional data matrix ofm/zand intensity was obtained in MarkerView(AB SCIEX,Framingham,MA,USA) after peak picking and peak alignment.Multivariate statistical analysis was performed using Simca version 14.1 (Sartorius,Goettingen,Germany).Metabolite annotation was searched against HMDB (http://www.hmdb.ca) and Lipid Maps(https://www.lipidmaps.org/).Metabolic pathway analysis was conducted using Metaboanalyst 5.0 (https://www.metaboanalyst.ca/).Thet-distributed stochastic neighbor embedding (t-SNE)spatial segmentation was performed using MATLAB 2018a (Math-Works,Natick,MA,USA) with self-written code (Supplementary data).
2.5.Cell culture
LLC and A549 (lung cancer) cells were obtained from the Institute of Basic Medical Sciences,CAMS &PUMC (Beijing,China) and incubated in Dulbecco's modified Eagle medium (DMEM) supplemented with 15% fetal bovine serum (FBS;Biological Industries,Kibbutz Beit-Haemek,Israel).EMT6 and C26 cells were received from Prof.Xiaoguang Chen (Institute of Materia Medica,CAMS &PUMC) and incubated in RPMI-1640 medium with 10% FBS.H22 cells were primarily cultured from Prof.Yan Li(Institute of Materia Medica,CAMS&PUMC)and incubated in RPMI-1640 medium with 10%FBS.BEAS-2B cells were procured from BeNa Culture Collection(Xinyang,China) and cultured in DMEM supplemented with 10%FBS.Cell culture medium was purchased from Thermo Fisher Scientific.All cells were maintained in a 37°C humidified incubator with 5% CO2.
2.6.Western blot
Cells (5 × 10⁶) were collected and lysed using radio immunoprecipitation assay (RIPA) buffer.Equal amounts of the protein samples were added to loading buffer,followed by boiling for 15 min.Proteins were subjected to sodium dodecyl sulfate polyacrylamide gel electrophoresis (SDS-PAGE),transferred to polyvinylidene fluoride (PVDF) membranes and blocked with 5%milk for 30 min.The membranes were incubated with diluted primary antibodies at 4°C overnight and then washed with TBST three times.Second antibodies (anti-rabbit/mouse IgG-HRP(1:5000)) were incubated at room temperature for 1 h.After washing with TBST three times,the membranes were visualized with enterochromaffin-like(ECL)assay.Antibodies were purchased from Invitrogen(Thermo Fisher Scientific):choline transporter-like protein 1 (CTL1,PA5-90449),carboxylesterase (CES,PA5-109518);and Proteintech (Wuhan,China): organic cation transporter 1(OCT1,24617-1-AP),OCT2(13594-1-AP).Other regents for western blotting were obtained from Servicebio (Wuhan,China).
2.7.Cell viability assay
The transportation mechanism study involved seeding LLC,A549,and BEAS-2B cells in 96-well plates at 2,500-7,000 cells/100 μL/well.On the next day,serum-free medium containing different PTX-R concentrations with HC-3 or a mixture of three inhibitors or without inhibitors was added at 100 μL per well (final dimethyl sulfoxide (DMSO) concentration <0.4%).Cells were incubated at 37°C and 5%CO2for 24 h,followed by the addition of commercially available cell viability assay reagents (CellTiter 96 AQueous One Solution cell proliferation assay,Promega,Madison,WI,USA;Cell Counting Kit-8,MedChemExpress,Shanghai,China) to determine cell activity.Six dose groups were used for PTX-R.
2.8.PTX-R uptake assay
There were three inhibitor groups (4.5 μmol/L PTX-R with 100 μmol/L HC-3 or 60 μmol/L quinidine or 60 μmol/L cimetidine)and the corresponding control group (4.5 μmol/L PTX-R).LLC cells(2 × 10⁵cells/mL) were seeded in 6-well plates at 2.5 mL/well,incubated for 48 h,washed with PBS buffer and pre-incubated with inhibitor or PBS buffer for 20 min.PTX-R alone or with corresponding inhibitor were added,followed by incubation for a further 10 min.PTX-R uptake was terminated by washing the cells three times with cold PBS buffer.Cold MeOH(1.5 mL)containing 100 ng/mL DTX and 0.1% FA was added to the cells and the mixture was incubated for 30 min.The cells were scraped off and transferred to eppendorf tubes together with the solution.The solutions were vortexed at 2,500 rpm for 10 min and centrifuged at 14,000 rpm,4°C for 10 min,and the supernatant (1.2 mL) was evaporated to dryness using N2and reconstituted with 600 μL of solvent(ACN:H2O=1:9,V/V).The concentrated solution was vortexed at 2,500 rpm for 10 min and centrifuged at 17,968g,4°C for 10 min.Finally,the supernatant was analyzed by liquid chromatography tandem-mass spectrometry (LC-MS/MS).
2.9.Pharmacokinetic analysis
Healthy SD rats were IV injected with PTX-R(6 mg/kg)and PTX(5 mg/kg),respectively (6 mice per group).Blood samples were collected at 0,5 min,15 min,30 min,1 h,2 h,4 h,8 h,and 24 h after administration.Plasma was obtained by centrifuging the blood at 1500g,4°C for 10 min,and the supernatant stored at -80°C.Plasma(100 μL)was added to 5 μL of DTX(1 mg/mL)and 300 μL of cold MeOH containing 0.1% FA.The mixture was vortexed at 2500 rpm for 3 min and centrifuged at 17,968g,4°C for 5 min.The supernatant (300 μL) was evaporated to dryness using N2and reconstituted using 150 μL of solvent (ACN:H2O=1:9,V/V).The concentrated solution was vortexed at 2500 rpm for 3 min and centrifuged at 17,968g,4°C for 5 min.Finally,the supernatant was analyzed by LC-MS/MS.
2.10.LC-MS/MS analysis
PTX-R and PTX were detected using a ultra-performance liquid chromatography (UPLC) system (ACQUITY UPLC I-Class,Waters,Milford,MA,USA) coupled to a Q-LIT mass spectrometer(QTrap5500,AB SCIEX).Chromatographic separation was conducted on a Welch Ultimate AQ-C18 column (3.0 mm × 50 mm,3 μm;Shanghai,China).The mobile phase consisted of water with 0.1% FA and 1 mmol/L ammonium formate (A) and ACN (B).The following gradient conditions were applied: 0 min,30% B;0-0.5 min,50% B;0.5-1.0 min,60% B;1.0-2.0 min,95% B;2.0-3.5 min,95%B;3.5-3.51 min,30%B.The flow rate was 0.4 mL/min and the injection volume was 5 μL.The mass spectrometry parameters were as follows: scan mode,multiple reaction monitoring(MRM)in positive ion mode;spray voltage,5500 V;gas1,65 psi;gas2,60 psi;curtain gas,30 psi;source temperature,550°C.The monitoring ion pairs werem/z983.4 →415.2 for PTX-R;m/z854.4 →286.1 for PTX;andm/z808.3 →527.2 for DTX (IS).Quantitative data were analyzed using Analyst software V1.5.1(AB SCIEX) and Watson LIMS version 7.5 (Thermo Fisher Scientific).
2.11.PTX-R activation assay
After carboxylesterase inhibitor (BNPP) or cholinesterase inhibitors(huperzine A and neostigmine bromide)incubated with rat plasma (90 μL) for 5 min at 37°C,PTX-R was added to the mixed plasma(100 ng/mL).Plasma was collected after incubation at 37°C for 5 min,15 min,30 min,1 h,2 h,4 h,and 8 h.The sample preparation and concentration detection were the same as pharmacokinetic analysis.
Tumor tissue homogenate was prepared with PBS (1 g/3 mL).After the pH value of tumor tissue homogenate adjusted to 7.4 and 5.5,PTX-R was added to the tissue homogenate (500 ng/mL).Homogenate was collected after incubation at 37°C for 5 min,15 min,30 min,1 h,2 h,4 h,and 8 h.The sample preparation and concentration detection were the same as pharmacokinetic analysis.
2.12.Statistical analysis
Statistical analysis was performed using GraphPad Prism software version 8.0 (GraphPad Software,San Diego,CA,USA) and Originpro 2021 (OriginLab,Northampton,MA,USA).Data are expressed as the mean ± standard deviation (SD).Unpaired twosided Student'sttests were used to compare statistical significance between two groups.One-way or two-way analysis of variance tests with Tukey's correction were used to compare the statistical significance between multiple groups.Survival differences were evaluated using the Kaplan-Meier survival analysis.Statistical significance was set as*P< 0.05,**P< 0.01,and***P<0.001.
3.Results
3.1.Precisely profiling tumor metabolism by spatially resolved metabolomics
Heterogeneous tumor tissue is typically comprised of cancer cells,lymphocytes,stromal cells,and other normal cells [32].The complex composition of tumor microenvironment contributes to metabolic heterogeneity in different tumors,even in different areas of one tumor tissue[15].Spatially resolved metabolomic analysis of LLC,EMT6,C26,and H22 cancer tissues was conducted via AFADESI-MSI to accurately explore the tumor metabolic features and identify metabolic vulnerability.
Fig.2A shows representative heterogeneous tumor tissue with four microregions: tumor parenchyma area,tumor necrosis area,muscle area,and collagen area according to the H&E stained image.Microregional metabolic profiles covering numerous endogenous metabolites and their position information were acquired using AFADESI-MSI analysis[29,30].The spatially resolved metabolic data of the tissue microregions was separated into four metabolic phenotypes followingt-SNE space mapping cluster analysis,which corresponded to the histological heterogeneity(Fig.2B).Metabolic profiles of distinct microregions were precisely extracted from the heterogeneous tissue section by overlaying the MS image,H&E stained image,andt-SNE clusters[28].Comparing the extracted MS profiles of microregions,notable differences in variety and abundance of metabolites were displayed(Fig.2C).Moreover,significant differences on tissue distribution of specific metabolites between cancerous and paracancerous areas in four cancers were intuitively presented as ion images(Fig.2D).
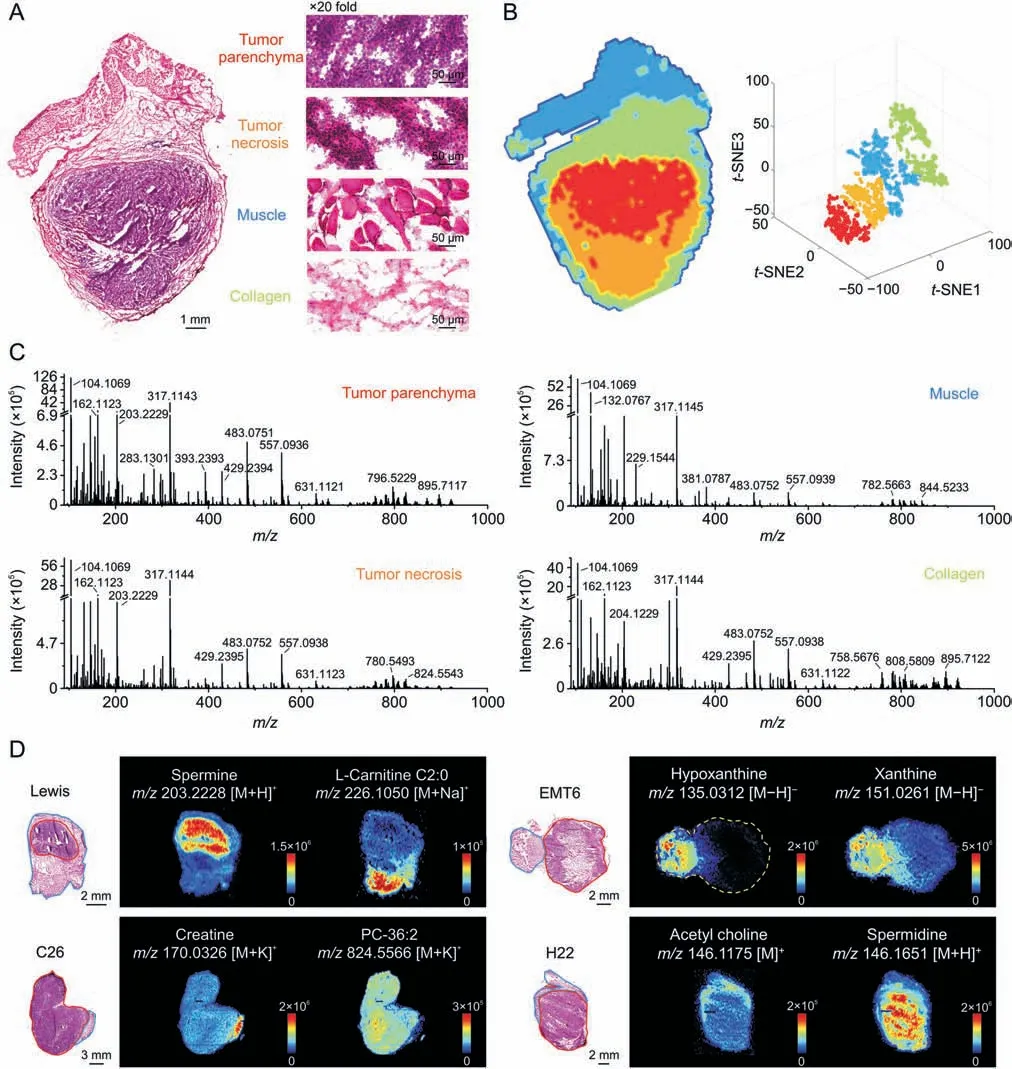
Fig.2.Heterogeneity of tumor histomorphology and tumor metabolic phenotype.(A)Haematoxylin and eosin(H&E)stained image of Lewis lung cancer.(B)Left:Image of tumor tissue spatial segmentation through automatic pixel labeling using t-distributed stochastic neighbor embedding (t-SNE).Right: t-SNE 3D plot visualizing the distribution of four clusters.(C)Mass spectra of the four microregions in Fig.2A.(D)Mass spectrometry images of representive metabolites in four types of cancers.The area drawn by the red and blue line refers to the cancerous area and paracancerous area,respectively;TCA: tricarboxylic acid;CHK: choline kinase.
3.2.Discovering up-regulated choline metabolism in diverse tumors
Based on the guidance of H&E stained images andt-SNE clusters,metabolomics information in cancerous(tumor parenchymal)and paracancerous(adjacent normal)areas were precisely obtained from the four types of tumor tissues through AFADESI-MSI analysis.Next,a circuit for data processing and analysis was implemented.Pairwise multivariate statistical analysis was performed after precise data extraction,peak picking,and peak alignment.The orthogonal partial least squares discriminant analysis model(Fig.S1)verified distinct metabolic profiles between the cancerous and paracancerous areas,and significantly altered metabolites between these two areas(VIP >1.5,P<0.05)were screened.Pathway analysis based on these metabolites revealed that four metabolic pathways were significantly enriched (Fig.3A),with glycerophospholipid metabolism as the most notably altered metabolic pathway in lung cancer.
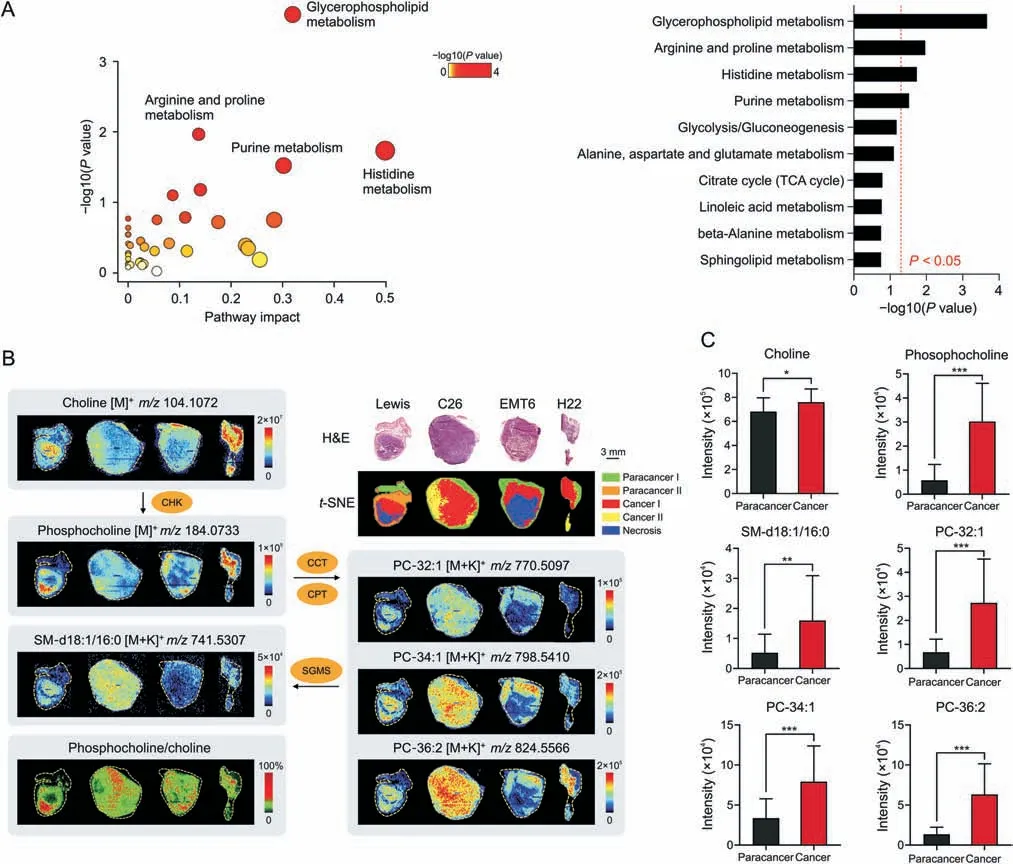
Fig.3.Widely up-regulated choline metabolism in diverse tumors.(A)Metabolic pathway analysis results of lung cancer.Left:Pathway enrichment analysis of significantly altered metabolites.Right:P-value ranking of metabolic pathways.Values on the right side of the red line indicates P <0.05.(B)Haematoxylin and eosin(H&E)stained images,ion intensity ratio-images and mass spectrometry images of choline and its metabolites in different tumor tissues and microregions.(C)Intensity of choline and its metabolites in paracancerous and cancerous areas of lung cancer(n=8).Mean±standard deviation (SD),*P <0.05,**P <0.01,***P <0.001.PC:phosphatidylcholine;SM:sphingomyelin;CCT:phosphocholine cytidylyltransferase;CPT: cytidyltransferase cholinephosphotransferase;SGMS: sphingomyelin synthase;TCA: tricarboxylic acid;CHK: choline kinase.
We further focused on glycerophospholipid metabolism in different cancer types.Several phosphatidylcholine (PC) and sphingomyelin (SM) molecules including PC-32:1,PC-34:1,PC-36:2,and SM-d18:1/16:0 were elevated in cancerous areas(Figs.3B,3C,and S2).Phosphocholine(PCho),the precursor to PC,was also obviously upregulated in cancers,while the raw material of PC (choline) was significantly decreased in three cancers but increased in lung cancer (Figs.3B,3C,and S2).Choline kinase(CHK)is the key rate-limiting enzyme in PCde novosynthesis and catalyzes the transformation of choline to PCho [33].Each pixel intensity ratio of PCho to choline was calculated to construct ion intensity ratio images.The ion intensity ratio of cancerous areas was higher than that of paracancerous areas (Fig.3B),suggesting that CHK activity may be upregulated in tumors [29,34].These results demonstrated that choline metabolism was widely upregulated for PC synthesis in various tumors.
3.3.Validating enhanced tumor choline uptake
Choline metabolism is upregulated to synthesize enough PC for the malignant proliferation of tumor cells since PC is an essential component of the cell membrane [35].Increased choline and PC were confirmed in clinical tumor tissues of lung cancer patients through AFADESI-MSI (Fig.4A).Tumor cells take up choline from their environment,which is the rate-limiting step of choline metabolism [36].Enhanced tumor choline uptake was further validated in isotope tracing experiments.Deuterated choline was administered to LLC mice,and tumor tissues were collected at 30 min,4 h,10 h,and 24 h after injection.The distribution of D9-choline in tumor tissues was imaged using AFADESI-MSI (Figs.4B and S3),and the intensity ratio of cancerous areas to paracancerous areas was calculated(Fig.4C).D9-choline was initially distributed in paracancerous areas;however,it was enriched in cancerous areas 4 h after injection.This illustrates that tumor cells actively import more choline.
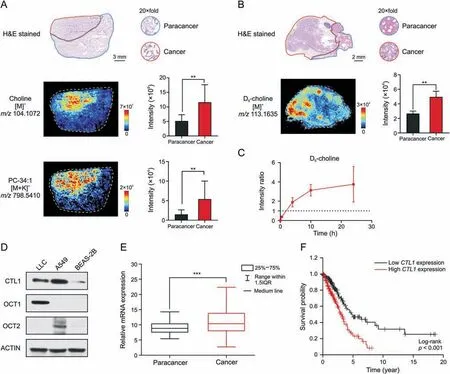
Fig.4.Enhanced tumor choline uptake through choline transporters.(A)Haematoxylin and eosin(H&E)stained image and mass spectrometry images of clinical lung cancer tissue.Histograms displayed the intensity of corresponding metabolites in paracancerous and cancerous areas (n=4 patients).The area drawn by the red and blue line refers to the cancerous area and paracancerous area,respectively.(B)H&E stained image and D9-choline ion image of lung cancer tissue at 4 h after dosing D9-choline to Lewis lung cancer(LLC)mouse.Histograms displayed the intensity of D9-choline in paracancerous and cancerous areas(n=3 mice).The area drawn by the red and blue line refers to the cancerous area and paracancerous area,respectively.(C) Intensity ratio of D9-choline of cancerous to paracancerous areas over time (n=3 mice).(D) Western blot analysis of choline transportation related protein expression in different cell lines.(E)Relative mRNA expression of choline transporter-like protein 1(CTL1)in cancerous(n=535 patients)and paracancerous tissues(n=59 patients) of lung cancer patients.(F) Kaplan-Meier survival analysis comparing the overall survival in lung cancer patients with low CTL1 expression (n=227 patients)versus those with high CTL1 expression (n=267 patients).Gene expression and survival time data from the Cancer Genome Atlas.Mean ± standard deviation (SD),**P <0.01,***P <0.001.PC: phosphatidylcholine.OCT1/2: organic cation transporter 1/2.
Choline is an organic cation requiring transporters for cellular uptake[37].Choline transporters including CTL1 and OCT1-2 were highly expressed in LLC or A549 cells compared to normal human lung epithelial cells BEAS-2B (Fig.4D).CTL1mRNA expression(Fig.4E) was higher in cancerous tissues compared with paracancerous tissues of a cohort of lung cancer patients from the Cancer Genome Atlas.Survival analysis in this cohort showed that highCTL1expression was an unfavorable prognostic marker of lung cancer (Fig.4F).Therefore,choline transportation could serve as a metabolic vulnerability for targeted therapy in lung cancer or other cancers overexpressing choline transporters.
3.4.Design and evaluation of SMDCs targeting choline metabolism
Taking the advantage of the potential active targeting of choline,choline or its analog (betaine) was used as small molecular targeting ligands to conjugate PTX or DTX as tumor-targeting SMDCs to improve taxane safety and efficacy in clinical therapy.Four choline-or betaine-conjugated taxanes were designed,synthesized(Fig.S4),and evaluated to test the SMDC design strategy for cancer therapy.
The best candidate compound was determined by evaluating antitumor activity of different taxane derivatives and positive drugs(PTX or DTX) in LLC mouse models.Carbonate-linked cholineconjugated PTX (PTX-R) and succinate-linked choline-conjugated PTX (PTX-SA-R) significantly inhibited tumor growth,and their inhibition rate at a 1.5-fold equimolar dose of PTX was nearly equal to that of PTX(Fig.5A and Table S1).The weight of the mice in the PTX and PTX-SA-R groups significantly decreased,whereas PTX-R significantly alleviated weight loss associated with PTX (Fig.5B).Moreover,the therapeutic efficacy of betaine derivatives,compound C(PTX-B)and compound D(DTX-B),was significantly lower than that of prototype drugs (Fig.5C and Table S2).These results showed that choline modification preserved the activity of cytotoxic molecules and PTX-R was the best candidate for targeted cancer therapy.
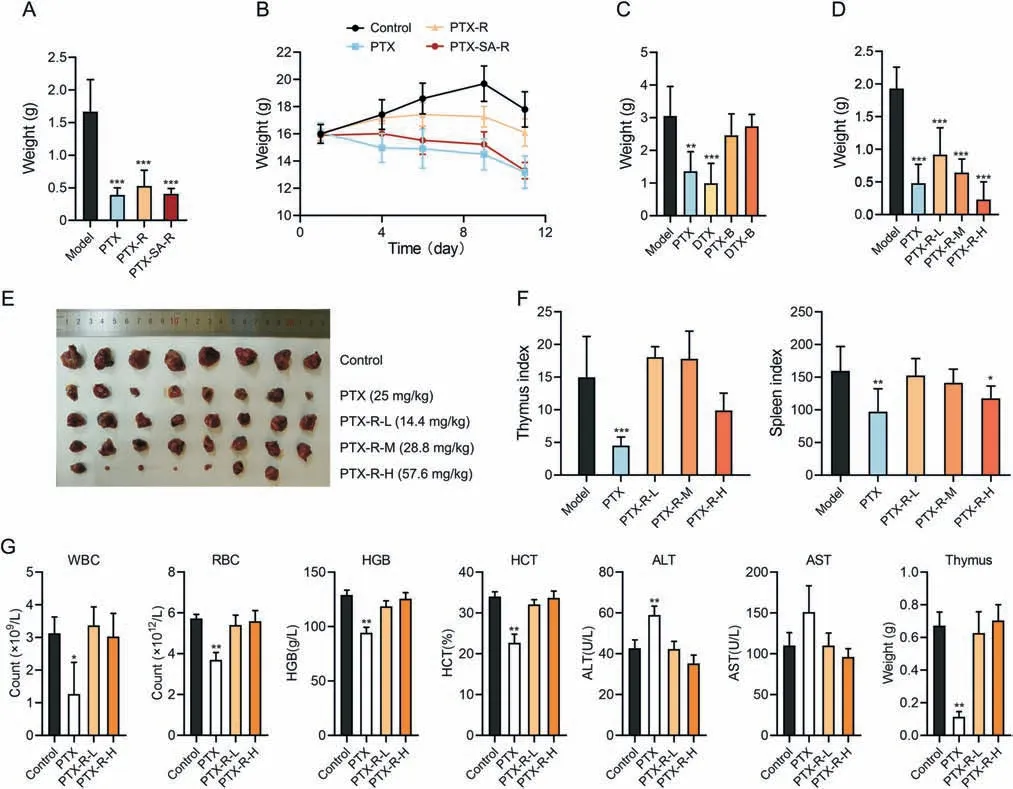
Fig.5.Antitumor activity and toxicity of taxane derivatives.(A) Tumor weight of Lewis lung cancer (LLC) mice following treatment with paclitaxel (PTX,25 mg/kg),carbonatelinked choline-conjugated PTX (PTX-R) (43.2 mg/kg) or succinate-linked choline-conjugated PTX (PTX-SA-R) (45.8 mg/kg) for 11 day (n=7 to 8).(B) Body weight changes of LLC mice administered with PTX (25 mg/kg),PTX-R (43.2 mg/kg) or PTX-SA-R (45.8 mg/kg) over time (n=7 to 8).(C) Tumor weight of LLC mice following treatment with PTX(25 mg/kg),DTX(25 mg/kg),PTX-B(29 mg/kg)or DTX-B(23.7 mg/kg)for 11 day(n=7).(D-F)Tumor weight(D),tumors(E),and thymus and spleen index(F)of LLC mice following treatment with PTX(25 mg/kg)or PTX-R(L:14.4 mg/kg;M:28.8 mg/kg;H:57.6 mg/kg)for 11 day(n=8).(G)Indicators of rats following treatment with PTX(5 mg/kg)or PTX-R(L:6 mg/kg;H:12 mg/kg)for 13 day(n=3).Mean±standard deviation(SD),*P <0.05,**P <0.01,***P <0.001.WBC:white blood cells;RBC:red blood cells;HGB:hemoglobin;HCT:hematocrit;ALT: alanine aminotransferase;AST: aspartate aminotransferase.
The anti-tumor activity and toxicity of PTX-R was furtherly accessed in LLC mouse model.The treatment effect of PTX-R was observed in a dose-dependent manner (Figs.5D and E,and Table S3),with optimal inhibition rate (88.09%) at 57.6 mg/kg (2-fold equimolar dose of PTX) which surpassed PTX activity.In addition,the indices of the spleen and thymus were notably reduced in the PTX group,while those in the PTX-R group were similar to the control group (Fig.5F),indicating that PTX-R significantly reduced the severe side effects of PTX on immune system damage.
Next,two-week repeat dose toxicity study was implemented on normal rats.PTX exposure reduced the number of white blood cells and red blood cells,decreased hemoglobin levels,hematocrit levels,and thymus weight,and increased the amount of alanine aminotransferase compared to vehicle exposure (Fig.5G).Thus,PTX had obvious toxicity effects including bone marrow suppression,anemia,immunosuppressive effects,and liver damage,which is consistent with common clinical side effects[38].In contrast,PTX-R showed no obvious toxicity at low or high doses (Fig.5G).Therefore,PTX-R retained the antitumor effect of PTX,significantly reduced its toxicity,and especially protect immune system from damage.
3.5.Validating the targeting mechanism of choline conjugated SMDC in tumors
Further in vitro experiments were performed to understand the changes in the drug behavior caused by choline modification and to explore the targeting mechanism.The water solubility of PTX-R was measured as 3.66 mg/mL (Fig.6A),which is more than 1,000 times higher than that of PTX and is attributed to the high polarity of the choline quaternary ammonium cation.Pharmacokinetic studies of PTX-R and PTX conducted in healthy rats showed that the maximum plasma concentration (Cmax) and area under the plasma concentration-time curve (AUC0→24h) of PTX-R was much higher than that of PTX,but the exposure of the active metabolite(PTX)in PTX-R-treated rats was obviously less than that in rats treated with equimolar dose of PTX (Figs.6B and C,and Table S4).Cmaxand AUC0→24hof PTX in PTX group were over three times higher than that in PTX-R group(Fig.6D and Table S4).These results interpreted that PTX-R had lower toxicity than PTX in the whole body.In addition,the great increase in the volume of distribution of PTX in PTX-R group suggests that PTX-R may have specific tissue distribution(Table S4),which was evaluated in our previous reports[39].In our previous reports,the tissue distribution of PTX-R and PTX in tumorbearing mice was quantitated using virtual calibration quantitative MSI method.The spatial-temporal distribution of PTX (Fig.S5)showed that the content of PTX released from PTX-R in normal organs was extremely lower than that in PTX-injection and PTXliposome group,which was consistent with the low systematic toxicity of PTX-R (Fig.5).The relative targeting efficiency of PTX-R was calculated 50-fold higher than that of PTX-liposome [39].Moreover,the distribution of PTX-R was similar to that of its metabolite (PTX) and choline-pathway metabolites in tumors(Fig.S6A),and PTX-R was positively correlated with the intensities of these metabolites(Figs.S6B and C).Especially,the correlation of PTXR with choline was strong,verifying that the tumor targeting ability of PTX-R was related to choline.In a word,the altered biodistribution confirmed the tumor-targeting ability and low systematic toxicity of PTX-R,representing a promising targeted cancer candidate.
The PTX-R tumor-targeting mechanism related to choline transportation was further investigated in vitro using three known transporter inhibitors including CTL1 inhibitor (HC-3),OCT1 inhibitor(quinidine),and OCT2 inhibitor(cimetidine).Each inhibitor decreased PTX-R intake with no influence on PTX transport(Figs.6E and F),indicating that the choline modification altered the transport mechanism of PTX,and CTL1,OCT1,and OCT2 were all involved in PTX-R uptake in LLC cells.CTL1 function in PTX-R transport was further validated by comparing PTX-R cytotoxicity with or without HC-3 for 24 h in LLC,A549,and BEAS-2B cells.HC-3 inhibited PTX-R entry into cells through CTL1 and reduced PTX-R cytotoxicity (Figs.6G-I).Moreover,the inhibitory effect of HC-3,quinidine,and cimetidine together was greater than that of HC-3 alone at high PTXR concentration (Figs.6G-I).In addition,individually treating cells with inhibitors at corresponding concentrations didn't affect cell viability,eliminating the impact of inhibitor itself(Figs.S7 and S8).
Next,prodrug activation mechanism was further investigated under in vitro biological conditions.Generally,ester prodrug activation is catalyzed by esterase.CES is one of the major hydrolases of many clinical-used ester drugs[40].CES expression was detected in the three lung cell lines that are highly sensitive to PTX-R(Fig.S9).BNPP,a specific inhibitor of CES,was used to investigate whether CES is a significant enzyme catalyzing the biotransformation of PTX-R into PTX in plasma or tumor tissue.After incubation with BNPP at 37°C,the transformation of PTX-R to PTX was apparently suppressed,indicating that CES is involved in PTX-R activation in plasma and tissues(Figs.6J,6K,and S10).The metabolic rate sort of PTX-R in the major organs involved in drug metabolism was tumor necrosis >tumor >liver(Fig.6L).These results suggest that tumors may express more CES than the liver or other normal organs which is consistent with the PTX-R biodistribution in vivo[39].Moreover,in order to study whether the acidic tumor microenvironment will lead to prematurely activation of PTX-R,an in vitro experiment was conducted to compare the PTX-R release under the neutral condition (pH=7.4) and weakly acidic condition (pH=5.5).The concentration changes of PTX-R and PTX over time (Fig.S11) showed that PTX-R released more slowly under weakly acidic condition than under neutral condition,which may be because its carbonate bond is more stable under weak acidic conditions.This will be beneficial for more PTX-R to enter tumor cells and release PTX under the enzyme hydrolysis of CES to play its role.In addition,the transformation role of cholinesterase was excluded (Fig.S12).Together,these findings indicate that PTX-R efficacy is dependent on three transporters and CES,providing possible predictive biomarkers for tumor precise treatment.
4.Discussion
Targeting tumor metabolic vulnerability is an attractive strategy for anticancer therapy [41].In our study,choline metabolism was significantly up-regulated in tumors which was discovered by spatially resolved metabolomics from the heterogenous tumor tissues(Figs.3B,3C,and S2).PCho and several PC were all elevated in four types of cancerous areas.Interestingly,choline was significantly increased in lung cancer,but decreased in liver cancer,colon cancer and breast cancer (Figs.3B,3C,and S2).Enhanced tumor choline uptake was also validated in isotope tracing experiments.These results suggest that a large amount of choline is used for PC synthesis in tumor cells.Therefore,the decrease of choline in three cancers may result from that the amount of choline used for PC synthesis exceeded the uptake of choline,and the level of total choline-containing compounds,not only choline level,may indicate the efficacy of choline-modified SMDC.Another phenomenon is that several metabolites in choline metabolism,such as choline and PCho,were found to be non-uniform distributed in cancerous microregions (Fig.3B).Choline was higher in cancer II area than cancer I area of the C26 colon cancer tissue,which was consistent with spatial partition of thet-SNE.While the two cancer areas had similar pathological feature.The results illustrated the high metabolic heterogeneity of tumor tissues and showed the significance of the spatially resolved metabolomics in accurately characterizing the metabolic signature of tumor tissues.The molecular information may guide tumor precision diagnosis and treatment [42,43].
Multiple carcinogenic signaling pathways and transcription factors associated with oncogenesis activate choline metabolism by affecting enzymes in choline metabolism [44,45].Crucial metabolic enzymes and transporters such as CHK and CTL1 are potential targets to inhibit choline metabolism for cancer therapy [46,47].However,metabolic inhibitors can easily induce adaptive metabolic resistance[9].According to the metabolic preference of tumor cells for importing and utilizing choline as a biosynthetic source,we proposed a choline-modified strategy of SMDC design to entice tumor cells to indiscriminately take in choline-modified cytotoxic agents and then kill tumor cells.Importantly,we took advantage of the indispensable uptake function of highly expressed metabolic transporters in tumors,rather than directly blocking choline metabolismrelated protein to inhibit tumor growth.Therefore,drug resistance may be avoided because it is less prone to metabolic adaptation.
As a proof-of-concept,PTX-R is a choline-conjugated prodrug of PTX with greater tumor targeting efficiency and lower distribution in non-target regions [39],leading to excellent anti-tumor activity and low toxicity in lung cancer (Fig.5).PTX-R is transported into tumor cells by CTL1 and OCT1-2 which is similar to choline transport,but different from PTX(Figs.6E-I)[48].CTL1 is the main choline transporter for PC synthesis and overexpressed in various tumor types such as colon cancer,lung adenocarcinoma and breast cancer [49,50].The CTL1 inhibitor decreased the uptake and antitumor activity of PTX-R in lung cell lines,which highlighted the role of CTL1 in PTX-R-targeted transportation (Figs.6E-I).Thus,PTX-R may improve poor prognosis of lung cancer patients with high CTL1 levels.OCT1-2 non-specifically recognize choline with low affinity[51].We confirmed the participation of OCT1-2 in PTXR transport with OCT1-2 inhibitors(Fig.6E).Therefore,PTX-R will have better selectivity for tumors with high expression or activity of OCT1 and OCT2.In general,the targeting effect of the choline ligand changed the uptake pathway,improved the tumor targeting efficiency,and reduced PTX cytotoxicity.These transporter proteins responsible for PTX-R uptake may be patient stratification markers for the clinical application of PTX-R in precision medicine.In addition,PTX-R can be selectively absorbed by tumor cells through multiple transporters which may reduce the occurrence of drug resistance.
The transformation from PTX-R to PTX is important for the pharmaceutical effect of PTX-R.We demonstrated that PTX-R was activated to PTX by CES(Figs.6J and K).CES (major subtypes CES1 and CES2) is a significant class of phase I drug-metabolizing enzymes [40].CES1 inclines to metabolize esters containing small alcohol groups and large acyl groups,such as oseltamivir,enalapril and clopidogrel,whereas CES2 preferentially hydrolyzes esters containing large alcohol groups and small acyl groups,including antitumor prodrugs irinotecan and capecitabine [52].Thus,we speculated that PTX-R was hydrolyzed by CES2 according to its chemical structure.CES2 exists in different tumor types and is highly expressed in liver cancer and thyroid cancer [53].Its expression is associated with the treatment response to anti-tumor prodrugs converted mainly via CES2 [54].Therefore,CES2 expression may serve as a biomarker for patient stratification with PTX-R precise treatment.Although we identified the transporters and activating enzymes involved in PTX-R transportation and activation,further research will be necessary to determine the relative contribution of these proteins to tumor targeting of PTX-R in lung cancer or other cancers for its clinical application.
SMDCs have more efficient penetration into solid tumors,better stability,non-immunogenic nature and much more manageable synthesis owing to their small size compared with antibody-drug conjugates [55] and are thought to be an alternative to antibodydrug conjugates [56].The metabolic vulnerability-driven SMDC design strategy is a new approach to develop more effective and selective targeted tumor metabolism drugs.It significantly reduces systemic exposure and cytotoxicity of chemotherapeutic drugs to normal cells.With the development of immunotherapy,the combination of chemotherapy with immunotherapy has become a superior alternative to chemotherapy as the frontline therapy[57].Therefore,PTX-R in combination with immunotherapy may have significant efficacy,improve the tolerance and compliance of patients,and provide better clinical benefit in the future,as the modification with choline reduced PTX toxicity without damaging the immune system.
5.Conclusions
In summary,a novel SMDC design strategy was developed to utilize metabolic vulnerability for precise cancer chemotherapy.The enhanced choline uptake-associated metabolic vulnerability was discovered through the spatially resolved metabolomics analysis in multiple heterogeneous cancers.The utilization of choline as a targeting ligand altered PTX transportation and activation,and showed high tumor-inhibiting efficiency and low toxicity to normal tissues,increasing the potential of PTX for cancer precision therapy.Both the SMDC related transport proteins and carboxylesterases may be the patient stratification markers of PTXR in future clinical use for the precise treatment of cancer.Discovering metabolic vulnerability through spatially resolved metabolomics provides a new strategy for SMDC development and the SMDC design strategy facilitates acquiring targeted cancer drugs with greater therapeutic advantages.
CRediT author statement
Xiangyi WangandJin Zhang:Methodology,Investigation,Formal analysis,Visualization,Writing-Original draft preparation;Kailu ZhengandQianqian Du:Investigation,Formal analysis,Visualization;Guocai Wang:Investigation,Validation;Jianpeng Huang:Project administration,Resources,Data curation;Yanhe Zhou:Investigation,Validation;Yan Li:Conceptualization,Methodology,Supervision,Writing -Reviewing and Editing;Hongtao Jin:Project administration,Resources,Data curation;Jiuming He:Conceptualization,Methodology,Supervision,Writing-Reviewing and Editing,Funding acquisition.
Declaration of competing interest
Jiuming He,Yan Li,Jin Zhang,Qianqian Du and Hongtao Jin are inventors of an awarded patent application (201910162557.8)submitted by Institute of Materia Medica,Chinese Academy of Medical Sciences that related to choline-or betaine-modified taxanes.All other authors declare that they have no conflicts of interest.
Acknowledgments
We thank Peking Union Medical College Hospital for providing clinical lung cancer tissue samples after surgery.We also would like to thank Beijing Union-Genius Pharmaceutical Technology Development Co.,Ltd.for performing toxicity experiment and BioDuro Shanghai Co.,Ltd.for synthesis of modified taxane compounds.This work was supported by the National Natural Science Foundation of China (Grant Nos.: 81974500 and 81773678),and the CAMS Innovation Fund for Medical Sciences (Grant No.: 2022-I2M-2-001).
Appendix A.Supplementary data
Supplementary data to this article can be found online at https://doi.org/10.1016/j.jpha.2023.02.010.
 Journal of Pharmaceutical Analysis2023年7期
- Journal of Pharmaceutical Analysis的其它文章
- Single-cell RNA-sequencing and subcellular spatial transcriptomics facilitate the translation of liver microphysiological systems for regulatory application
- Dissecting the brain with spatially resolved multi-omics
- New discoveries in the field of metabolism by applying single-cell and spatial omics
- Single-cell analyses reveal cannabidiol rewires tumor microenvironment via inhibiting alternative activation of macrophage and synergizes with anti-PD-1 in colon cancer
- Cux1+ proliferative basal cells promote epidermal hyperplasia in chronic dry skin disease identified by single-cell RNA transcriptomics
- Single-cell analysis of cellular heterogeneity and interactions in the ischemia-reperfusion injured mouse intestine