
High-precision double-spike Cd isotopic measurements of seawater by MC-ICP-MS and its application to seawater affected by hydrothermal vent fluids
2023-10-13 01:17ChuanweiZhuYunzhuWuHanjieWenGuanghaiWuWenruiSongYuxuZhangBoZhao
Acta Geochimica 2023年5期
Chuanwei Zhu • Yunzhu Wu,2 • Hanjie Wen • Guanghai Wu •Wenrui Song,2 • Yuxu Zhang • Bo Zhao
Abstract Cadmium (Cd) isotopes in seawater have been proven as an important geochemical tool for tracing ocean Cd circulation in the modern ocean.In this study,we evaluated a new method to separate Cd (~60 ng) from seawater using Chelex resin (1.0 g) coupled with AG-MP-1M resin.The results show that the Chelex resin is sufficient to remove Cd from Na and Mg matrix with Cd recoveries at 98.3 ± 3.5 % (2SD,N=6);while AG-MP-1M resin could separate Cd from the residual Na,Mg,and isobaric inferences.The total Cd recoveries of the method are 96.3 ± 1.5 % (2SD;N=4) and the salinity of the samples has no significant impacts on Cd recovery.Cd isotope ratios were measured using a Nu Plasma III MCICP-MS and 111Cd–110Cd double spike technique.By comparing the δ114/110Cd values (0.00 ± 0.06‰) of synthetic seawaters doped with Cd isotope standard(NIST-3108;treated by Chelex+AG-MP-1M resin) and the reference value (~0.00 ‰),no variations were observed.We also analyzed the Cd isotope compositions of three deep seawaters from a column at the Southwest Indian Ocean Ridges (SWIR).The δ114/110Cd values of the column are decreased from 1.05 ± 0.05 ‰ at 3200 m to 0.36 ± 0.05 ‰ at 2800 m,differing from reported δ114/110Cd values of deep seawater in other oceans.Considering the spatial distance between the column and active hydrothermal vents in SWIR (~13 km),we propose that such positive δ114/110Cd values of deep seawater were likely contaminated by vent fluids,which could provide heavy Cd isotope to deep seawaters.This study demonstrates that Cd isotope is more sufficient to distinguish the impact of plumes on deep seawater.
Keywords Cd isotope ∙Seawater ∙Plume ∙Hydrothermal system
1 Introduction
In the modern ocean,cadmium (Cd) is spatially correlated to that of phosphate (Boyle et al.1976;Bruland et al.1978),which was controlled by phytoplankton acquisition in surface seawaters and remineralization at depth (Ruttenberg 2003).Although Cd shows high toxicity to organisms in terrestrial environments,Cd is a micronutrient for marine organisms at lower Cd concentrations and could be a catalytic metal in Zn-carbonic-anhydrase through substitution for Zn that plays a critical role during acquisition by phytoplankton (Lee and Morel 1995).These processes remove Cd from the surface water,resulting in lighter Cd isotopes preferred to take up by phytoplankton at the surface ocean with different fractionation factors(Lacan et al.2006;Ripperger et al.2007).With recent studies on Cd isotope distributions in different oceanic columns,Cd isotope compositions (usually expressed as δ114/110Cd) of seawater are varied at surface oceans,ranging from -0.9‰ to 3.8‰ (Ripperger et al.2007;Yang et al.2015);however,deep seawaters have limited δ114/110Cd variations ranging from around 0.2‰ in the North Pacific to 0.3–0.5‰ in the North Atlantic (Janssen et al.2017;Sieber et al.2019).These studies demonstrated that Cd isotopes have been revealed as a sufficient geochemical tool for tracing surface ocean circulation regimes(e.g.,Gault-Ringold et al.2012;Abouchami et al.2014;Conway and John 2015;Xie et al.2017;Zhang et al.2019;Sieber et al.2022).
Global oceanic Cd mass balance is affected by source and sink fluxes of Cd,and dust,river,and hydrothermal inputs of Cd are the critical Cd sources to the ocean;in contrast,sediments,pelagic clays,Fe-Mn nodules,and crust are the predominant output fluxes(Bryan et al.2021).The estimated total input Cd fluxes of rivers,dust,and hydrothermal Cd are 4~15,2~11,and 2~26 × 106mol yr-1,respectively(Horner et al.2011;Bryan et al.2021).Different Cd sources show varied Cd isotope signatures: Bridgestock et al.(2017) measured Cd isotope compositions of atmospheric aerosols from the Atlantic Ocean with δ114/110Cd values varying from-0.19‰ to 0.19‰;river waters display significant regional variability with δ114/110Cd values varying from 0.2 ± 0.1‰from the Siberian rivers to-0.38‰from the Kalix River (Lambelet et al.2013).These studies show significant Cd isotope variations of different inputs of Cd,which could result in Cd isotope variations in seawaters(Lambelet et al.2013;Bridgestock et al.2017).However,as an important input of Cd,hydrothermal Cd has not yet been well constrained,limiting the application of Cd isotope and understanding of Cd cycling in deep oceans.
Cd is a trace element in modern seawater with Cd concentrations typically below 100 ng/L,and precise and accurate measurements of Cd and its isotope composition are crucial to expanding the application of Cd isotope in such systems.In this study,we develop a method to obtain high-precision Cd isotopic data of seawater using110Cd–111Cd double spike coupled with Nu Plasma III MCICP-MS,and we also measured Cd isotope compositions of deep seawaters from a column at the Southwest Indian Ocean Ridges (SWIR) to evaluate the impact of hydrothermal Cd to deep seawaters.The SWIR contains more than ten active and inactive hydrothermal systems(Tao et al.2012,2020),which release a large mass of hydrothermal fluids to the seafloor,providing an opportunity to examine the impact of hydrothermal Cd to deep ocean Cd cycling.
2 Materials and methods
2.1 Cd separation from seawater by Chelex 100 resin
We prepared three Cd stock solutions (Cd,1000 ng/L;NIST 3108)with three different aqueous media:pure water(Milli-Q water)(noted as PW),synthetic seawater(noted as SW),and synthetic seawater with a salinity twice that of seawater (noted as STSW).The chemical compositions of seawater were cited by Stumm and Morgan(1981).All the reagents (e.g.,NaCl,MgCl2),with guaranteed reagent,were used as received from Tianjin Kermel Chemical Reagent Co.,Ltd,China.After the Bio-Rad Chelex 100 resin 200–400 mesh,loaded onto the quartz columns(0.3 cm mean internal diameter;~1 mL),the resin was eluted using 10 mL,5% (v/v) HNO3to remove potential metals (e.g.,Cd),and then converted to its ammonia form using 5 mL,0.5 mol/L ammonium acetate (NH4Ac)(pH=~6.9).Samples were firstly added NH4Ac with NH4Ac concentrations at~0.5 mol/L to keep similar forms between samples and Chelex resin.Previous studies have shown that when the pH of samples was higher than 5,trace elements(e.g.,Cd)can be absorbed into Chelex resin(e.g.,Cheng et al.2021).Here,the pH of samples was raised to~6.9 by adding concentrated aqueous ammonia(NH4OH) and buffering with 5% (v/v) HNO3.1000 mL samples were added through the resin (~1 g) at a flow rate of~0.4 mL min-1,and then eluted with 5 mL 0.5 mol/L NH4Ac and 10 mL MQ water.Cd and other elements (e.g.,Zn,Sn) were collected in 14 steps with a total of 48 mL 5%(v/v)HNO3.In order to measure blank,Na,and Mg concentrations,a sample was prepared using the above method with 10 mL 5% HNO3.
2.2 Elution curve of synthetic seawater
Isobars and ion complexes,such as In,Sn,and M40Ar+(e.g.,70Zn40Ar+),have significantly affected the accuracy of Cd isotope measurements even at low concentrations(Zhu et al.2015;Peng et al.2021).It is thus important to separate Cd from the matrix.In our experiment,the interference of Zn,Ge,Sn,and In with concentration ratios to Cd of 2:1,1:1,1:1,and 1:1 was prepared by doping them into 1000 mL SW sample with 500 ng Cd.Nature seawater samples have extremely lower Pd and Ga concentrations in comparison with Cd.For example,Pd,Ga,and Cd concentrations of deep seawater in the North Atlantic are<1,~30,and~300 p mol/L,respectively(Abouchami et al.2014;Whitmore et al.2020;Mashio et al.2022).Thus,we here did not evaluate the Pd and Ga recoveries of this method.
2.3 Cd separation by AG-MP-1 M resin
The separation method is adapted from our previous work(Zhu et al.2013).The eluates,obtained by Chelex 100 resin,were evaporated to dryness and then dissolved in 2 mL of 2 mol/L HCl for the next separation.Three milliliters of AG-MP-1 M resin were packed in a quartz column.The resin was first cleaned with 20 mL of 0.0012 mol/L HCl and was then conditioned with 10 mL of 2 mol/L HCl.After the sample loaded on the column,the resin was washed following the sequence:10 mL of 2 mol/L HCl (elution of the matrix),30 mL of 0.3 mol/L HCl(elution of Pb,In,and Zn) 20 mL of 0.06 mol/L HCl(elution of Sn and Zn),5 mL of 0.012 mol/L HCl (elution of Zn),and 24 mL of 0.0012 mol/L HCl to collect Cd.The Cd eluates were then evaporated to dryness and redissolved in 3mL of 1%(v/v) HNO3for mass spectrometry analysis.The elution curve of Cd purification using an AG-MP-1 M resin has been reported by Wei et al.(2015,2017),and the Cd recovery of this method is 97 ± 1%.
2.4 Nature seawater samples
A 3-depth seawater profile,named 52III-LQ-S005CTD10,was collected from a column using CTD devices in the SWIR(Longitude 49.50°E;Latitude 37.78°S)on April 5th 2019,during the 52nd cruise of Dayang Yihao.The depth of seawater at the sample site is 3535 m below the seawater surface,and the collection depth of three samples,named S-55,S-54,and S-53,are 3200 m,3000 m,and 2800 m,respectively.About 1500 mL polyethylene bottles were used as tanks of seawater.All seawater samples were later acidified using 5 mL of concentrated HNO3.Samples were mixed with 60 ng111Cd–110Cd double spike solution,and the protocol for Cd purification followed the above method.
2.5 Major and trace element analyzing
In this study,Na and Mg concentrations of samples,purified by Chelex resin,were measured by a Perkin-Elmer Model 5100 PC flame atomic absorption spectrophotometer (FAAS) at the State Key Laboratory of Environmental Geochemistry,Chinese Academy of Sciences (SKLEG,CAS),and the detection limits of Na and Mg in samples are~0.2 μg/L.The in-house Na and Mg standards were prepared to make the standard calibration curve.The concentrations of Na and Mg were obtained by using the calibration curves.Zn,In,Sn,Ge,and Cd concentrations of eluate obtained from each step were measured using an ICP-MS (NexION 300X,PerkinElmer,USA) at the SKLEG,CAS.The in-house standards of elements of interest were prepared to obtain the standard calibration curves;the element concentrations were measured by using the calibration curves.
2.6 Precision and accuracy of standard solutions
The isotopic Cd compositions were determined by a Nu Plasma III (Nu Instrument,Wrexham,United Kingdom)multi collector inductively coupled plasma mass spectrometer (MC-ICP-MS) in dry plasma mode,using a CETAC.
Aridus III desolvating nebulization system at the Land Engineering Quality Testing of Shaanxi Land Engineering Construction Group Co.,Ltd,Xi’an,Shaanxi,China.The instrumental operating parameters and cup configuration of the Nu Plasma III are listed in Table 1.Considering the collector configuration,all Cd isotopes were measured except for106Cd and the110Cd,111Cd,112Cd,and114Cd were chosen for double spike calculation.Meanwhile,117Sn,115In,and105Pd were also measured during analysis for correction of isobaric interferences.Four solution standards,including the NIST 3108 (lot No.:130,116),Nancy Spex (lot No.: 74-075219K),JMC (lot No.:74-075219k),Spex-1(lot No.:CL6-30CDY;Wei et al.2015),and a purified Cd solution from a sulfide standard(J-Zn-1)were used to monitor the long-term instrumental stability over a month by the analyzes of 20 ng/mL spiked standards with114Cd signals at~4 V.All standards were firstly mixed with the111Cd–110Cd double spike solution to achieve a Cd spike–standard ratio of~1.To obtain high precision and accuracy of Cd isotope measurements,the spiked NIST 3108 standard was measured before and after each spiked sample for the mass bias correction procedure.In this study,NIST 3108 Cd solution was used as a‘‘zerostandard’’.The Cd isotope compositions of standards and samples are noted as δ114/110Cd,which are given in per mil(delta) notation following the equation:

3 Results and discussion
3.1 Total Cd blank and Cd recovery by Chelex 100 and AG-MP-1 M resin
1000 mL of STSW,SW,and PW samples were progressed by Chelex resin,and 10 mL 5% HNO3were used to elute metals from the resin to monitor the total blanks of Zn,Cd,and Sn,which were analyzed using a NexION 300 ICPMS.The average values of Cd in PW,SW,and STSW samples are 0.65 ± 0.18 ng (2SD;N=2),0.30 ± 0.16 ng(2SD;N=3),and 0.16 ± 0.01 ng (2SD;N=2),respectively.However,Zn and Sn backgrounds of the SW sample are much higher than Cd,with total Zn and Sn blanks averaging at 63 ± 15 ng (2SD;N=3) and 96 ± 10 ng(2SD;N=3).10 mL of PW was used to monitor the Cd background during Cd purification by AG-MP-1M resin,and the total Cd blank is <0.1 ng.These results indicate that most Cd in blanks was likely derived from reagents(e.g.,NaCl,MgCl2,and NH4Ac).The total procedural Cd blank for this protocol was negligible in comparison with Cd concentrations in seawater (~100 ng/L).
3.2 Elution curve and Cd recovery
The Cd recoveries of 1 g,1.5 g,and 2.0 g Chelex resin of SW samples are 96.7%,86.6%,and 88.9%,respectively(Table 2).Thus,1 g Chelex resin is enough to separate Cd from seawater,and 6 mL 5%(v/v)HNO3of elution volume could elute Cd from the columns.However,we did not measure the total Cd eluted by 10 mL 0.5 mol/L NH4Ac and 10 mL MQ water,which may contain some Cd.Meanwhile,it is possible that after Cd is loaded on Chelex resin,6 mL 5%(v/v)HNO3may not be enough to elute all Cd from 1.5 to 2.0 g resin.The two factors may result in low Cd recoveries during separation by 1.5 and 2.0 g Chelex resin.Further investigation is needed to figure out the potential factors.

Table 2 Cd weights of elution volumes by different resin weight and aqueous media
We also obtained Cd recoveries of Cd stock solution with three different aqueous media (PW,SW,and SWST)(Table 2),and the results show that the salinity of seawater has negligible effects on Cd recoveries (98.3 ± 3.5%;2SD,N=6) for this approach.As shown in Fig.1;Table 3,most Zn,In,and Cd are eluted at the first 6 mL of 5% HNO3with minor Sn,and the Chelex-100 resin exhibits poor efficiency to remove Cd from In,Zn,and Sn.In addition,the SW sample(2#)contains some Na(2.4 μg/L)and Mg (7.2 μg/L) after purification.Thus,further separation is needed.The elution curve of AG-MP-1M resin has been reported by Wei et al.(2015) with Cd recoveries at 97 ± 3%.Na and Mg are eluted using 10 mL 2 mol/L HCl,and another matrix could also be eluted as elucidated in Sect.2.3.
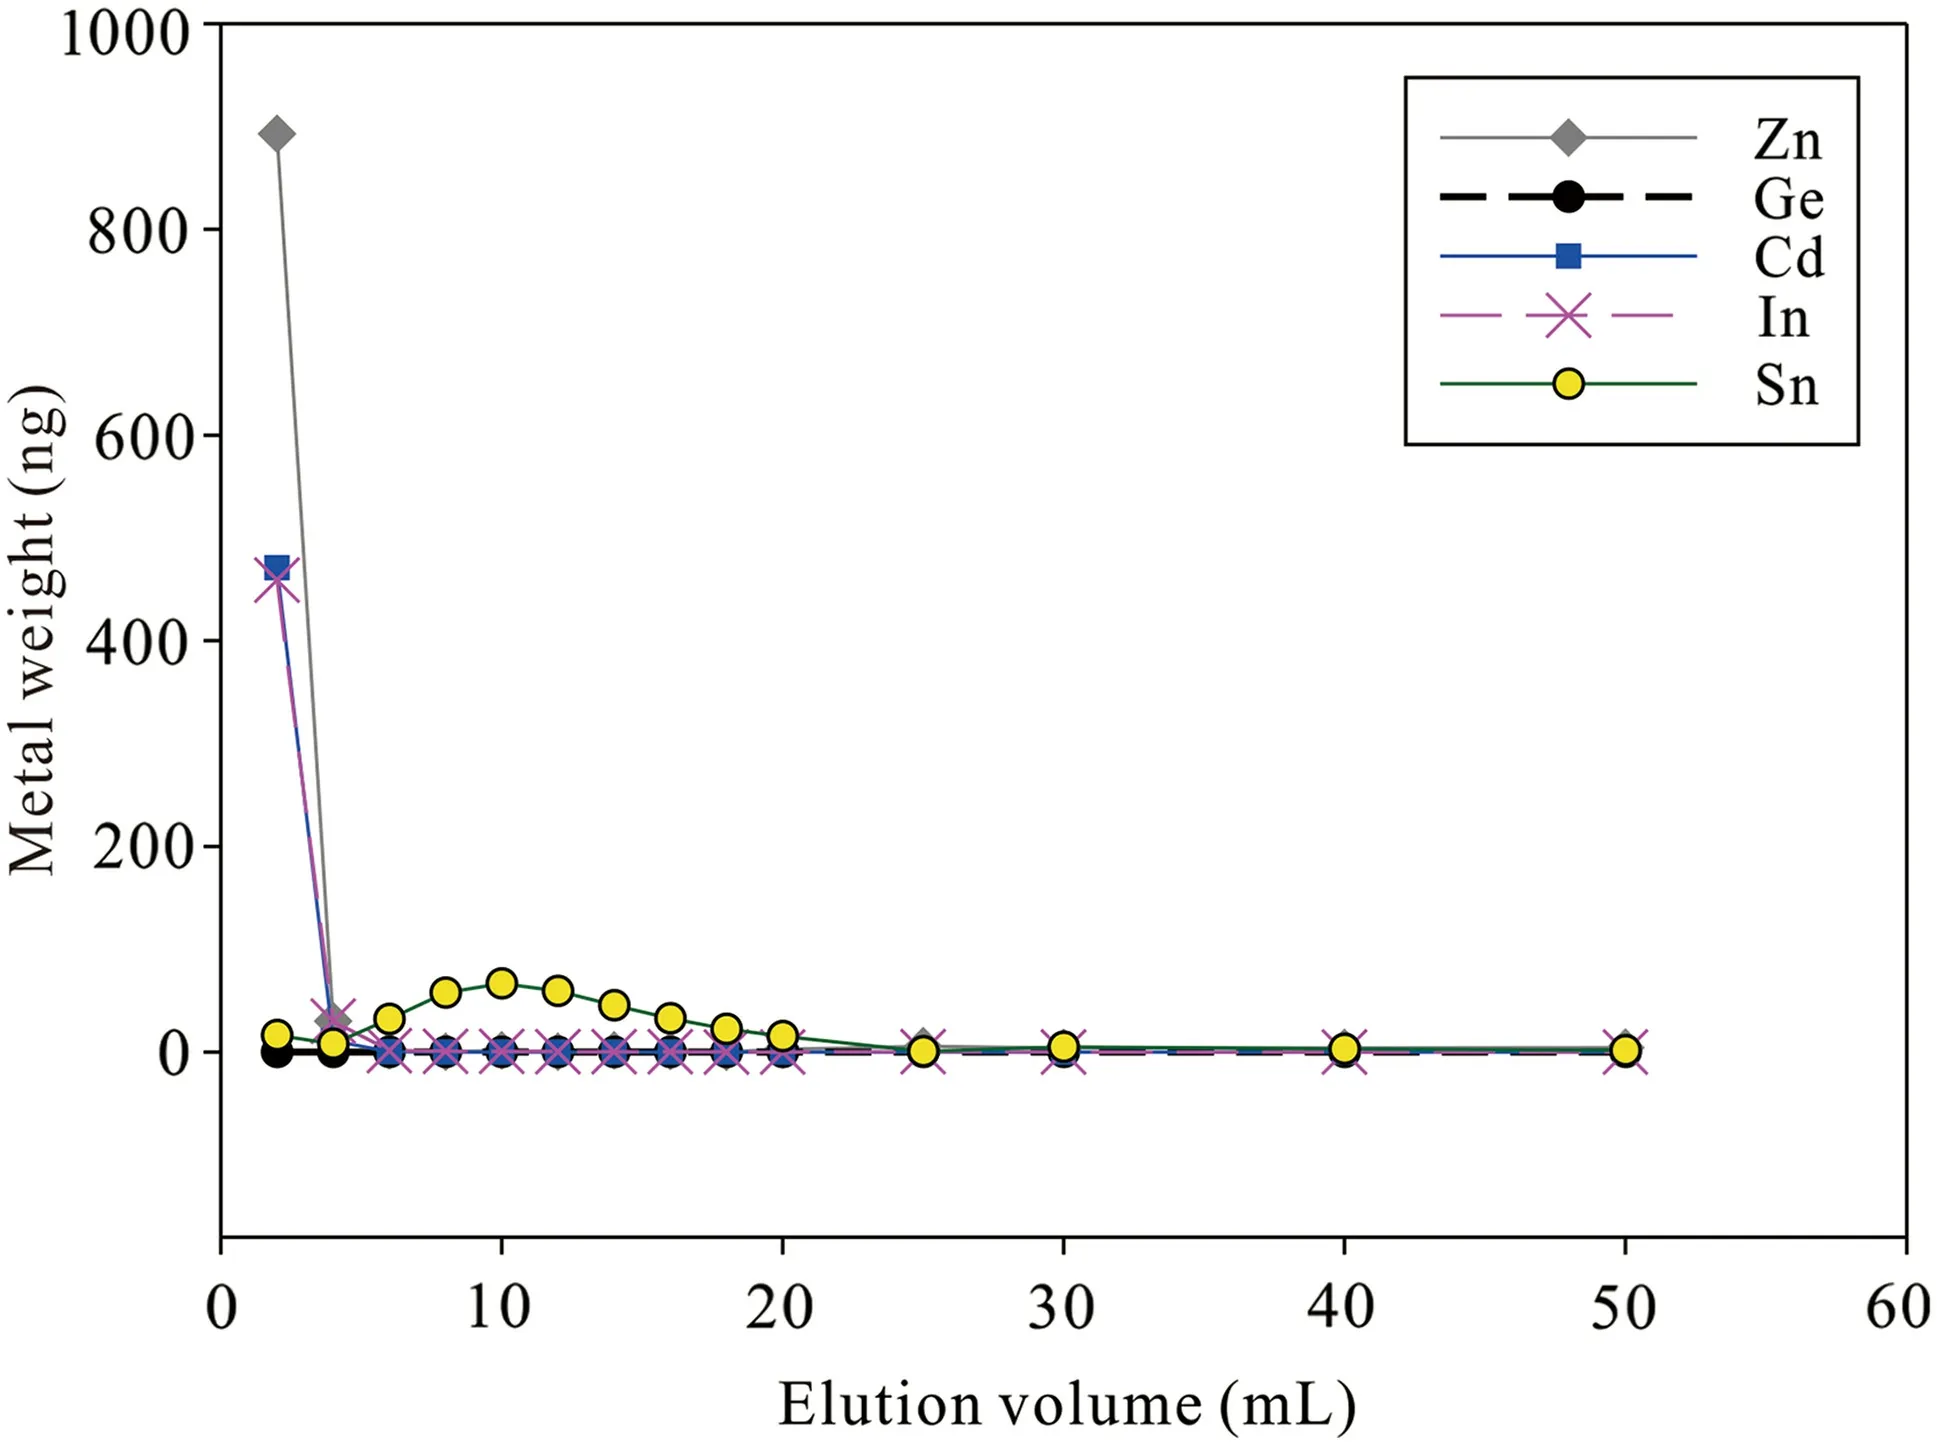
Fig.1 Elution curve of the Chelex-100 for the synthetic seawater doping with Zn,Ge,Cd,In,and Sn
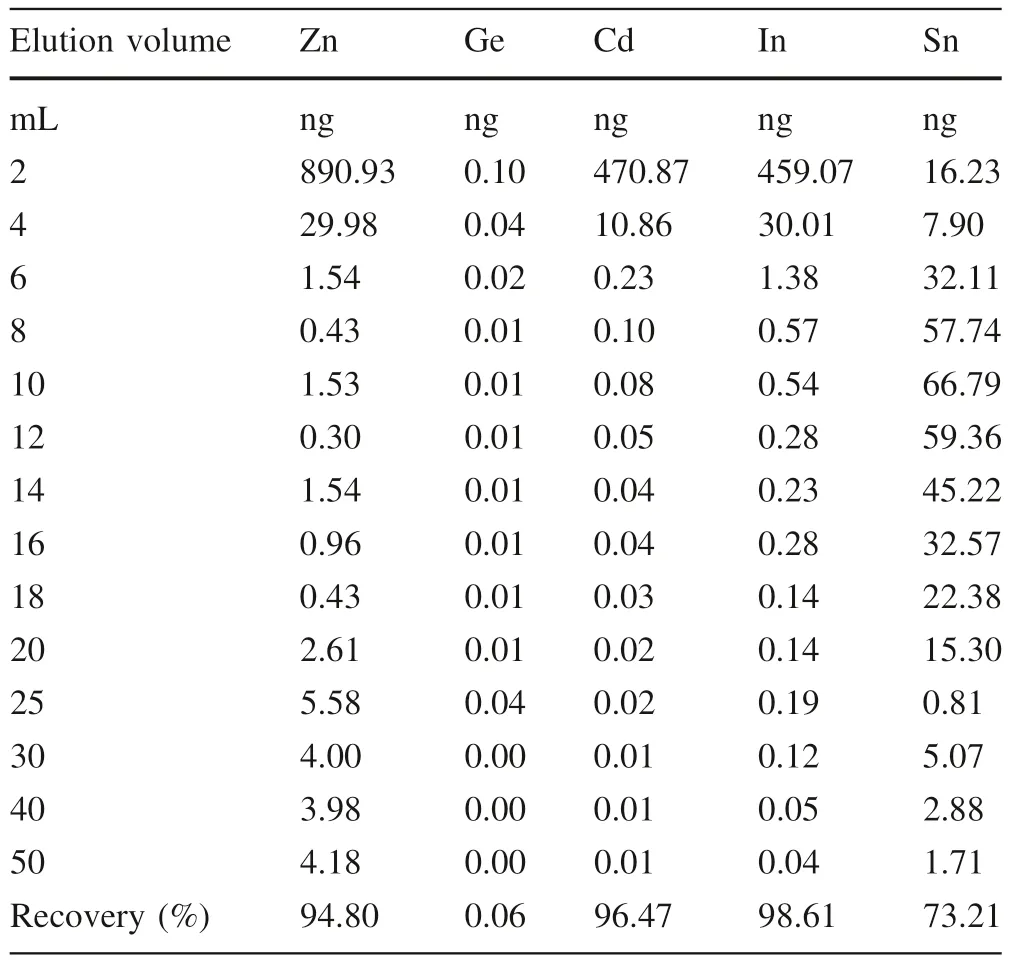
Table 3 Elution curve of Zn,Ge,Cd,In and Sn of synthetic seawater
The total Cd recovery,obtained by Chelex+AG-MP-1M resin,was assessed by doping four 1 L synthetic seawaters with Cd concentrations of 1000 ng/L (NIST-3108),and then samples were added 1000 ng111Cd–110Cd double spike solution to obtain the recoveries,which were found to be 96.3 ± 1.5%(2SD;N=4)(Table 1).The recoveries of this study are better than those reported previously(~86 ± 1%;Lacan et al.2006).
3.3 Cd isotope compositions of standards
The Cd isotope compositions(δ114/110Cd)of double-spiked standards were calculated using a MATLAB-based script with an iterative double-spike correction algorithm.As shown in Fig.2,duplicate measurements of δ114/110Cd values of J-Zn-1,Nancy Spex,Spex-1,and JMC are-0.03 ± 0.07‰ (2SD),-0.13 ± 0.09‰(2SD),-1.24 ± 0.08‰(2SD),and -1.67 ± 0.08‰,respectively,matching well with previous reported values (J-Zn-1,-0.05 ± 0.08‰,2SD,Yang et al.2022;Nancy Spex,-0.10 ± 0.07‰,2SD,Zhang et al.2018;Spex-1,-1.25 ± 0.06‰,2SD,Wei et al.2017;JMC,1.71 ± 0.06‰,2SD;Zhang et al.2018).
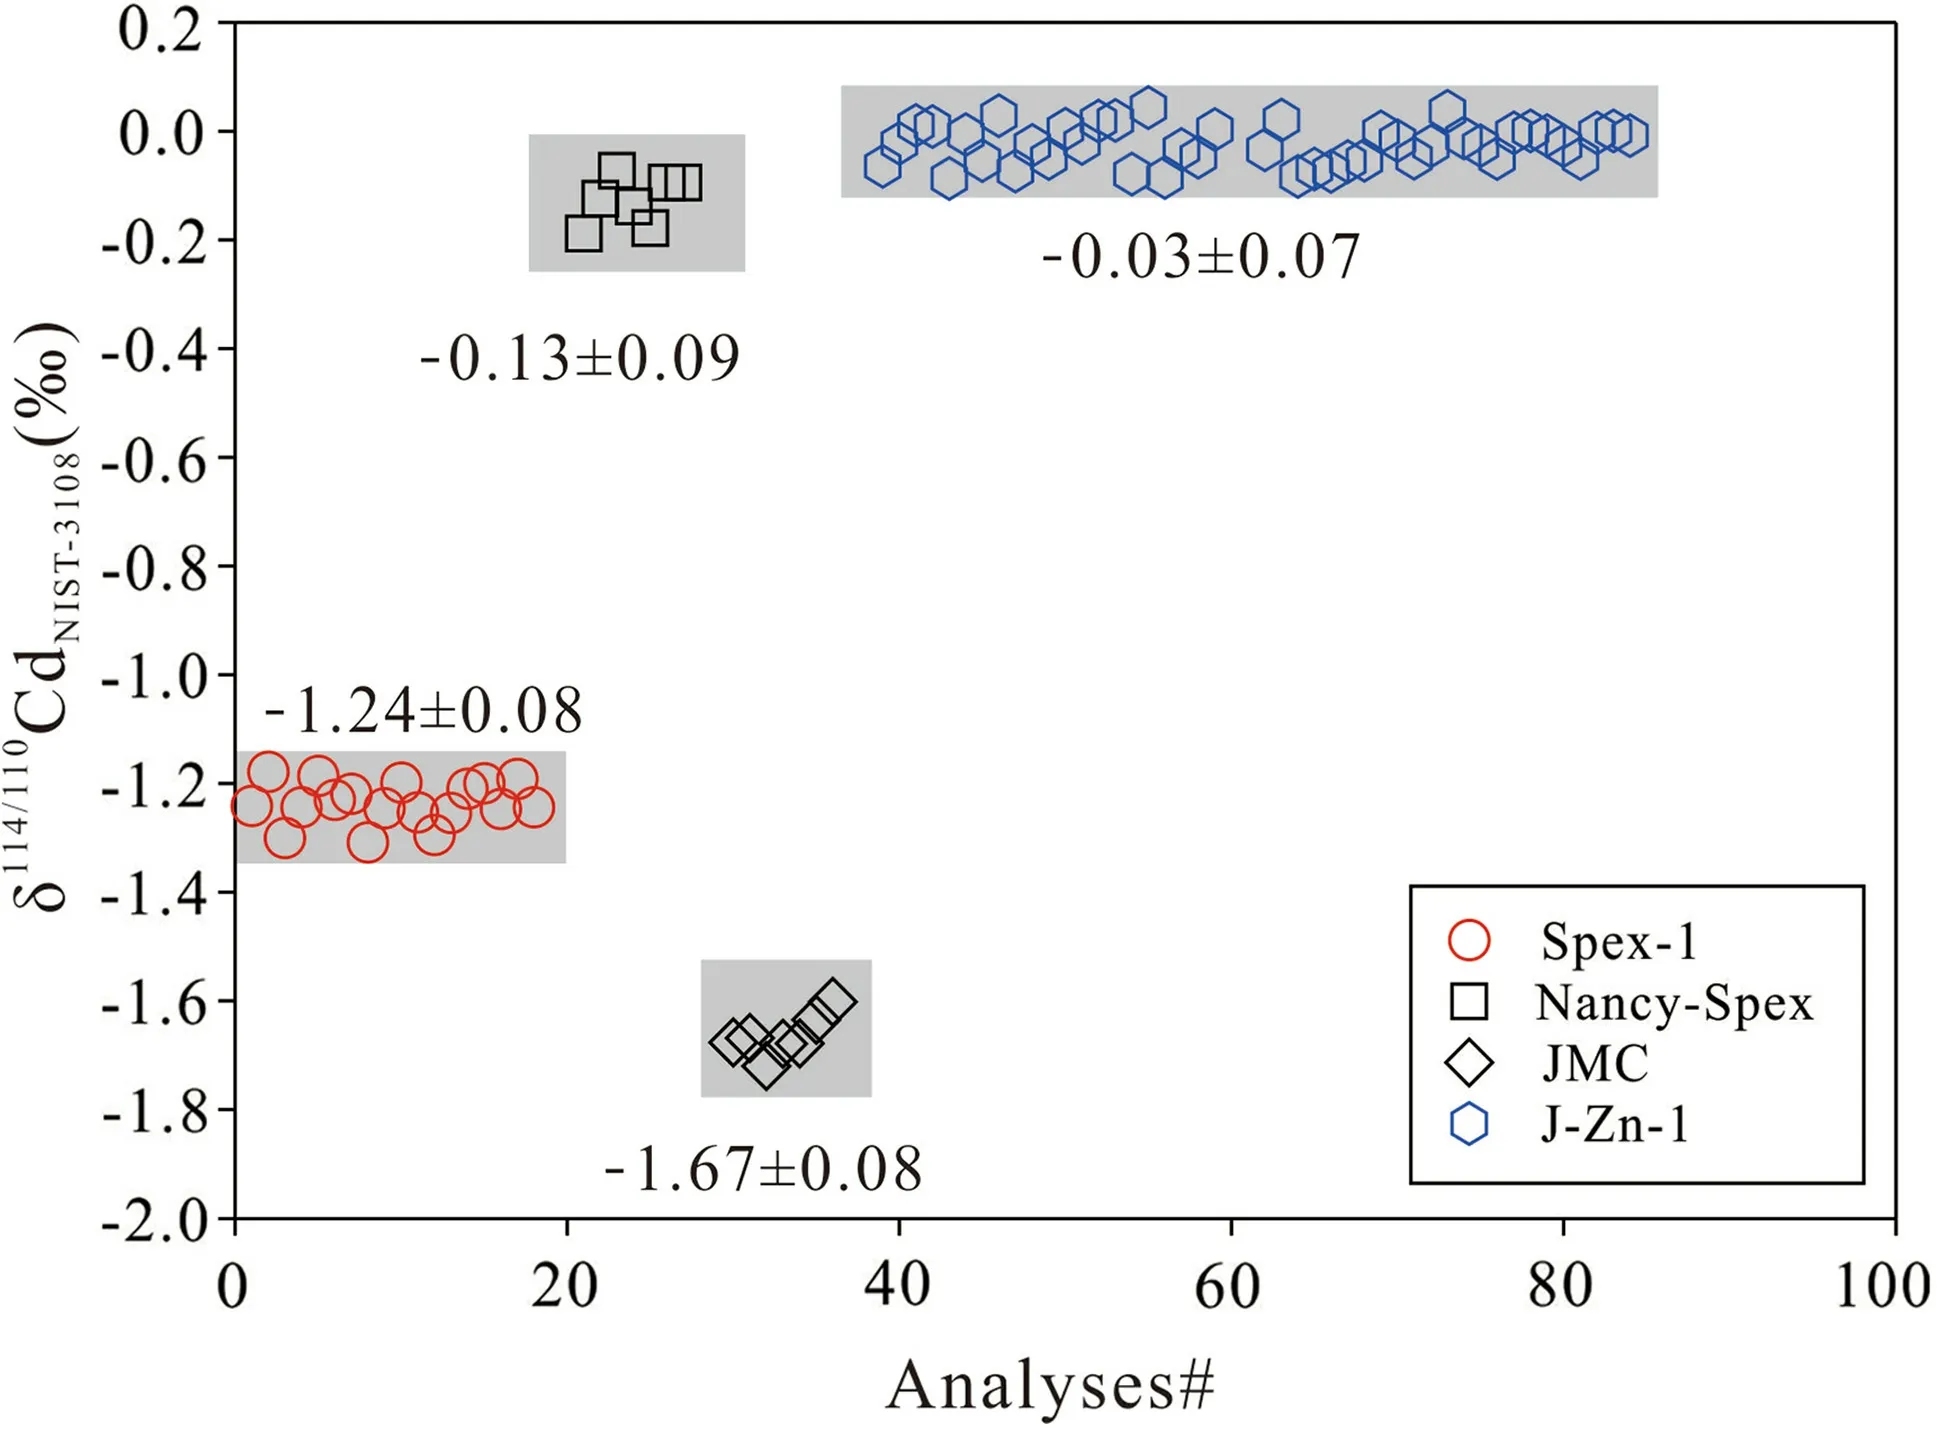
Fig.2 The long-term (from November 2022 to December 2022)reproducibility of Cd isotopic analysis monitored by the measurement of 20 ng of four Cd solutions using both the double spike and SSB methods
We prepared 4 pairs of samples,with 1000 ng NIST 3108 and 1000 ng110Cd–111Cd double spike solution in 1000 mL SW and STSW,that were purified by Chelex resin and Chelex+AG-MP-1M resin,respectively.The results show that the δ114/110Cd values of SW and STSW purified by Chelex resin are much lower than the reference value of NIST 3108 (δ114/110Cd=0‰);however,samples purified by Chelex+AG-MP-1M resin have similar Cd isotope compositions with NIST 3108 (Fig.3).As shown previously,Cd isotope standards with different Zn and Sn doping could result in big Cd isotope offsets (Liu et al.2020;Peng et al.2021).The elution curve of Chelex resin shows that it is insufficient to separate Cd from Sn and Zn,and the relatively high Sn and Zn backgrounds are also likely an important factor that results in such a big Cd isotope offset.In addition,Na and Mg may also be a potential factor due to their high concentrations (<10 μg/L).We compared isobaric interferences between those samples and found that In and Pd signals have no significant changes between samples and NIST 3108;However,Sn signals were decreased 10 times from~0.02 V in Chelex resin purified samples to~0.002 V in Chelex +AG-MP-1M resin purified samples.These results demonstrate that the method,using Chelex+AG-MP-1M,is suitable to separate Cd from different aqueous media.
Fig.3 δ114/110Cd values of four pairs of samples obtained by Chelex and Chelex+AG-MP-1M resin
3.4 Cd isotope composition of natural seawater and its implications
The δ114/110Cd values of S-55,S-54,and S-53 are 1.05 ± 0.05‰,0.35 ± 0.04‰,and 0.36 ± 0.05‰,respectively;Cd concentrations,calculated by Cd double spike,of the three samples are 38,40,and 39 ng/L,respectively.The average Cd recovery of the three samples is 97 ± 5% (2SD;N=3),similar to that obtained by SW and STSW samples (96.3 ± 1.5%).
In modern deep seawater,Cd isotopes are relatively homogenous with δ114/110Cd values ranging from 0.2‰ to 0.5‰ in different oceans (Janssen et al.2017;Sieber et al.2019).However,there are no reported Cdisotopic data of deep seawater from SWIR.From 3000 m to 2800 m,no significant Cd isotope variation was observed with δ114/110Cd values concentrated at 0.35‰;however,seawater at 3200 m is strongly enriched in heavy Cdisotopes,and such positive δ114/110Cd value has not been reported in other deep seawaters.Previous studies have shown that hydrothermal plumes could result in Cd depletion and positive δ114/110Cd value (up to 1.3‰) in seawater (depth 60 m) due to deposition of authigenic CdS with light Cd isotope(Guinoiseau et al.2018;Xie et al.2019);however,there are no significant variations of Cd concentrations from 3200 m to 2800 m,suggesting that CdS deposition is not likely the factor that results in the variations of δ114/110Cd in the profile.The sample site(Longitude 49.50°E;Latitude 37.78° S) is~13 km away from the Longqi hydrothermal field(Longitude 49.64°E;Latitude 37.78°S),which is an active hydrothermal system(Tao et al.2020).The impact of hydrothermal plumes could reach distances of a few kilometers to more than thousands of kilometers (Tao et al.2017 and references therein).Considering the close spatial relationship between the sample site and the Longqi hydrothermal field,deep seawaters are likely affected by active vent fluids.Although Cd isotope compositions of vent fluids have not been reported, the vent fluids with dissolved Cd are extremely enriched in heavy Cd isotopes due to sulfide precipitation around seafloor hydrothermal systems(Schmitt et al.2009).In addition,the precipitation of Fe oxide and/or calcite particles from buoyant plumes could not only remove Cd from surrounding seawater but also results in deep seawaters enriched in heavy Cd isotopes during plume dispersal becauselight because light Cd isotopes preferred to adsorb onto Fe oxides or calcite particles(Yan et al.2021;Peng et al.2023)(Fig.4).Thus,we propose that dissolved Cd from plume is unlikely to change Cd concentrations in seawater,resulting in Cd concentrations of S-55 have no significant increase in comparing with that of S-54 and S-53.This could also be supported by that the total Cd in most deep seawaters from the Longqi hydrothermal field is similar to that of background seawater(Fang and Wang 2021).Although Cd concentrations in seawater could not be used to distinguish the impact of plumes,the Cd isotope is more sensitive and could be used as a prospecting tool for seafloor plumes and sulfide deposits.
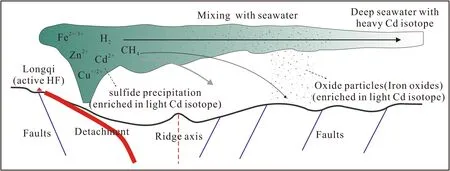
Fig.4 Diagram,modified after Escartin et al.(2008) and Tao et al.(2020),showing the dispersion of the hydrothermal plume at the Longqi hydrothermal field (HF) and distribution of Cd isotope in particles and seawaters during plume dispersal
4 Conclusion
This study reports a high-precision Cd isotopic composition of seawater using a Nu Plasma III and the110Cd–111Cd double spike technique.The Chelex resin was used to separate Cd from Na and Mg matrix with Cd recoveries at 98.3 ± 3.5% (2SD,N=6).We also evaluated the elution curve of Chelex resin,which is insufficient to remove Cd from isobaric inferences (Zn,In,and Sn).This could also be supported by that the δ114/110Cd values (-0.97‰ to-2.18‰) of Cd isotope standard (NIST-3108) doped synthetic seawater are much lower than the reference value(~0.00‰).Thus,further separation is needed.The AGMP-1 M resin was used to remove the residual Na,Mg,and isobaric inferences in the synthetic seawaters with Cd recoveries at 97 ± 3%.The results show that the δ114/110Cd values (-0.01‰ to 0.02‰) of Cd isotope standard doped synthetic seawaters are consistent with the reference value (~0.00‰) with Cd recoveries at 96.3 ± 1.5%(2SD;N=4),suggesting that the method (Chelex+AGMP-1M) is efficient to separate Cd from seawater.
Based on the developed method in this study,we measure Cd isotope compositions of three deep seawaters from the SWIR,and the results show that there are no significant variations in Cd concentrations in deep seawaters;however,the δ114/110Cd values of the samples are varied from 0.35 to 1.05‰.The sample enriched in a heavy Cd isotope is likely contaminated by the vent fluids at the sample site due to the close spatial relationship between the sample site and an active hydrothermal field.We propose that the Cd isotope is a more sufficient tool than its concentration to distinguish the impact of plumes on deep seawater.
AcknowledgementsThis research was financially supported by the National Natural Science Foundation of China(Grant No.42073010),the Key Research and Development Program of Yunnan Province(Grant No.202103AQ100003),and a special fund managed by the State Key Laboratory of Ore Deposit Geochemistry,Chinese Academy of Sciences.
Declarations
Conflict of interestThe authors declare no competing interests.

- Acta Geochimica的其它文章
- The cooling models of Earth’s early mantle
- Petrology of lherzolite xenoliths of Hosséré Sédé volcano(Adamawa plateau,Ngaoundéré area,Cameroon)
- Distribution,risk evaluation,and source analysis of the heavy metals in the sediment deposition of the lower Shichuanhe River,Shaanxi,China
- Decoding the nature of interaction between felsic clasts and mafic magma in a subvolcanic magma chamber from amphibole–titanite transformation and chemistry
- Isotopic analysis based on terahertz spectrum
- In situ infiltration-precipitation processes in some rock systems