
Prediction of maximum upward displacement of shield tunnel linings during construction using particle swarm optimization-random forest algorithm
2024-01-24 06:01XiaoweiYEXiaolongZHANGYanboCHENYujunWEIYangDING
Xiaowei YE, Xiaolong ZHANG, Yanbo CHEN, Yujun WEI, Yang DING
Research Article
Prediction of maximum upward displacement of shield tunnel linings during construction using particle swarm optimization-random forest algorithm

1MOE Key Laboratory of Soft Soils and Geoenvironmental Engineering, Zhejiang University, Hangzhou 310058, China2Department of Civil Engineering, Zhejiang University, Hangzhou 310058, China3Zhejiang Engineering Research Center of Intelligent Urban Infrastructure, Hangzhou City University, Hangzhou 310015, China
During construction, the shield linings of tunnels often face the problem of local or overall upward movement after leaving the shield tail in soft soil areas or during some large diameter shield projects. Differential floating will increase the initial stress on the segments and bolts which is harmful to the service performance of the tunnel. In this study we used a random forest (RF) algorithm combined particle swarm optimization (PSO) and 5-fold cross-validation (5-fold CV) to predict the maximum upward displacement of tunnel linings induced by shield tunnel excavation. The mechanism and factors causing upward movement of the tunnel lining are comprehensively summarized. Twelve input variables were selected according to results from analysis of influencing factors. The prediction performance of two models, PSO-RF and RF (default) were compared. The Gini value was obtained to represent the relative importance of the influencing factors to the upward displacement of linings. The PSO-RF model successfully predicted the maximum upward displacement of the tunnel linings with a low error (mean absolute error (MAE)=4.04 mm, root mean square error (RMSE)=5.67 mm) and high correlation (2=0.915). The thrust and depth of the tunnel were the most important factors in the prediction model influencing the upward displacement of the tunnel linings.
Random forest (RF); Particle swarm optimization (PSO); Upward displacement of lining; Machine learning prediction; Shield tunneling construction
1 Introduction
Shield tunnel excavation has a short construction cycle and a high level of mechanization, becoming the prior choice in many countries and regions to develop urban underground spaces (Ding et al., 2023c; Ye et al., 2023). Since Dec. 31, 2022, 41 cities have constructed metro tunnel lines with a total length of 8008 km in China, mostly in soft soils in the southeast.
However, the shield tunnel linings often show local or overall upward movement after leaving the shield tail in soft soil areas or during some large diameter shield projects, especially when tunnelling an upper soft and lower hard stratum with a shallow overburden of soil or high water pressure (Ye et al., 2008; Zhou and Ji, 2014). Differential floating increases the initial stress of the segments and bolts, which is harmful to the service performance of shield tunnel, and results in the lining crack, damage, dislocation, and water leakage and even axis deviation (Fig. 1). Therefore, it is important to study the mechanism involved, develop methods to predict the upward movement of the lining, and implement effective measures to control such movement to enable safe construction.
Traditional prediction methods for upward movement of tunnel linings can be divided into those based on theoretical analysis and those based on numerical simulation. Theoretical analysis is based on the loading-structure method, in which the tunnel linings are simplified into a longitudinal beam, assuming the anti-floating effect of overlying soil into the foundation spring. After analyzing various loads based on empirical formulas, the upward displacement of linings is calculated (Geng et al., 2021). However, the calculation model is a 2D plane model that cannot analyze the 3D stress on the lining. Moreover, the magnitude and distribution of loads are based on experience and assumption, which may be inconsistent with the actual complex geological conditions. Numerical simulation is based on establishing a 3D soil-tunnel numerical model to predict the upward displacement, considering the complex interaction between tunnel construction and the surrounding stratum (Ye et al., 2014; Liang et al., 2022). However, the accuracy of the prediction depends on the selection of appropriate soil constitutive model and the assumption of a contact relationship between the soil and the linings. In addition, it needs to be remodeled for different sections, which is time consuming and costly.
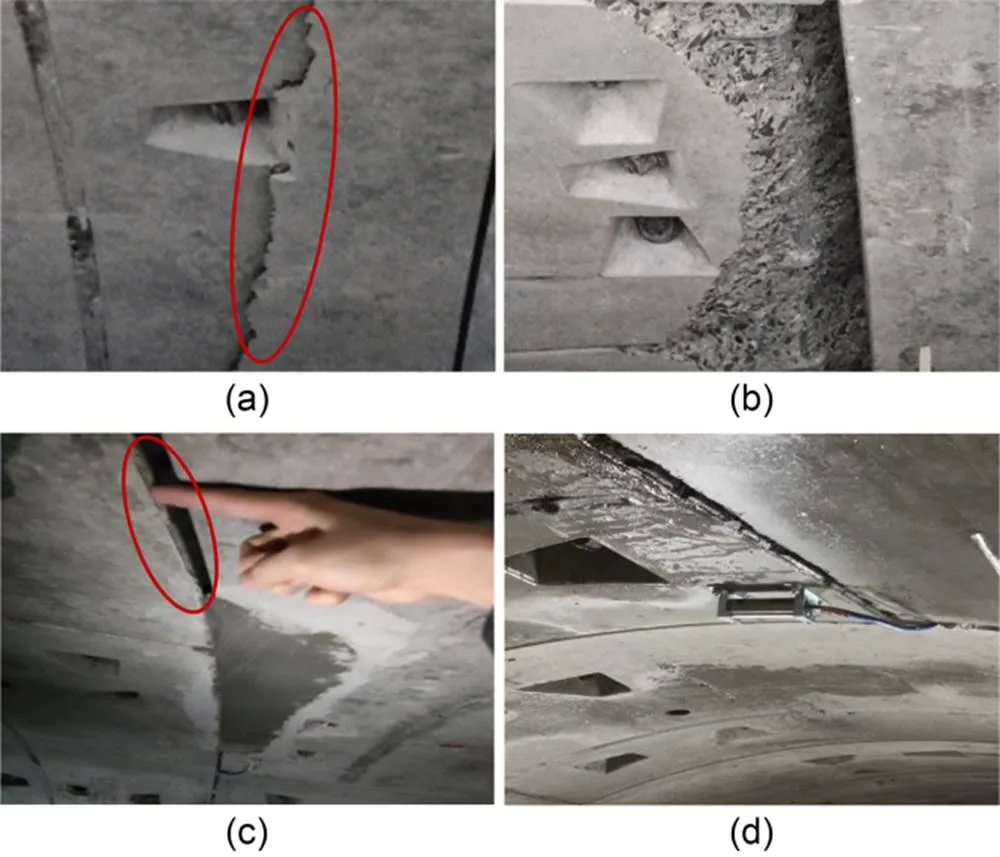
Fig. 1 Engineering problems induced by upward movement of tunnel linings: (a) crack; (b) damage; (c) dislocation; (d) water leakage
The development of machine learning (ML) has provided an efficient and suitable alternative way to solve the prediction problems of civil engineering (Ye et al., 2019, 2022; Lin et al., 2022; Shan et al., 2022; Shen et al., 2022). ML not only has excellent performance in processing high dimensional variables that can help find the internal relationships between relevant parameters, but also has powerful computing power with a much lower computational cost and higher operability (Lv et al., 2022). Among ML methods, random forest (RF) is used widely because of its powerful learning performance and high robustness. Zhou et al. (2016) proposed using RF to classify rock burst in underground projects. Luo et al. (2020) established an RF prediction model to forecast and analyze the slurry pressure at the shield cut during construction in a composite stratum. Kohestani et al. (2017) and Zhou et al. (2017) verified the excellent prediction performance using RF to predict the maximum surface settlement induced by tunnelling. Elbaz et al. (2020, 2023) verified the excellent performance of particle swarm optimization (PSO) to improve the prediction performance of ML algorithms. However, RF is rarely employed to predict the upward displacement of tunnel linings, and the input variables are not strictly selected according to the relevant geotechnical knowledge and their physical meaning is obscure.
To address these problems, we propose a hybrid RF algorithm combining PSO and 5-fold cross-validation (5-fold CV) to accurately predict the maximum upward displacement of tunnel linings caused by shield tunnel excavation. This hybrid algorithm can effectively avoid the problem of over- or under-fitting in optimization and improve the robustness and generalization of prediction models. The mechanism and factors causing upward movement of the tunnel lining during construction are comprehensively summarized. Twelve input variables are selected according to the results from analysis of influencing factors. The prediction performance of two models, PSO-RF and RF (default) are compared using three evaluation indicators: the mean absolute error (MAE), root mean square error (RMSE), and-square (2). The Gini value is obtained to represent the relative importance of the influencing factors on upward displacement of the linings.
2 Mechanism of upward movement of tunnel linings
2.1 Reasons for upward movement of tunnel linings
There are five main reasons why tunnel linings move upward during construction: tail void, soil disturbance, slurry buoyancy, rebound of foundation, and jack unloading.
2.1.1Tail void
Since the excavation diameter of a shield machine is larger than the outer diameter of the tunnel lining, there will be a tail void between the lining and the surrounding soil, which provides the lining with space for upward movement (Fig. 2). Although the void will be filled with slurry during tunneling, the slurry takes time to become consolidated (Wang SM et al., 2022). The liquid slurry cannot stop the upward movement of tunnel linings.
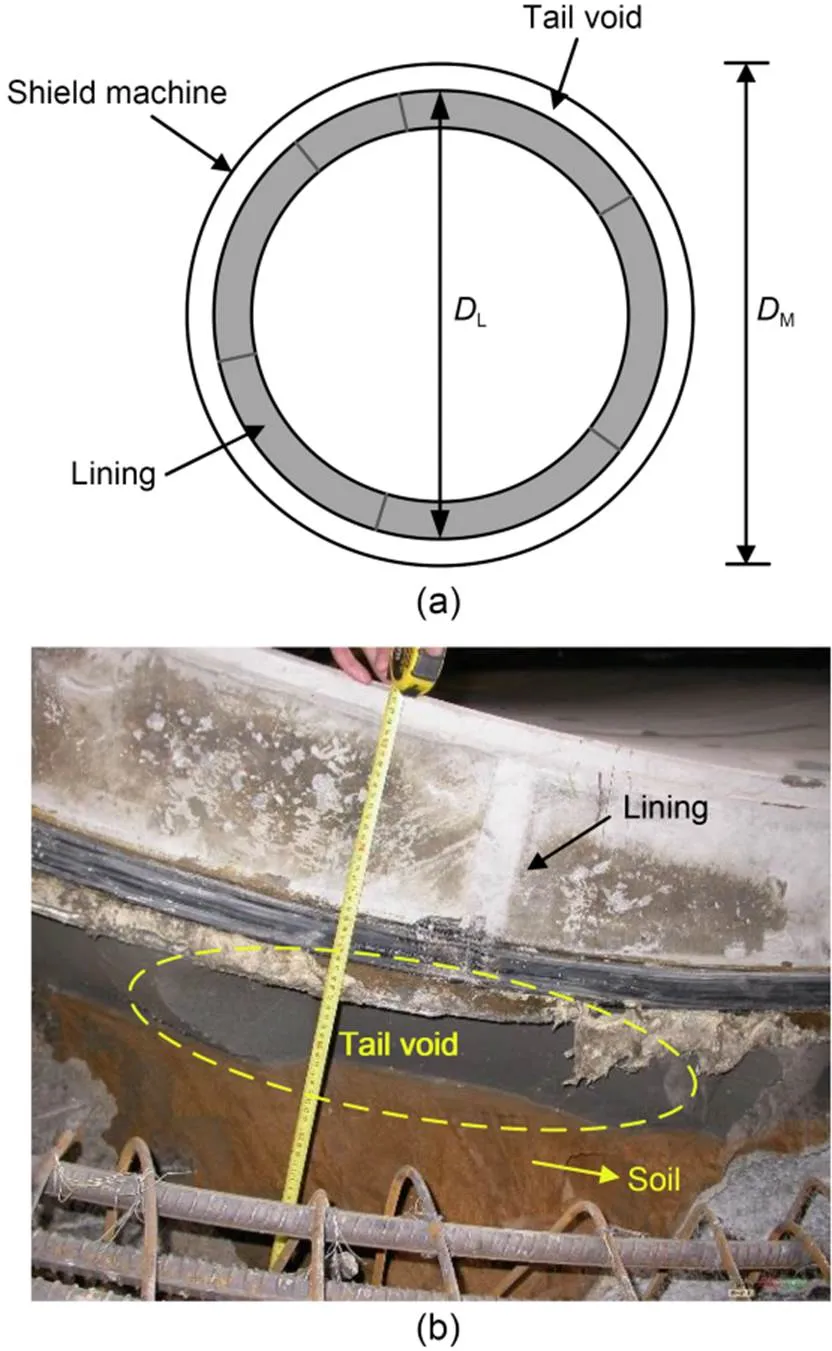
Fig. 2 Tail void: (a) schematic diagram; (b) field picture of tail void. DL is the diameter of lining; DM is the diameter of shield machine
2.1.2Soil disturbance
The surrounding soil will inevitably be disturbed during the advancement of the shield machine. There have been many studies of soil disturbance induced by tunneling (Fargnoli et al., 2015; Elbaz et al., 2022; Shi et al., 2022; Wang J et al., 2022). The nature of soil disturbance is that excavation will destroy the soil structure and change the pore pressure of the surrounding stratum, especially in a soft soil area within a structurally soft stratum. This will decrease the strength and stability of the soil, affect the space of the tail void and cause deformation of the soil (Chen et al., 2013).
2.1.3Slurry buoyancy
In soft soil area, when the linings leave the shield machine tail, the upper section of the tail void is filled with the surrounding stratum because of its own gravity and tunnelling disturbance. The lower part of the tail void still exists because several adjacent linings are equivalent to a beam fixed at both ends. One end is constrained by the shield machine, and the other end by the consolidated slurry (Yang et al., 2022). During the process of backfill grouting, the lower part of the tail void is occupied by unconsolidated slurry and underground water, which generates upward buoyancy (Fig. 3).
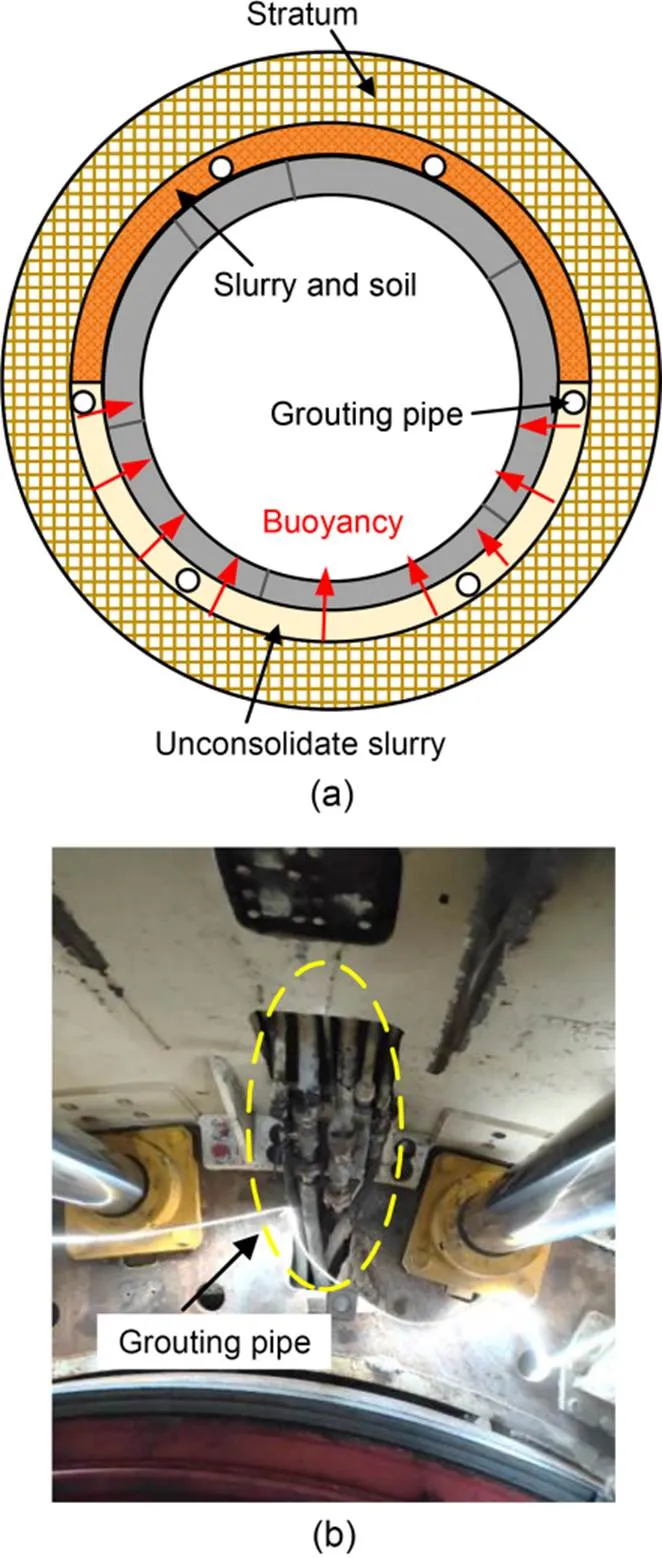
Fig. 3 Slurry buoyancy: (a) schematic diagram; (b) field picture of grouting pipes
2.1.4Rebound of foundation
Due to the difference in weight between the excavated soil and the tunnel linings, the stratum beneath the tunnel will experience unloading and subsequently rebound upwards. This will lift the linings after the slurry becomes consolidated (Fig. 4). Lv et al. (2017) concluded that the upward movement of tunnel linings in soft soil areas is caused mainly by the rebound force of the foundation induced by the redistribution of stratum stress.
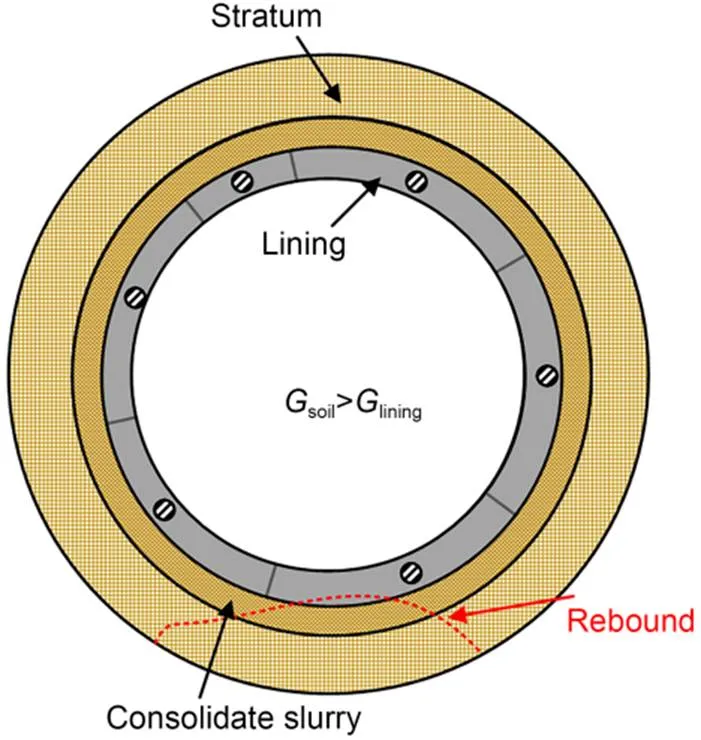
Fig. 4 Rebound of foundation. Gsoil is the gravity of excavated soil; Glining is the gravity of lining
2.1.5Jack unloading
Jack loading or unloading will increase or decrease the longitudinal binding force on the linings, which will affect their upward displacement (Neu et al., 2022). When shield machine tunneling, the jack thrust is large, which increases the longitudinal binding force on linings, and the vertical displacement of linings is basically unchanged. When the shield machine stops and the jack is unloaded to assemble the lining segments, the longitudinal binding force on the linings decreases, and the vertical displacement of the linings increases rapidly. For example, when the No. (+1) ring is assembled, the No.ring is still stuck in the shield machine without floating. When excavating the No. (+2) ring, the No.ring starts to leave the shield machine and begins floating. However, during this period, the jack is still loading and the longitudinal binding force on the linings is still large, so the vertical displacement of the segment rises slightly. When assembling the No. (+2) ring, the jack unloads and the longitudinal binding force on the linings declines dramatically, so the vertical displacement of the segments grows remarkably. The association between the upward displacement of the tunnel linings and the construction process of the shield machine is shown in Fig. 5.
In essence, the tail void and soil disturbance will affect the floating space, and the slurry buoyancy, foundation rebound, and jack unloading will affect the upward external forces on the linings which influence the floating trend. Therefore, the combination of the floating space and floating trend makes the linings move upward, which provides the mechanism for the upward movement of the tunnel linings.
2.2 Factors influencing upward movement of tunnel linings
This section provides a comprehensive summary of the factors contributing to the upward movement of tunnel linings based on the reasons for floating analyzed in Section 2.1. The influencing factors can be categorized into three main groups: tunnel geometry, shield operation parameters, and geological conditions.
2.2.1Tunnel geometry
For a shield tunnel, the tunnel linings along the tunnel axis direction (longitudinally) and perpendicular to the tunnel axis direction (laterally) are connected by bolts. Many studies have verified the lateral and longitudinal stiffness (L) of the connection of tunnel linings and bolts. The re-tightening force of bolt (P) will determine the deformation of the tunnel by affecting the friction between linings, which eventually influences the upward displacement of the lining (Talmon and Bezuijen, 2013). In addition, it has been demonstrated that the upward displacement of the tunnel lining shows a decreasing trend with increasing tunnel cover depth (C) due to the increased weight of the overlying stratum (Chen et al., 2014). These two factors affect the upward displacement by influencing the floating trend, while the different shapes () and diameters (L) of the lining lead to different upward displacements by affecting the tail void.
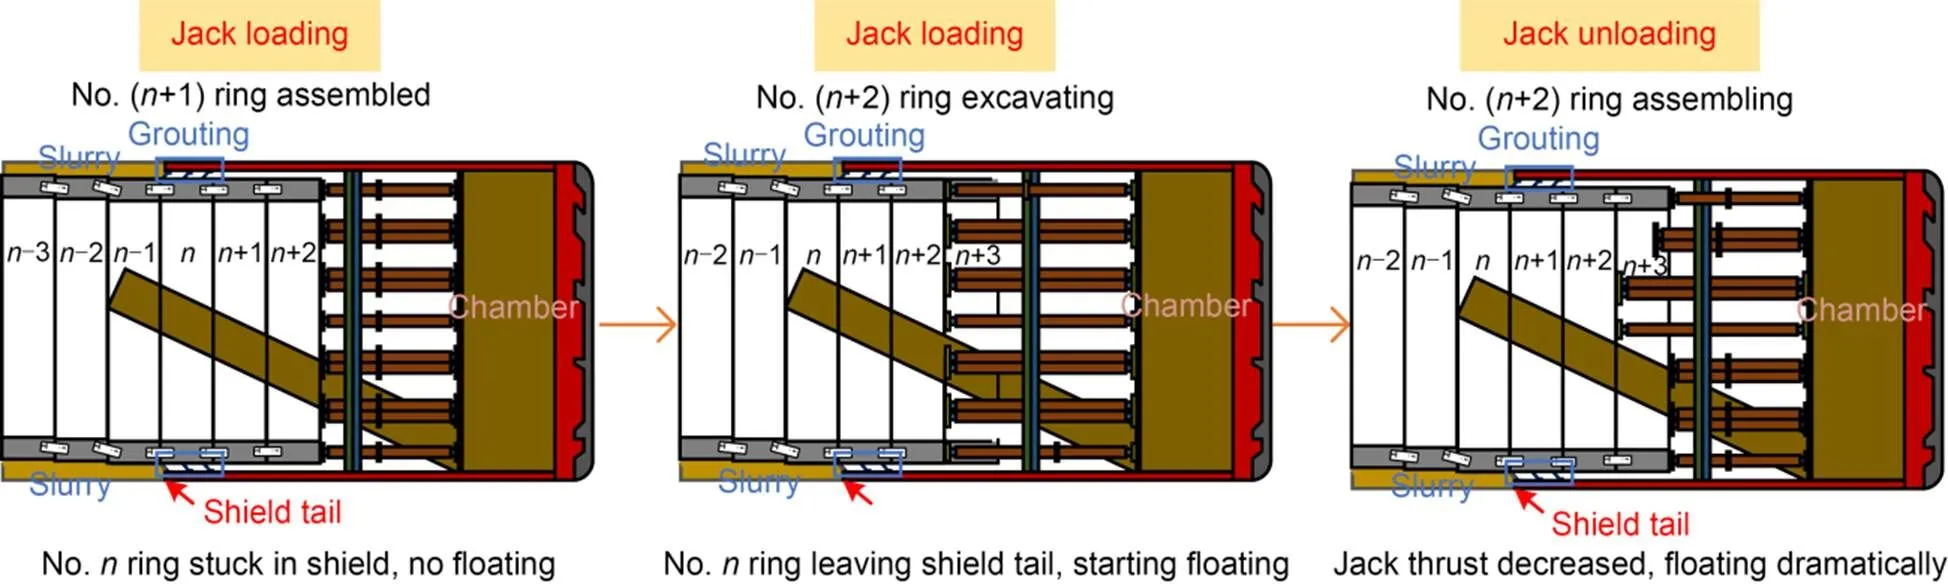
Fig. 5 Jack unloading
2.2.2Shield operation parameters
During tunnelling, synchronous grouting is carried out to play the roles of filling and supporting. The possible dynamic buoyancy generated by grouting pressure and static buoyancy generated by the slurry ring strengthen the upward movement trend of the tunnel lining. Wang et al. (2019) demonstrated that the type of slurry (sl), grout filling volume (G), and grout pressure (G) significantly impact the buoyancy of tunnel linings, consequently determining their upward displacement. These factors alter the external forces acting on the linings, then change the floating trend of tunnel lining. The chamber pressure (C) is the key factor to maintain the stability of the excavation face. Instability of the excavation face will lead to serious construction accidents and more severe soil disturbance. Thrust (T) is the main driving force for the advancement of the shield machine, and the torque (T) on the cutterhead is generated during tunneling. To keep the stability of the cutterhead, the torque should always match the variation of the face pressure and thrust. The penetration rate (P) represents the speed of soil excavation and affects the degree of soil disturbance. If the excavation speed is too fast, the torque will increase, affecting the stability of the excavation surface. Meanwhile, the tail void cannot be filled in time by grouting, which will greatly increase the upward displacement of the tunnel lining (Geng et al., 2021).
2.2.3Geological conditions
Different geological conditions will lead to different shapes of the tail void. The compression modulus (s) and standard penetration test (spt) of soil reflect the soil's resistance to deformation and the bearing capacity of the surrounding stratum. In addition, the stratum type (s), soil cohesion (), internal friction angle (), and water level (W) affect the stability of the surrounding stratum and determine the gravity of the overlying soil (G). The vertical permeability coefficient (v) of the stratum affects the distribution of slurry, which will alter the grouting pressure (Shu et al., 2017). These factors affect the upward displacement of tunnel linings by influencing the floating trend.
In summary, these factors contribute to the upward displacement of linings by affecting the floating space and floating trend. Fig. 6 shows how these factors affect the upward movement of the linings.
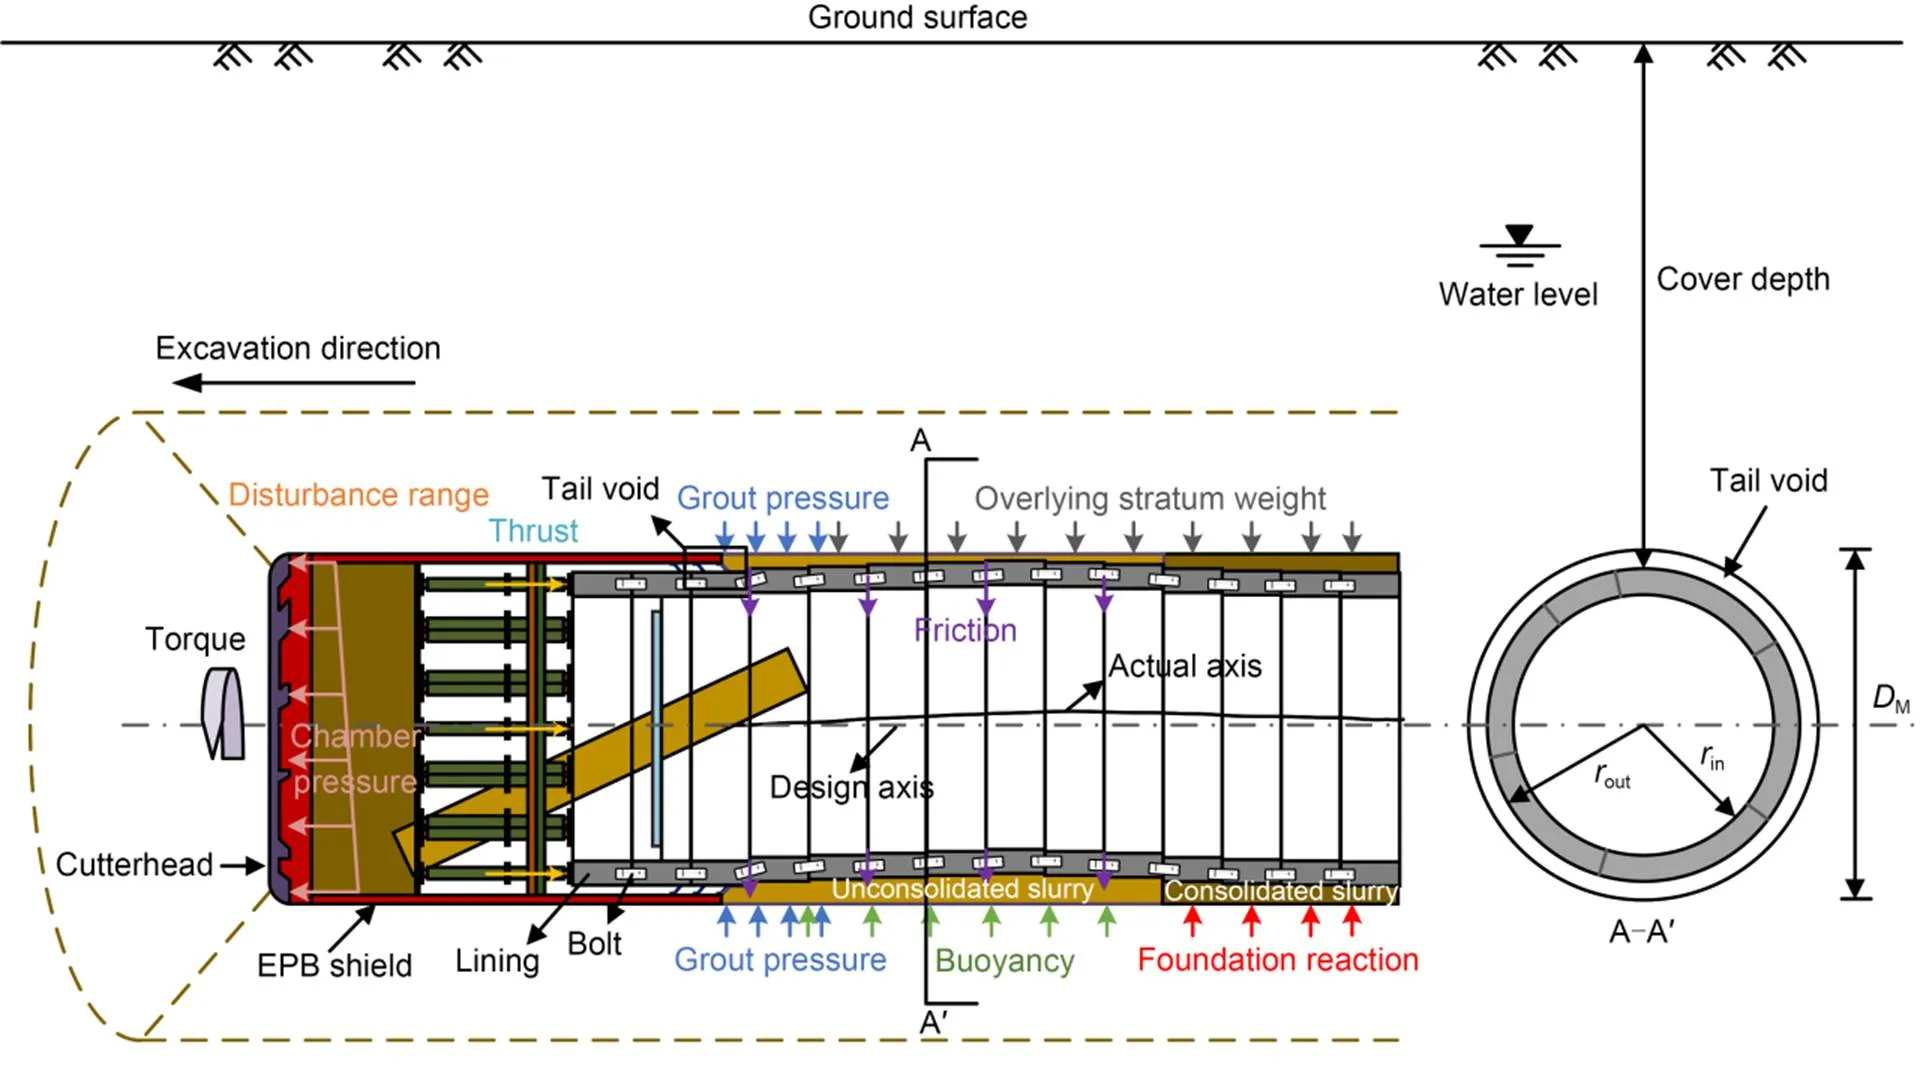
Fig. 6 Factors affecting the upward movement of a tunnel lining. rout is the outer radius of lining; rin is the inner radius of lining; EPB: earth pressure balance
3 Methodology
3.1 Random forest
The RF algorithm proposed by Breiman (2001) is an ensemble ML algorithm for classification and regression tasks which combines bagging and random feature selection (Ho, 1998). By bagging, a bootstrap setNis made by random sampling with replacementtimes from the training set, which is used to generate the decision tree. The remaining samples belong to the out-of-bag (OOB) sample, accounting for a third of the training set, which is used to evaluate the prediction performance of the decision tree. The number of samples and features in each bootstrap is arbitrary but typically smaller than the original training set. Thendecision trees are generated by the same method. Each decision tree classifies a bootstrap sample by evaluating its attributes at each node. Each node tests a specific attribute, and the leaves of the tree represent the output results. The final prediction of a decision tree is determined by aggregating the outputs from all its leaves, and the final output of the RF is obtained by calculating an average of all decision tree results (Fig. 8).
The bagging and random feature selection give the RF excellent performance in handling high dimensional data (many features) without feature selection by human experience. RF has more powerful learning performance and higher robustness with respect to noise data than other algorithms. The Gini index can be obtained during the process of training to record the weight of each variable and can be used to evaluate the relative importance of them (Lovatti et al., 2019).
The setting of hyper-parameters in advance before training plays an important role in the prediction performance of ML algorithms. The hyper-parameters of RF are the number of trees and random features at each node (Table 1). The default of ntree is 500; the default of mtry is calculated by Eq. (1). These default values are summarized based on experience, which is not suitable for all situations, so it is necessary to optimize the hyper-parameters to maximize prediction performance:
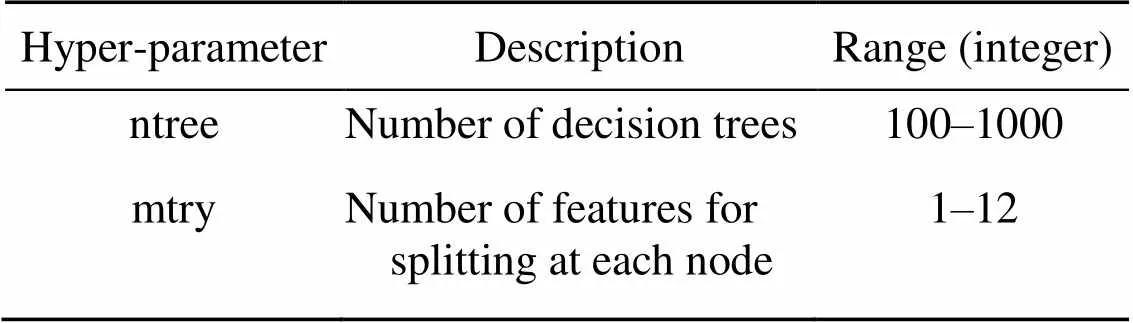
Table 1 Hyper-parameters in random forest
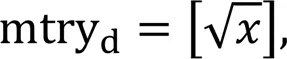
whereis the number of features of the dataset.
3.2 Particle swarm optimization
PSO, inspired by the bird predation behavior, has excellent optimization performance, characterized by high precision and rapid convergence speed (El-Gallad et al., 2002). The procedure of PSO algorithm is shown in Fig. 7. Each particle represents a potential solution and is associated with a fitness value determined by the fitness function. The direction and distance of a particle's movement are determined by its velocity. The velocity is dynamically adjusted according to its own movement experience and that of other particles. Movement toward the global best positions is based on the best local position and velocity, so as to realize the optimal solution. The velocityVand positionXof each particle are updated using the following equations:

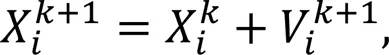
where1is the cognitive learning factor;2is the social learning factor;is the inertia weight;1and2are random numbers, distributed within the range [0, 1];is the current generation andis theth particle;Pis the current personal best location of theth particle;gis the best global location among all particles.
In this study, there were two hyper-parameters of RF to be optimized, soPis a two-dimensional variable, and the range of hyper-parameters constitutes the motion space of the particles. When the fitness converges at a constant value, or up to the maximum generation (set as the termination criterion), at this timegrepresents the optimal hyper-parameters of the RF algorithm. Generally, the maximum generation is set as 100, which is enough to find the optimal solution (Zhang et al., 2019).
3.3 K-fold cross-validation
Establishing an ML model requires three stages: training, validation, and testing. The training of the model involves continuously mining the training set to adjust the model parameters, trying to find the potential relationship between the input parameters and output parameter. Model validation involves retaining a portion of independent data from the training set to validate the reliability of the training process, avoiding over- or under-fitting issues during training. Testing of the model involves using a test set not involved in training to test the prediction performance and evaluate the generalization performance of the prediction model.
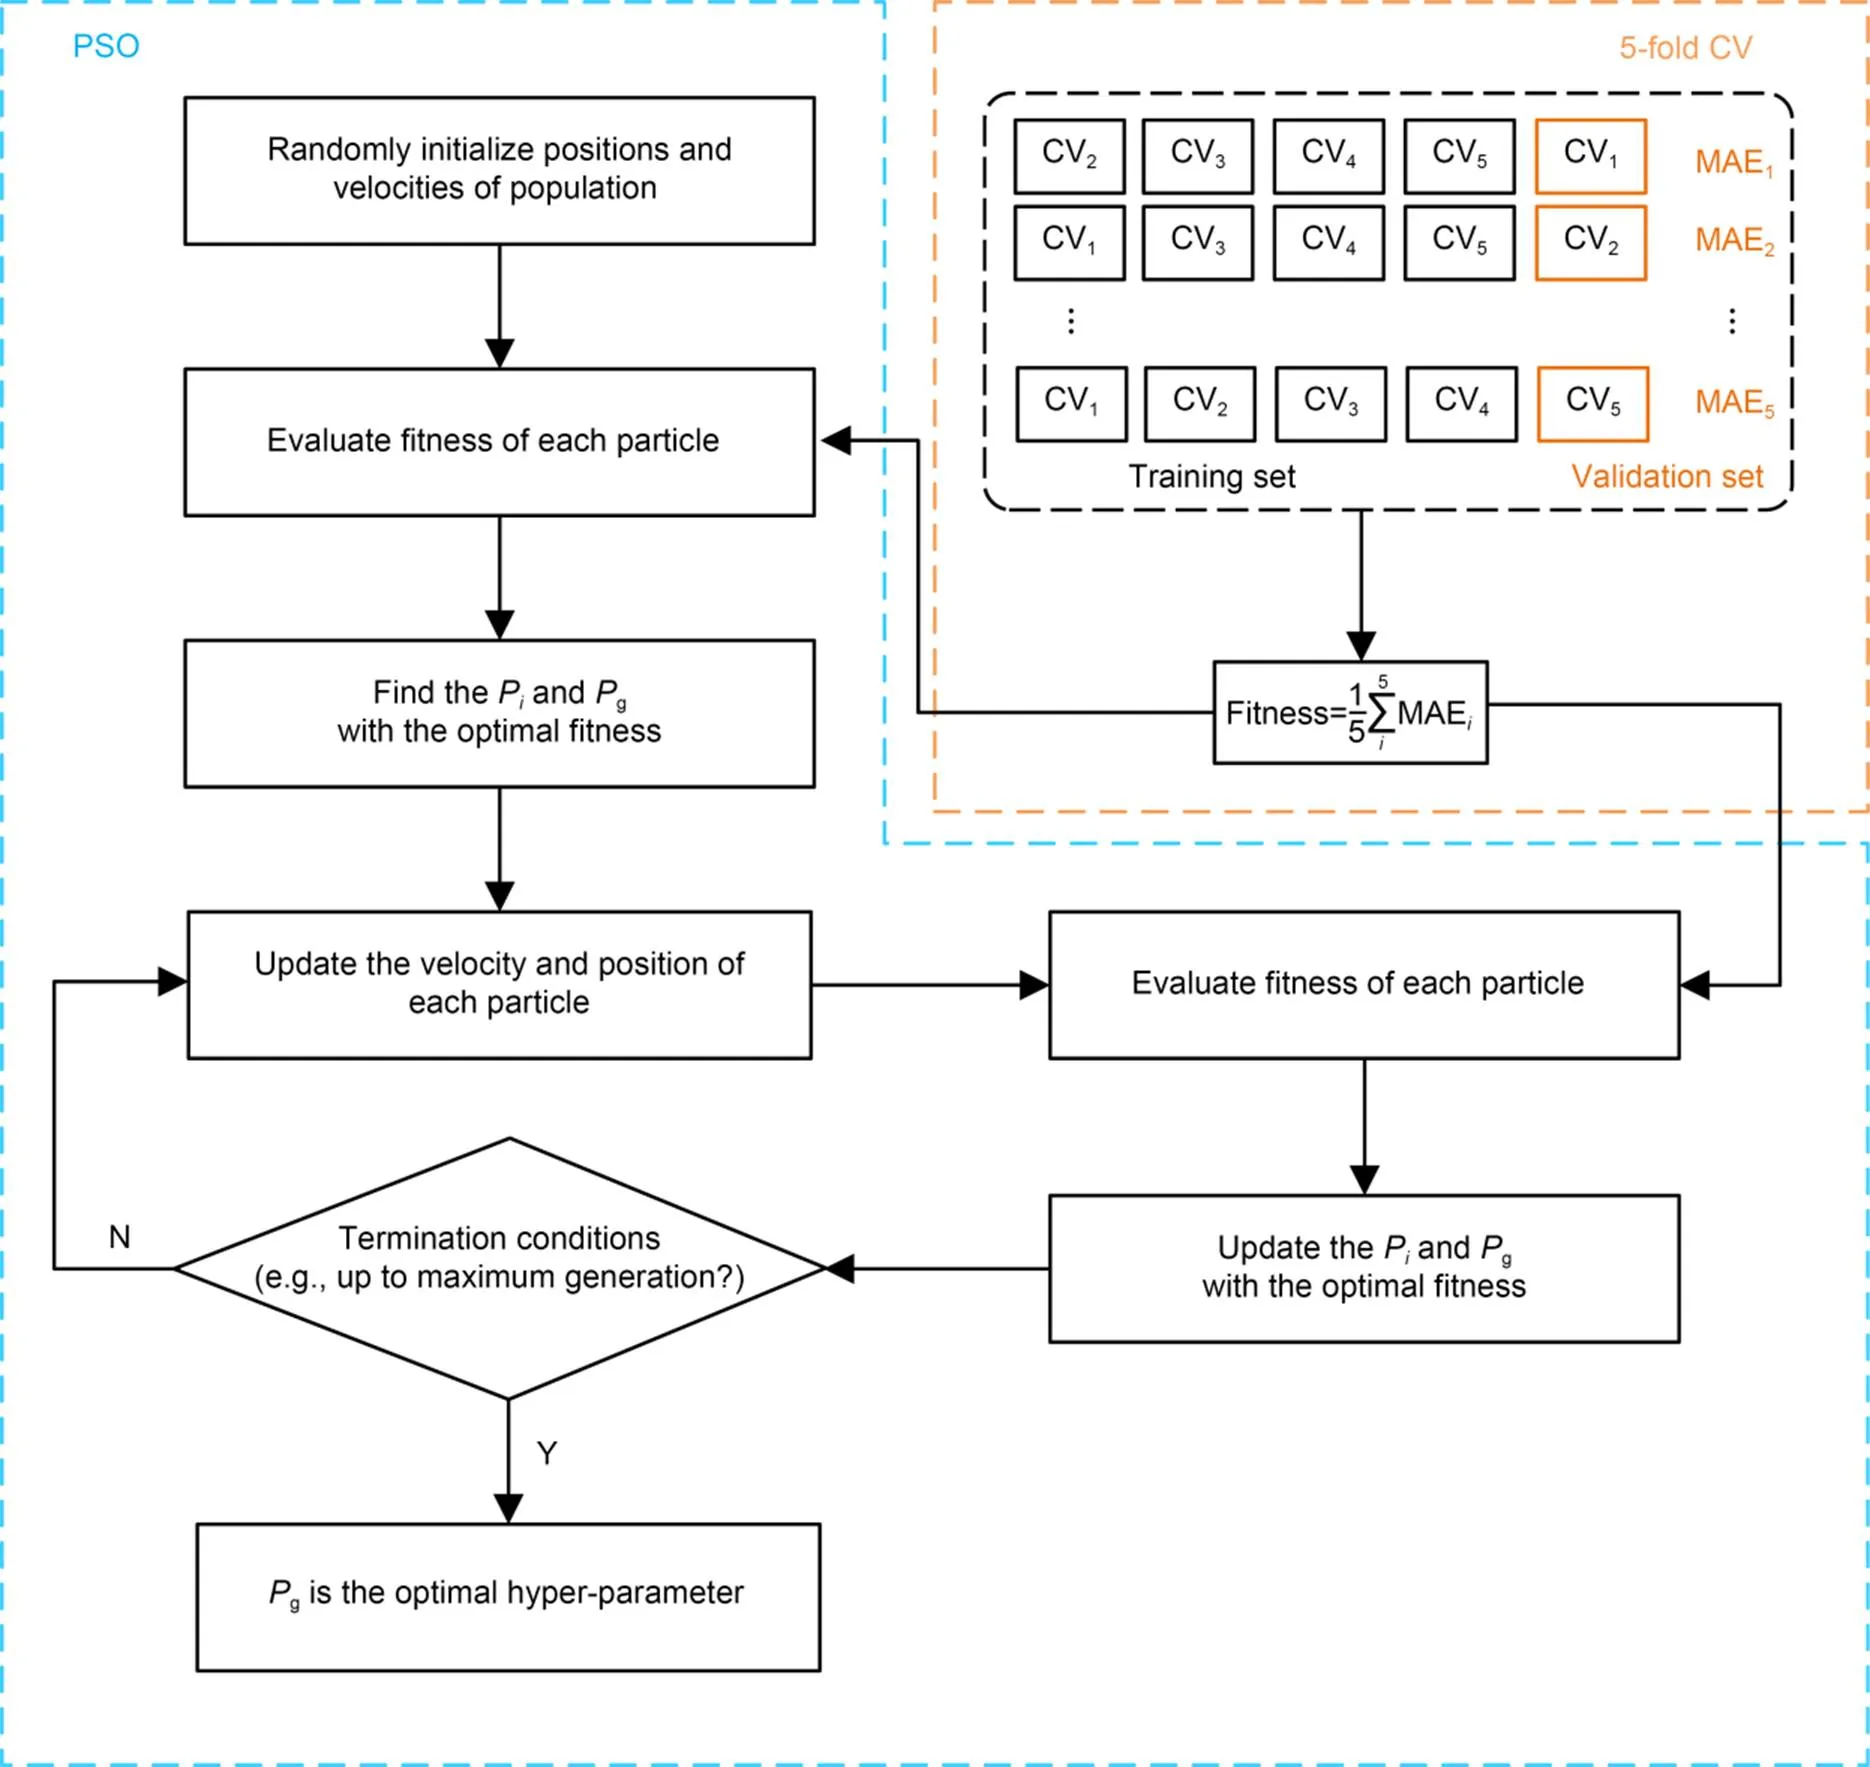
Fig. 7 Flowchart of PSO and 5-fold CV hybrid optimization algorithm
In this study, 80% data were used as the training set, while the remaining 20% as the test set. The validation set was selected using the-fold CV method.
The-fold CV randomly divides the original training set intosub-datasets, among them-1 sub-datasets are used as the new training set and a remaining dataset as the new test set. The process repeatstimes, and the performance of model is assessed by calculating the mean prediction error across thesub-datasets. The-fold CV can effectively reduce the effect of selection of different amounts of data on model prediction performance. Previous study has recommended setting the value ofas 5 (Wang et al., 2013).
3.4 Hybrid algorithms
Building an excellent prediction model using ML algorithms is like using a black box. Meng et al. (2021), Yang et al. (2021), and Zhang et al. (2022b) proposed a method to enhance the generalization ability of prediction models by incorporating prior information or uncertainty. Raissi et al. (2019) and Zhang et al. (2022a) showed that this method needs huge datasets to train the model to obtain excellent performance. Because practical engineering lacks the amount of interpretable data needed to train the prediction model, we proposed using-fold CV to fully train the model based on the finite dataset.
In this study, we proposed a hybrid algorithm which combines the PSO algorithm and-fold CV, considering the characteristics of high efficiency and strong optimization performance of the PSO algorithm, and the advantages of CV. This hybrid algorithm can effectively avoid the problem of over- or under-fitting in optimization and improve the robustness and generalization of prediction models. The principle of the hybrid algorithm is to use the prediction mean absolute error of CV as the fitness function of PSO algorithms, as shown in Eq. (4):
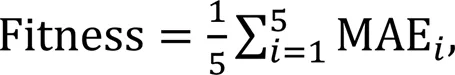
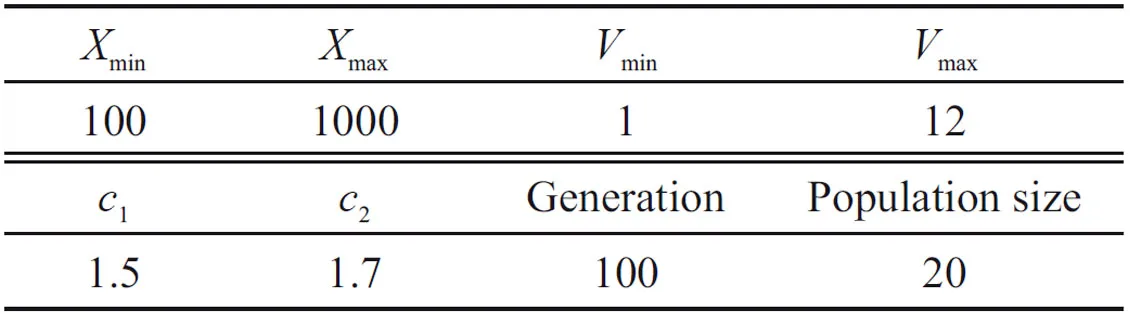
Table 2 Parameters of the algorithm PSO-CV-RF
3.5 Performance indicators
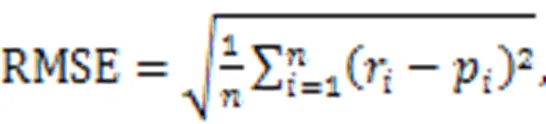
The MAE, RMSE, and2were used to evaluate the prediction performance of the hybrid ML algorithm proposed above. RMSE and MAE can directly reflect the prediction error, with lower values representing better performance. The outliers have more influence on the RMSE than on the MAE.2reflects the correlation between the predicted result and the actual result, with a range from 0 to 1, where 1 depicts a perfect and precise fit to the actual result and 0 depicts the worst fit with no accurate prediction. They are defined as follows (Ding et al., 2023a, 2023b):


4 Proposed prediction model
4.1 Prediction model framework
A flowchart showing the establishment of the model to predict the upward displacement of tunnel linings using the RF-PSO algorithm is shown in Fig. 8. There are three phases: dataset preprocessing, training model, and testing model. There are 321 rows of data, including 12 input features (influencing factors) and one output variable (the maximum upward displacement of lining). We select 80% of data randomly as the training data to train the model and the remaining 20% form the testing data for testing and validating the prediction performance. During the training, the PSO-CV is used to optimize the optimal hyper-parameter of the RF.
4.2 Data source
The data were collected from a metro project in Shaoxing, located in the southeast of China within a soft soil area. The total length of the tunnel is 1847.3 m, and the cover depth varies from 8.7 to 21.0 m, with a cover depth of 16.7 m at the beginning of the Jinghu Station section and 8.7 m at the end of the Houshu Road Station section. The shield tunnel was excavated using an earth pressure balance (EPB) shield machine. The shield operational parameters were collected per minute by the shield machine data acquisition system. The tunnel linings are made up of six precast concrete segments with an outer diameter of 6.7 m, and an inner diameter of 5.9 m. The width of each lining is 1.2 m. The upward displacement of each lining was measured by liquid level sensors and the ultimate displacement was calculated by the final measured value about 72 h after the segments were assembled. Xu et al. (2003) demonstrated that it typically takes approximately 30 to 48 h for the tunnel lining to reach its maximum upward displacement. The geological distribution of the project is shown in Fig. 9. There are some typical soft soils around the tunnel, such as silty soil, silty clay with silt, and muddy clay. They have very poor engineering properties with high compressibility, low strength, low permeability, and high sensitivity. Under the influence of shield tunneling, the soil structure is prone to damage, leading to the displacement of tunnel segments and the settlement of the surface stratum.
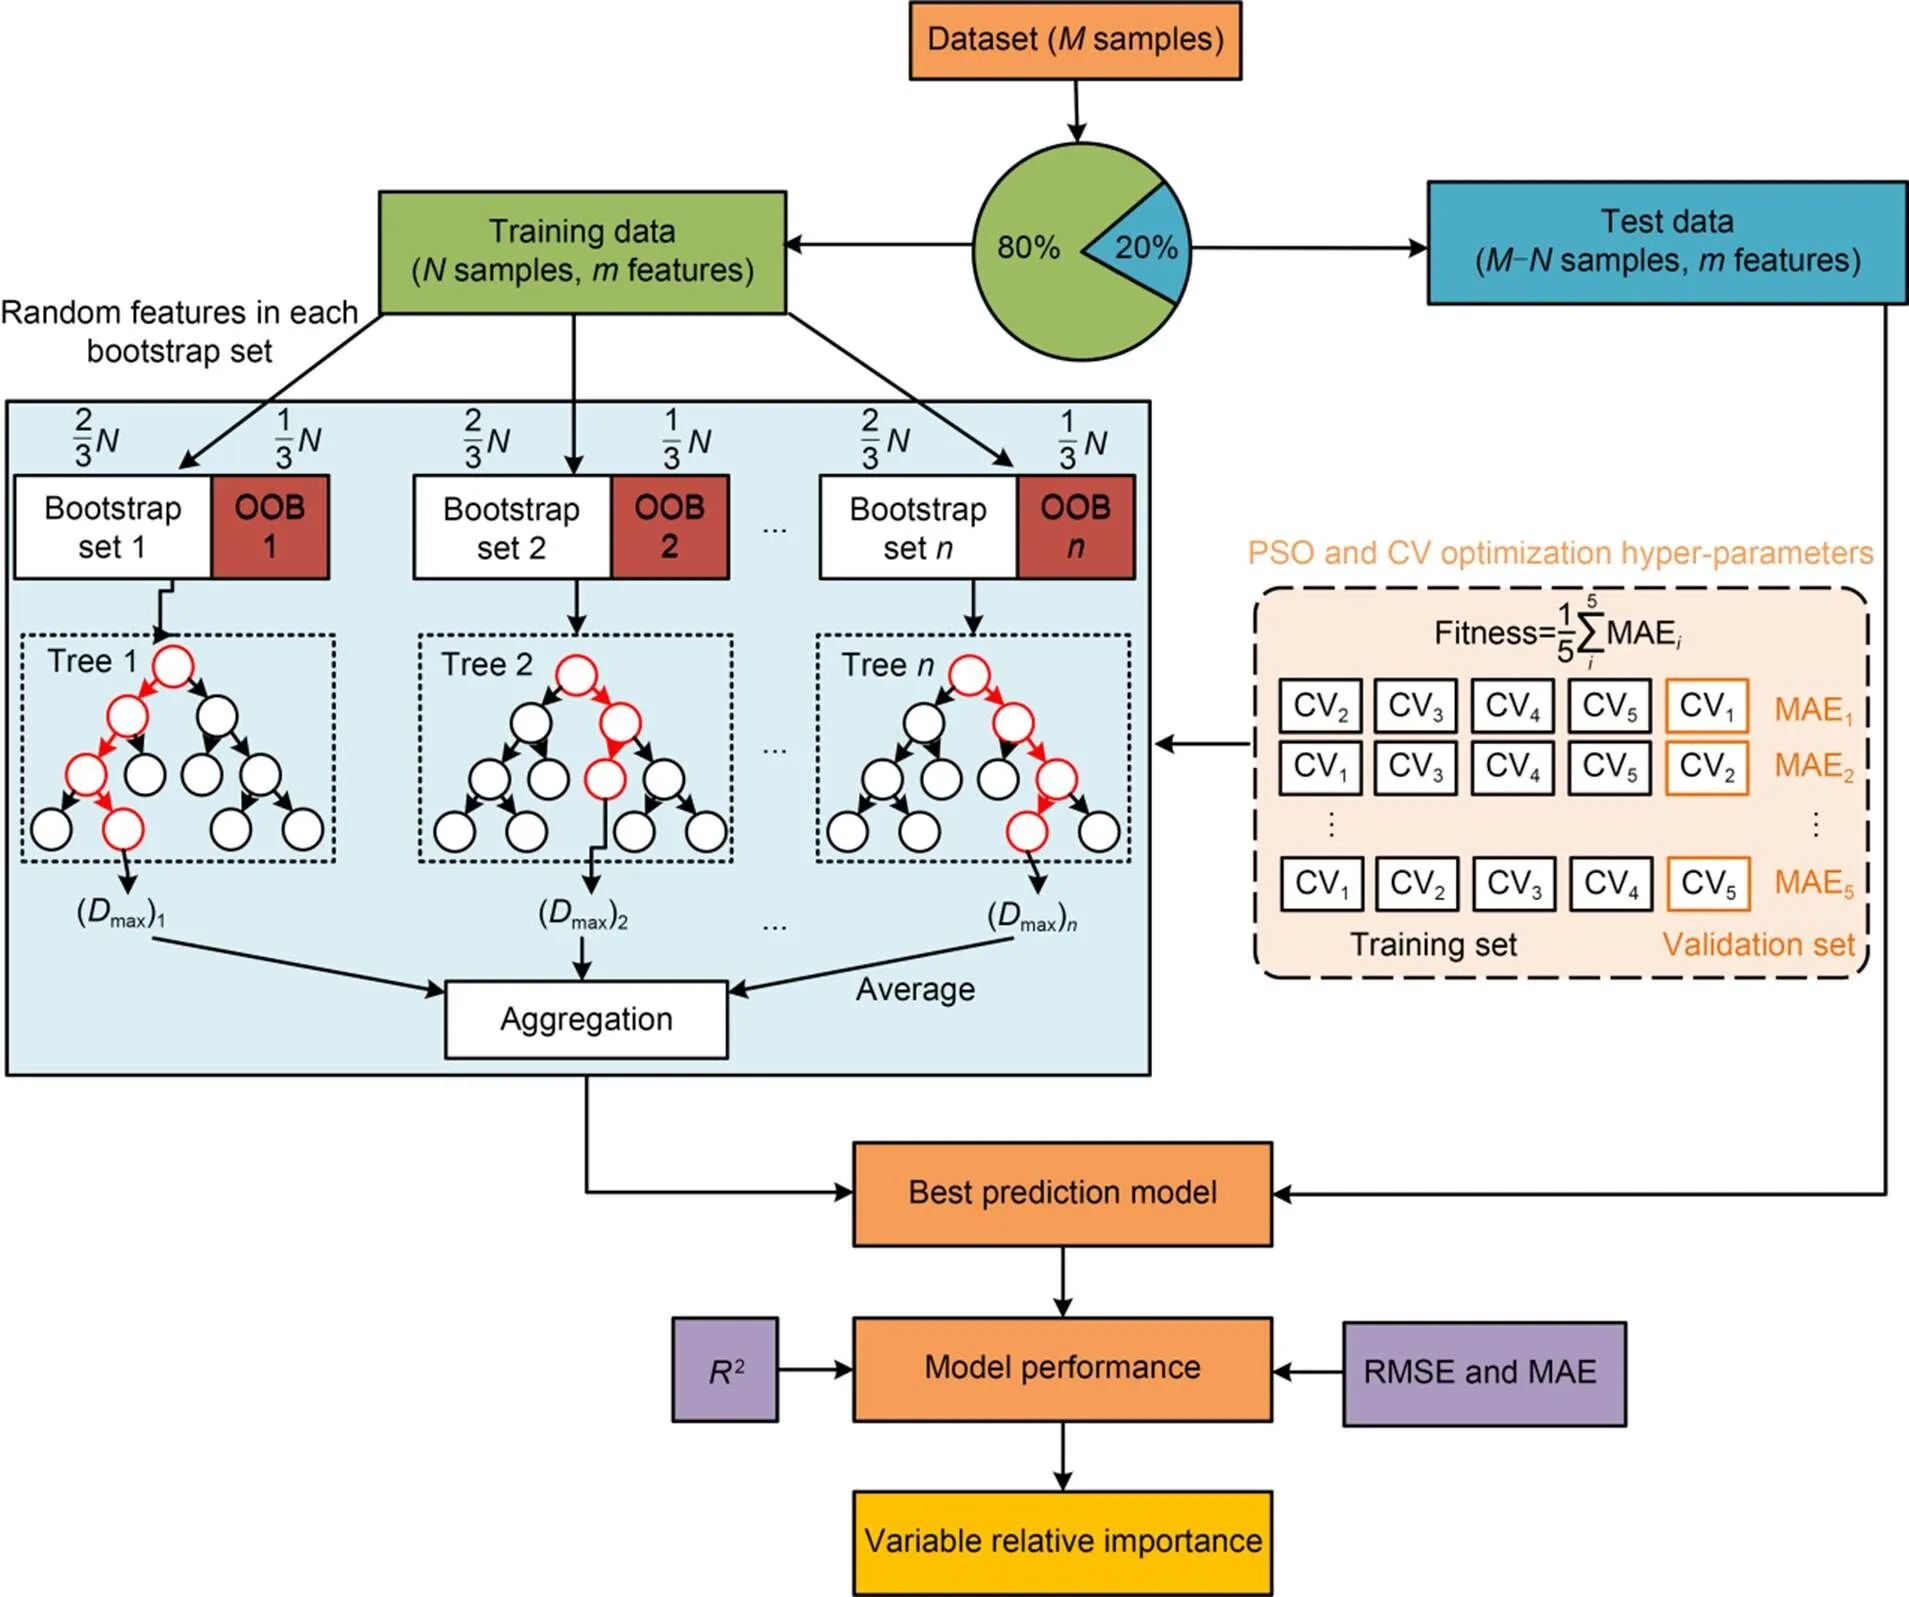
Fig. 8 Flowchart of upward displacement prediction model using PSO-RF. Dmax: maximum displacement
4.3 Data selection
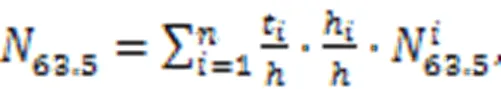
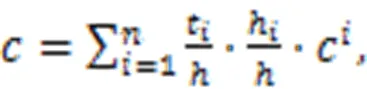
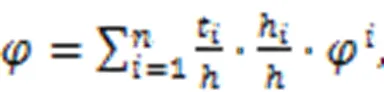
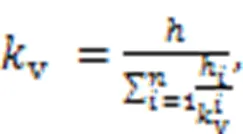
Input variables were selected from the key factors influencing upward movement of the tunnel lining, which were analyzed in Section 2.2. Since the tunnel was usually excavated using the same shield machine, the shape () and diameter (L) of the linings, the re-tightening force of bolt (P) and stiffness (L) of the bolts were unchanged. The only varied geometric factor was the cover depth of the tunnel (C), which would be chosen as the input variable. All shield operation parameters and geological parameters were considered as input variables, with the exception of the slurry type (sl), which remained constant throughout the project. In addition, the upward displacement of each lining is subjected to the operational parameters of the whole excavation period, so the final operating parameters were calculated from the average values for each lining (excluding the first 10% of the maximum and minimum to eliminate the influence of missing and noisy data). Xu et al. (2003) showed that the range of soil disturbance induced by tunnelling is 1.5–3.5(whereis the radius of the lining). In this study, we chose 10 m as the range of disturbance. The geological parameters are calculated by Eqs. (8)–(11), considering the stratum in the range of disturbance. The equations account for the influence of the position of the stratum, which is similar to the findings of Chen et al. (2019). The modified parameter is most influenced by the nearest soil layer, while the influence gradually decreases for the farther soil layers, with the farthest soil layer having the least impact (Fig. 10).
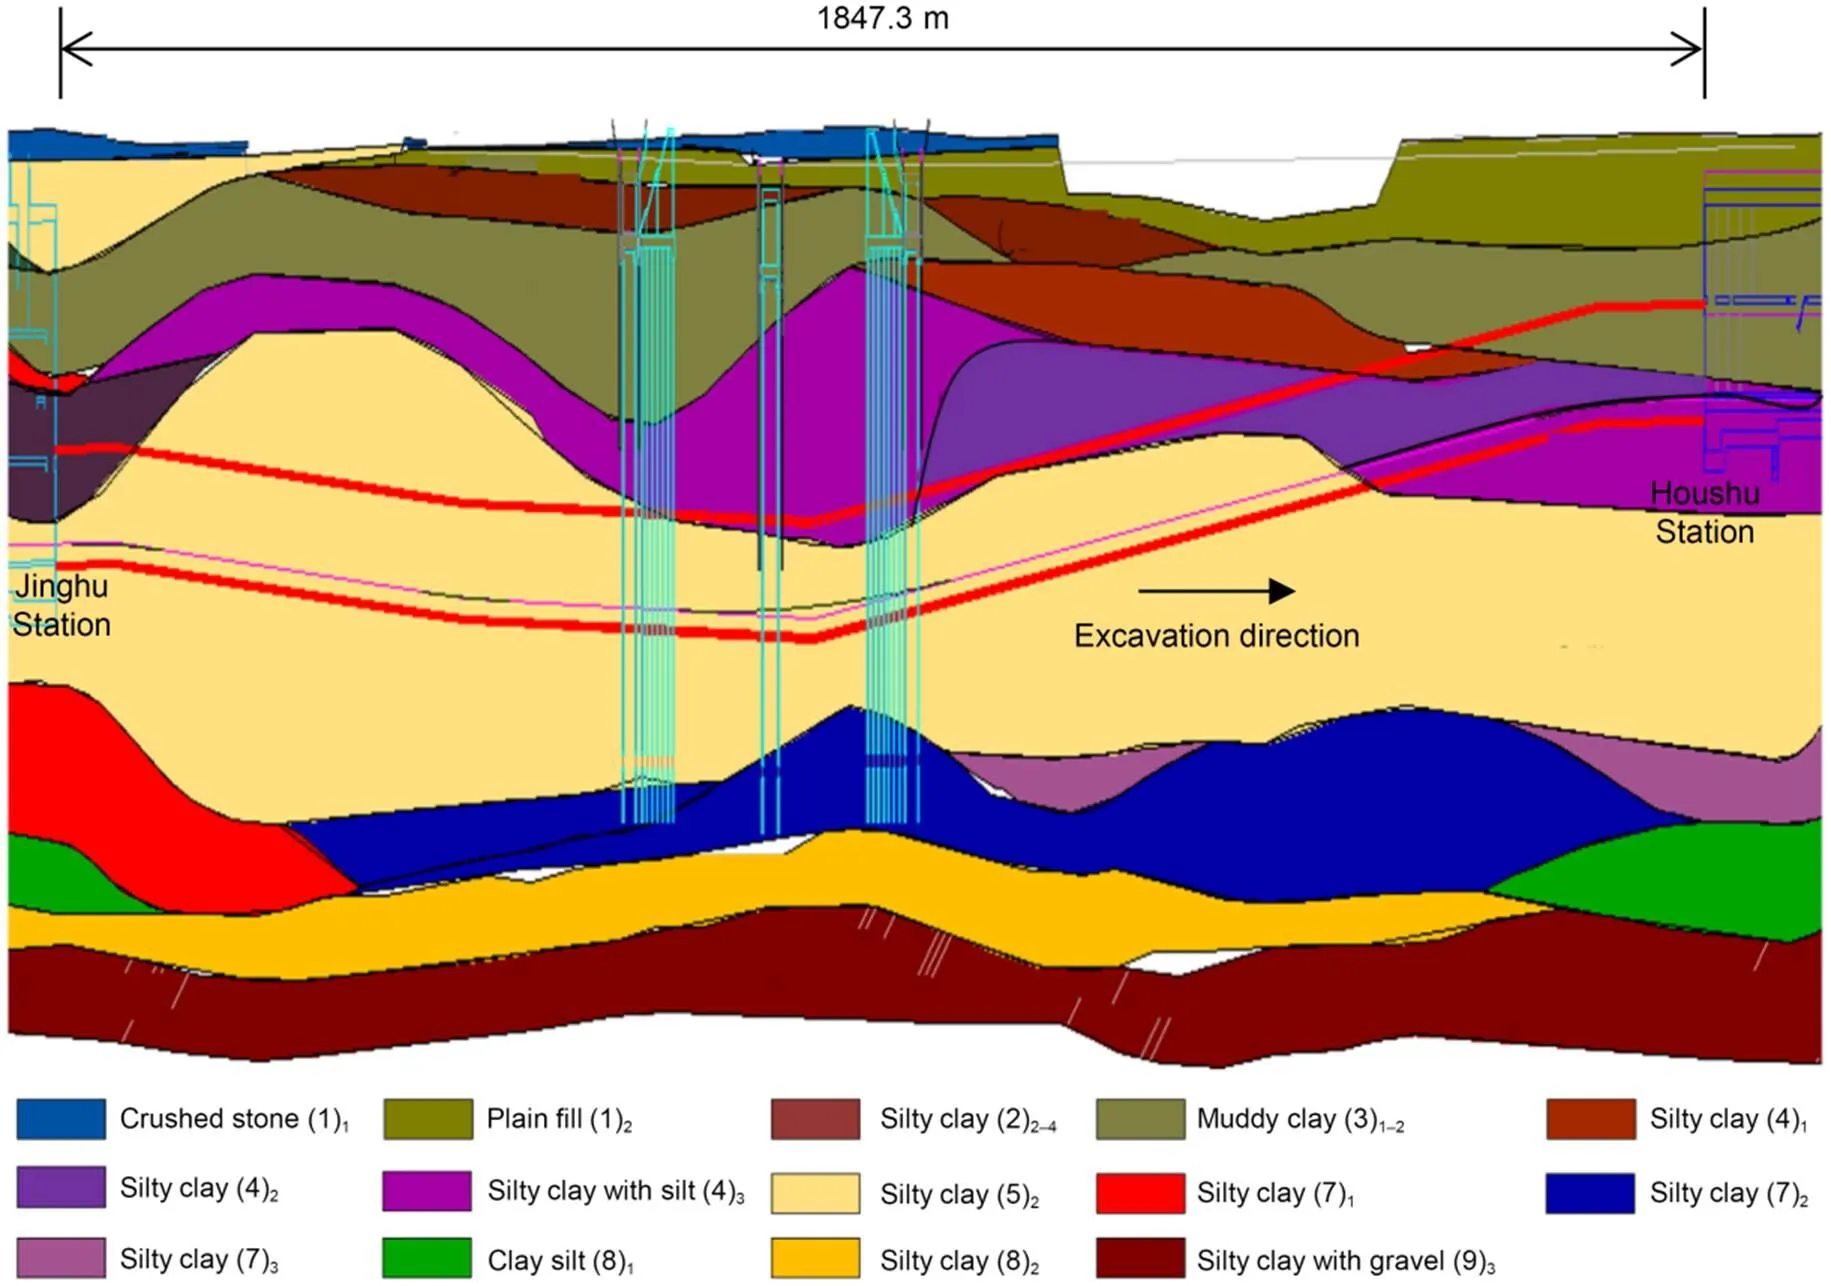
Fig. 9 Geological distribution of the project. References to color refer to the online version of this figure
4.4 Data analysis
The basic statistical parameters of the 12 input parameters and the output parameter are shown in Table 3. The upward displacement of different linings varied dramatically from 23.6 to 122.5 mm, which makes accurate prediction of the upward displacement very challenging. The data analysis diagram is shown in Fig. 11. The bottom left corner shows the data distribution diagram, while the value in the top right corner is the linear correlation (Pearson coefficient) between the variables. The last column of data represents the linear correlation between all input variables and the upward displacement of the linings, where their absolute values are less than 0.4. It is clear thatT,,C, andvare the parameters most relevant to upward displacement. Among these, thrust (T), soil cohesion (), and cover depth of the tunnel (C) were negatively correlated with the upward displacement, which suggests that increasing these factors will effectively decrease the displacement, while the permeability coefficient (v) was positively correlated with the upward displacement. Overall, there was no simple linear relationship between the 12 influencing factors and the upward displacement of the tunnel lining.
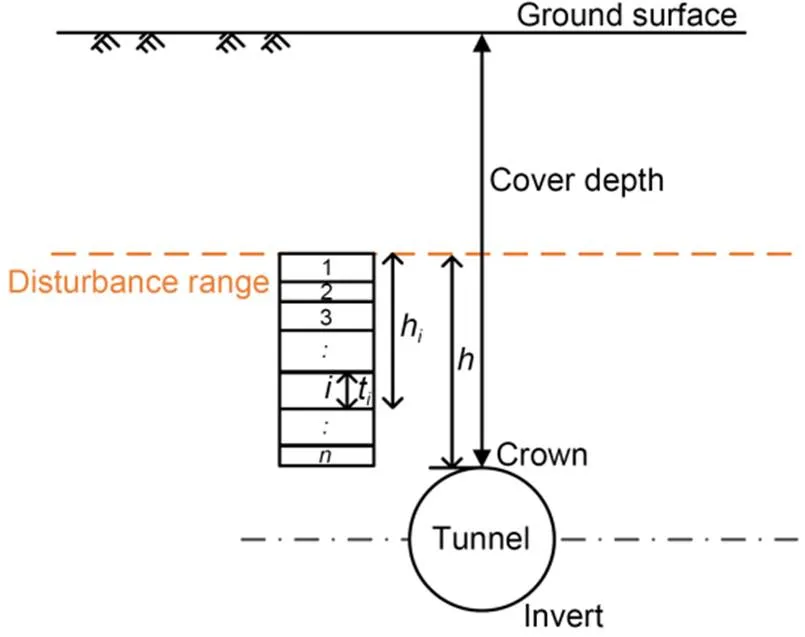
Fig. 10 Schematic view of the soil stratum
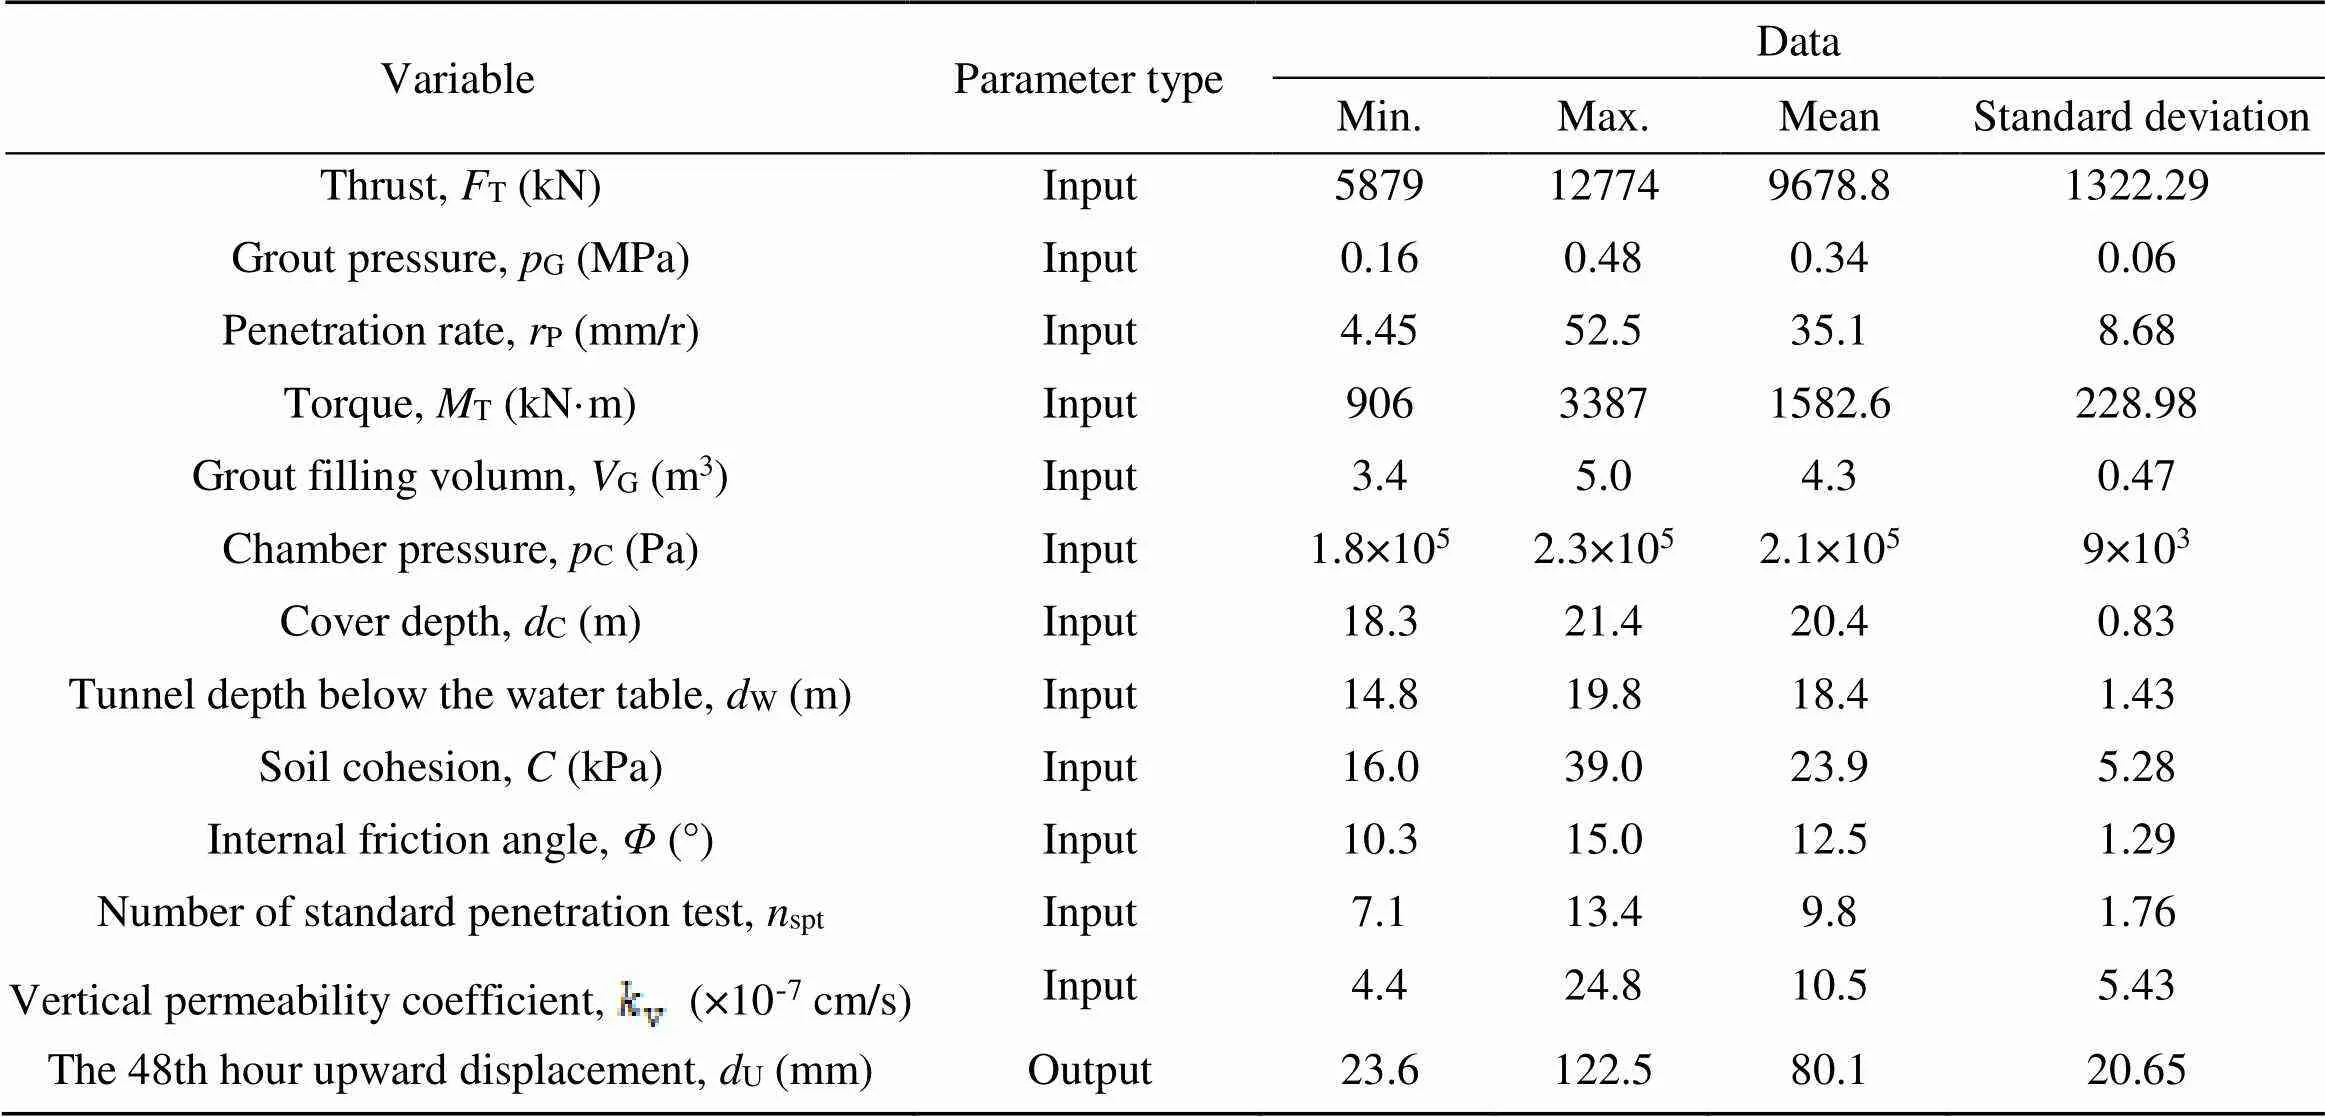
Table 3 Range of input and output variables (321 data sets)
A normalization algorithm is employed to mitigate the impact of parameters with varying orders of magnitude on the model's prediction performance. The database is mapped to the interval [-1, 1] by

The boxplot in Fig. 12 illustrates the normalization results and data division result between the test set and training set. The similarity between the distributions of all input parameters in the training set and the test set confirms the reliability of the random division process.
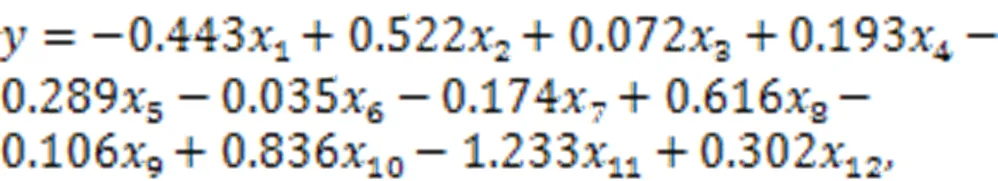
Multiple linear regression was used to predict the upward displacement of the tunnel linings based on the normalization dataset. The prediction result is shown in Eq. (12) and Fig. 13. The MAE and RMSE of the upward displacement predicted by simple linear regression were very large, up to 12.76 and 15.47 mm, respectively. The correlation (2) between the predicted upward displacement and the actual result was poor, only 0.523. The error of the training set was also large with a poor correlation, which indicates the potential relationship of the variables is not fully revealed by linear regression. Therefore, multiple linear regression is unreliable for predicting segment floating. These results verified that there is no simple linear relationship between the influencing factors and segment floating, so it was necessary to train the prediction model using an ML algorithm:
5 Results and discussion
5.1 Optimization result
The combination of PSO and 5-fold CV was applied to obtain the hyper-parameters of the RF. The optimization result of the PSO-RF is shown in Fig. 14. The average fitness of each generation changes, which shows that the particles are dynamically adjusted during the optimization process. The best fitness remained unchanged after the 40th generation, which indicates that the algorithm had found the best hyper-parameters. The optimal hyper-parameters ntree and mtry of the RF were 828 and 2, respectively.
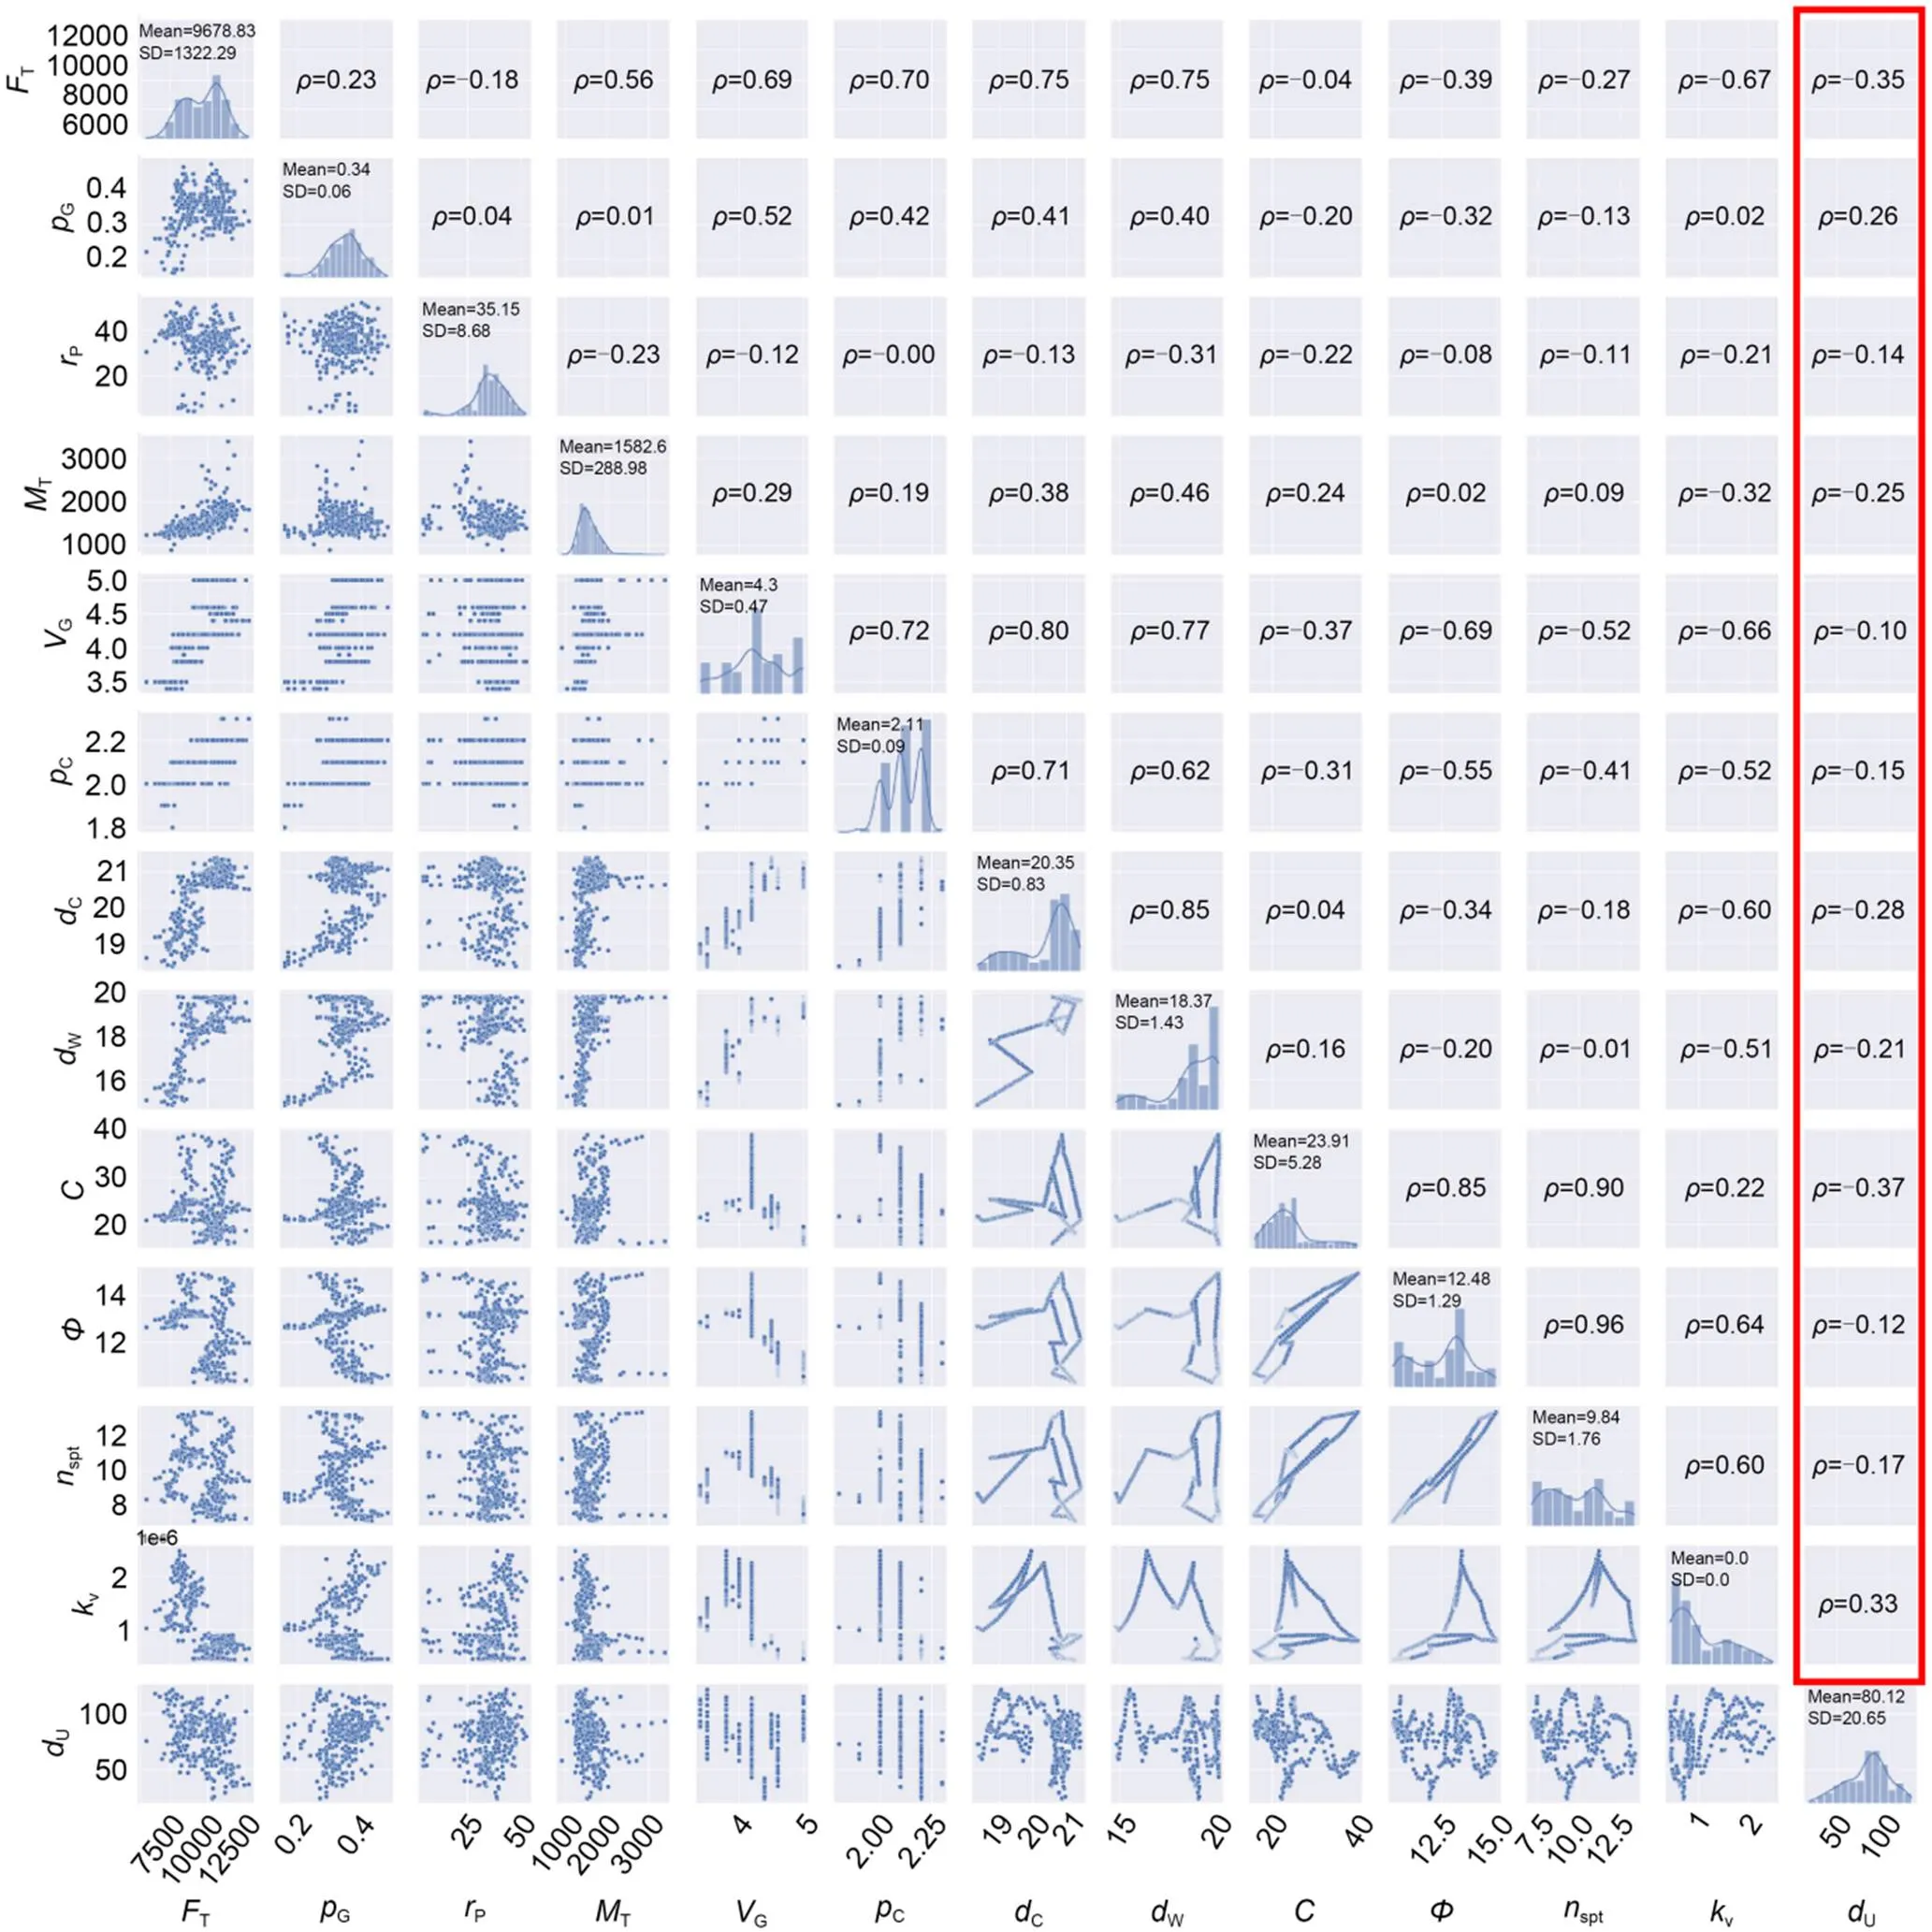
Fig. 11 Data analysis diagram (bottom left corner: data distribution; top right corner: Pearson coefficient ρ; SD: standard deviation)
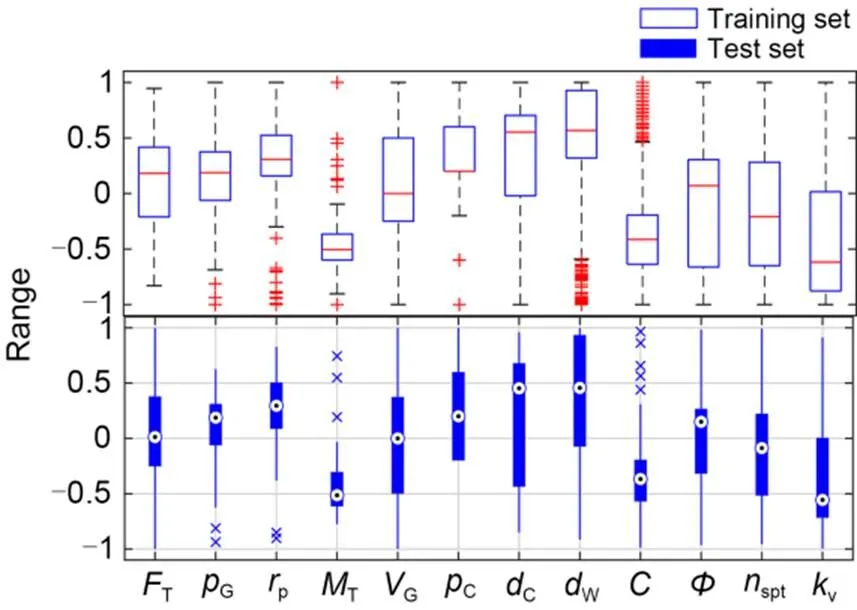
Fig. 12 Distribution of the training set and test set data
5.2 Prediction performance
Two prediction models (one with the optimal hyper-parameters, and the other with default hyper-parameters) were established to predict the maximum upward displacement of tunnel linings. The predicted performance of PSO-RF and RF (default) was compared by marginal histograms (Fig. 15). The scatter plot and histogram in the marginal histogram depict the scatter and frequency distributions of the predicted and measured upward displacements. Note that the histogram of predicted displacement is similar to that of measured displacement in both models. However, the scatter points are closer to the diagonal line in the PSO-RF, which indicates that the predicted upward displacement is more similar to the measured displacement in the PSO-RF model than in the RF (default) model.
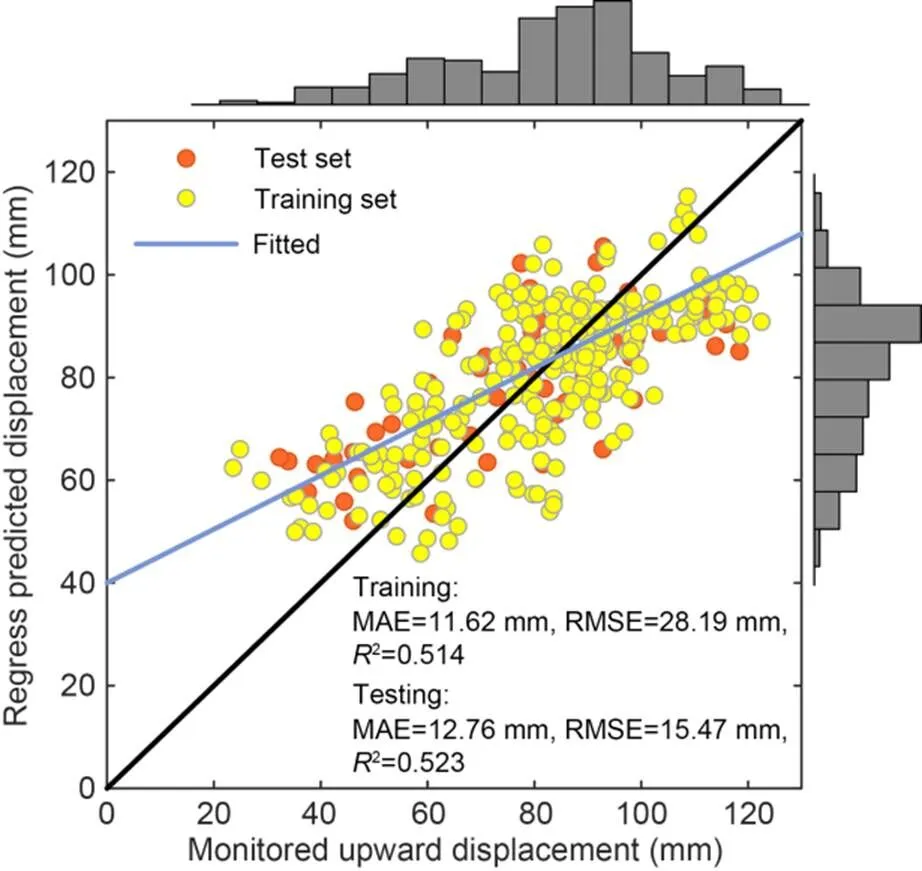
Fig. 13 Prediction result of multiple linear regression
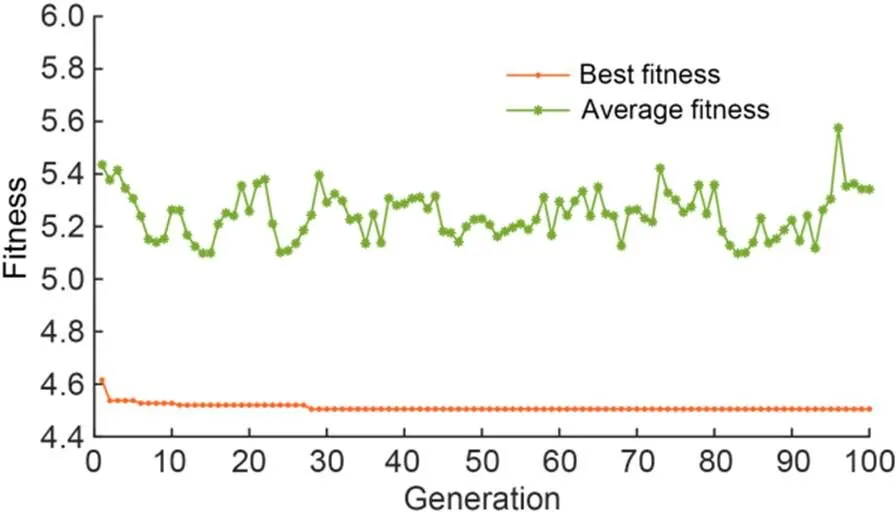
Fig. 14 Optimization process of the PSO-RF
In the training set of both prediction models, the MAE and RMSE were 0, and the correlation2was up to 1, which means that they have been fully trained and successfully obtained the potential relationships among the variables. However, they had different prediction performances in the test set to which they had not previously been applied. In the test set, the MAE and RMSE of the PSO-RF model were only 4.04 and 5.67 mm, while they were 5.12 and 8.41 mm, respectively, in the RF (default) model. The correlation (2) between the prediction results and measured results was up to 0.915 in the PSO-RF model compared with 0.814 in the RF (default) model. These indicators demonstrate that the PSO-RF model has better prediction performance than the traditional RF algorithm without the optimization algorithm and that the hybrid optimization algorithm can improve the prediction performance effectively.
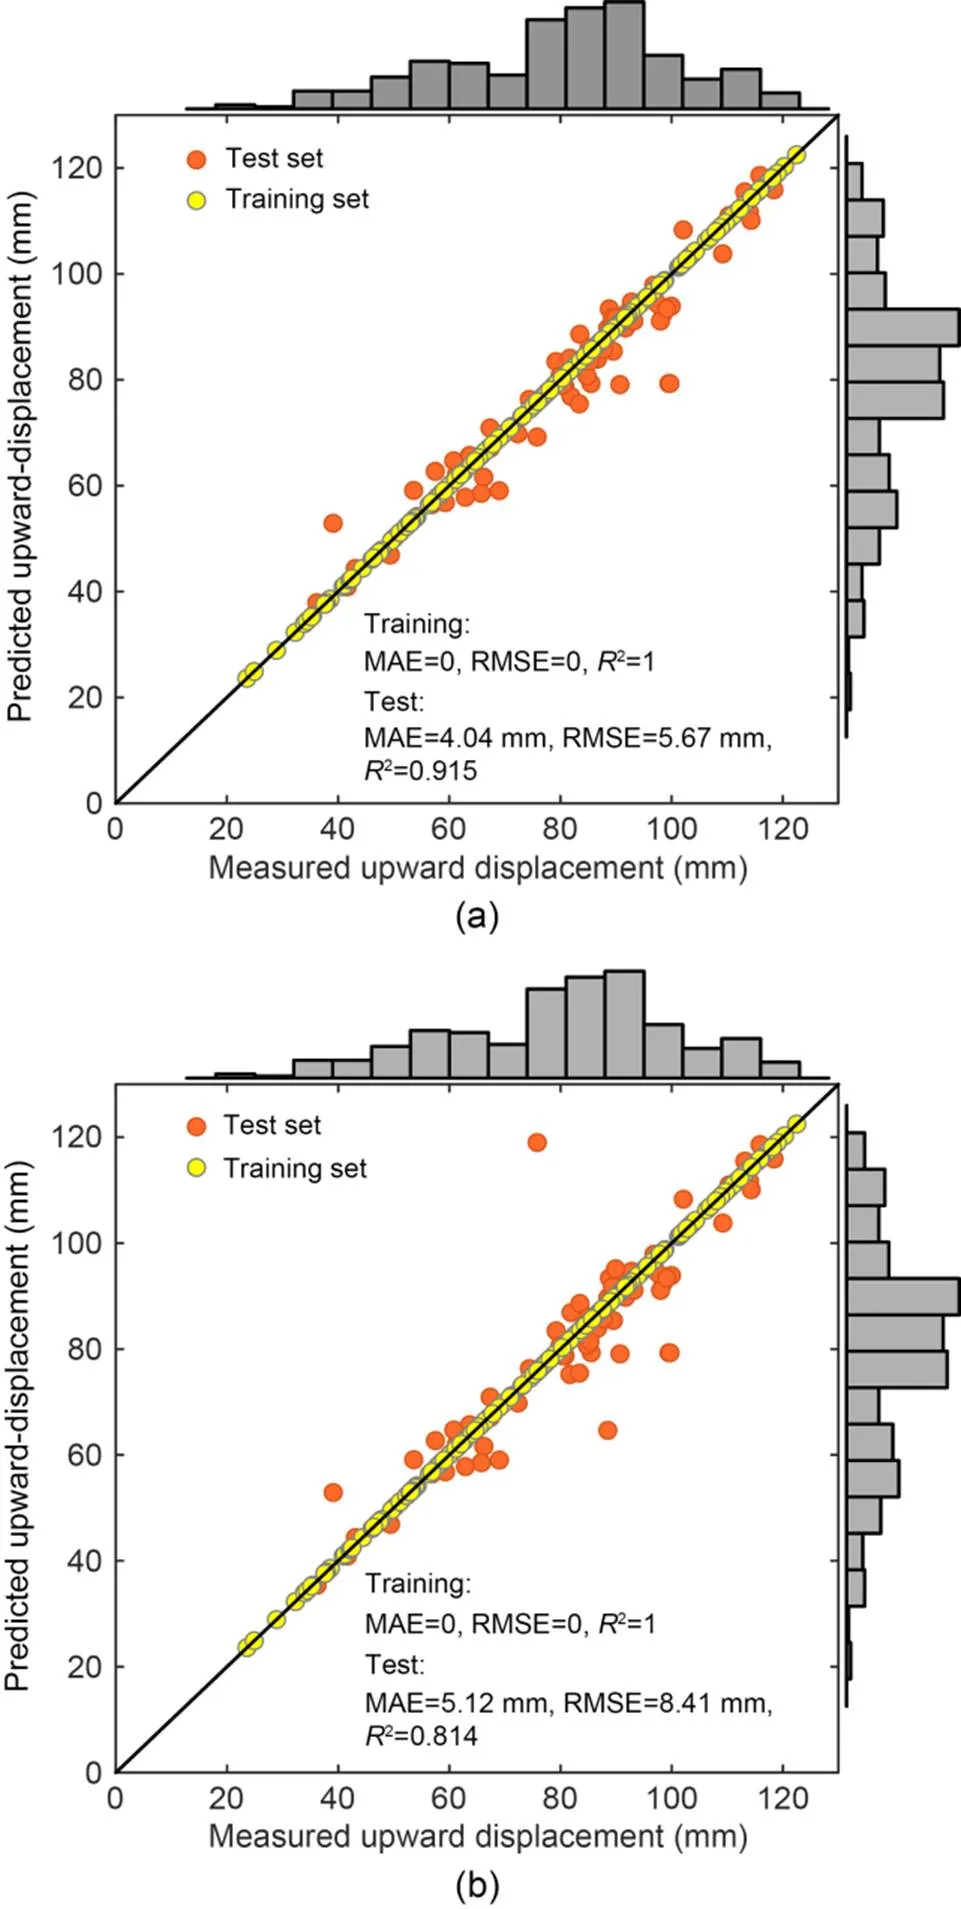
Fig. 15 Predicted performance of the PSO-RF (a) and RF (default) (b) models
The error frequency distribution of the PSO-RF model fitted with a normal distribution curve is shown in Fig. 16. The mean error valueand the standard deviationof the normal distribution curve were 1.54 and 5.51 mm, respectively. The prediction errors of the PSO-RF model were concentrated within -2 to 2 mm, which indicates the model has excellent prediction performance.
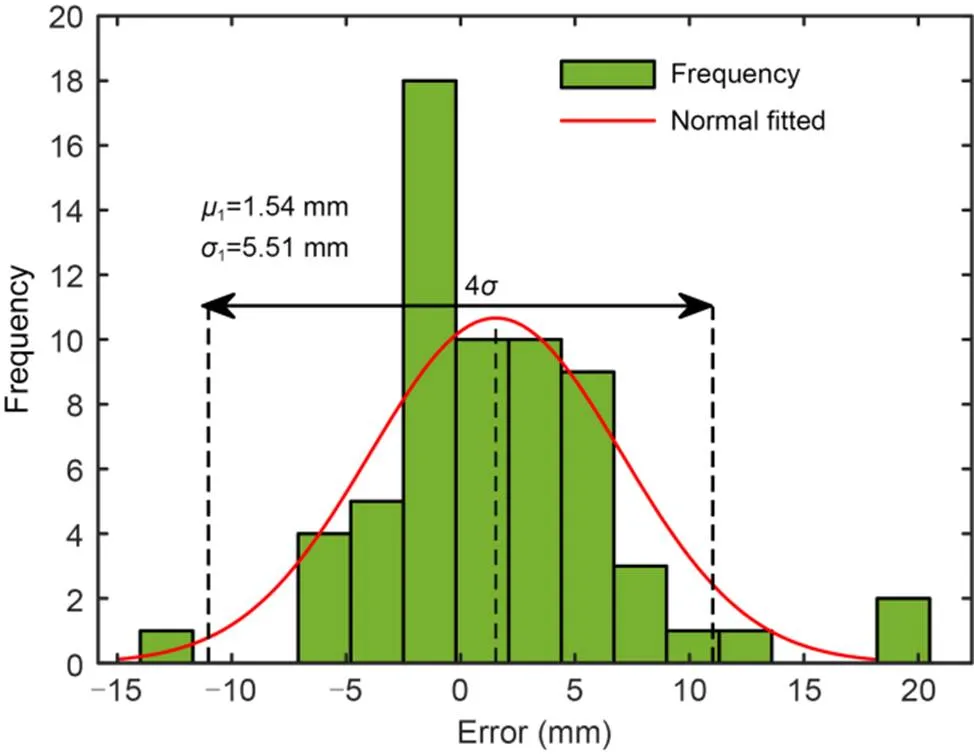
Fig. 16 Error frequency distribution plots of the PSO-RF
The predicted maximum upward displacement of both models based on the test set is shown in Fig. 17. The predicted displacements of the PSO-RF model are closer to those of the measured displacement than those of the RF (default) model, and the PSO-RF prediction model accurately predicts the maximum of upward displacement in various rings of the test set. Therefore, the PSO-RF model can be used to predict the final displacement of new-built linings or new projects, which can assist to optimize the design of the tunnel.
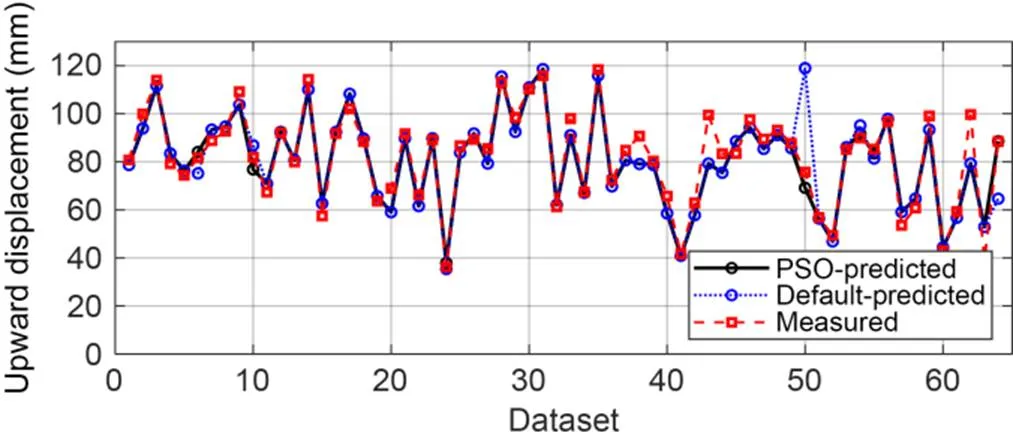
Fig. 17 Maximum upward displacement predicted by the PSO-RF
5.3 Analysis of relative importance of factors
The Gini value can be obtained during the process of training to record the weight of each variable, which represents the relative importance of the influencing factors. The rank of the Gini values is shown in Fig. 18. The most important factors influencing tunnel lining floating were thrust, followed by depth of tunnel, permeability coefficient and soil cohesion, which conforms with the practical condition and the analysis results in Section 2.2. The Gini values ofC,G, andGwere the lowest and these parameters changed least during the whole construction project, which indicates that they play a lesser role in the upward displacement of linings. In general, parameters with a high Gini importance score also had high correlation coefficients (Fig. 10), which demonstrates the reliability of RF in predicting the upward displacement of tunnel linings. The result of the most important influencing factors can be used to guide safe construction to control the upward displacement of tunnel linings. In future studies, it would be beneficial to collect additional datasets from various projects to train the prediction model and validate the general applicability of the Gini values. This would help assess the performance and reliability of the model across different scenarios.
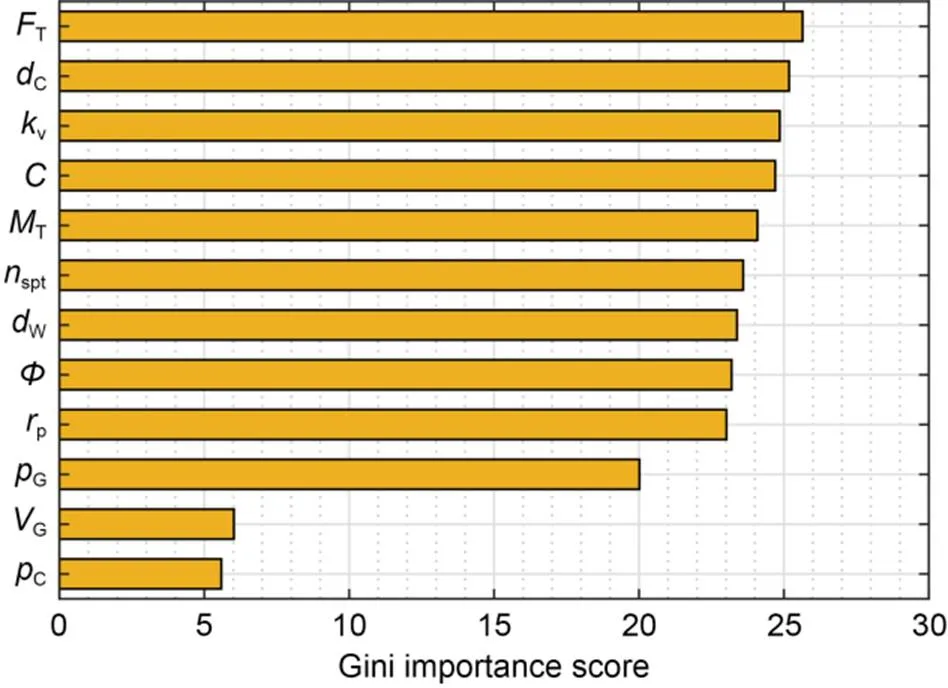
Fig. 18 Gini importance scores of all influencing factors
6 Conclusions
This paper proposes an innovative modeling method to predict the maximum upward displacement of tunnel linings. A comprehensive summary is provided on the mechanism and factors that contribute to the upward movement of tunnel linings during construction. The combination of PSO and 5-fold CV is employed to determine the optimal hyper-parameters of the RF model. This hybrid algorithm can effectively avoid the problem of over- or under-fitting in optimization and effectively improve the robustness and generalization of prediction models. The prediction performances of the two models, PSO-RF and RF (default), were compared. The following conclusions were drawn:
(1) The mechanism of the upward movement of tunnel linings is that the tail void provides the floating space and the upward external forces affect the floating trend.
(2) The combination of PSO and CV effectively determines the optimal hyper-parameters and improves the prediction performance of the RF.
(3) The PSO-RF model successfully predicts the maximum upward displacement of linings with a low error (MAE=4.04 mm, RMSE=5.67 mm) and a high correlation (2=0.915).
(4) The thrust and depth of the tunnel are the most important influencing factors for the PSO-RF based model to predict the upward displacement of linings.
Because the training data in this study came from only one shield tunnel project, it is difficult to add the unchanged influencing factors into the prediction model. In further research, more data should be obtained from different projects to expand the databases and enhance the generalization ability of the prediction model.
This work is supported by the Basic Science Center Program for Multiphase Evolution in Hyper Gravity of the National Natural Science Foundation of China (No. 51988101), the National Natural Science Foundation of China (No. 52178306), and the Zhejiang Provincial Natural Science Foundation of China (No. LR19E080002).
Xiaowei YE: supervision; methodology; writing-review & editing; funding acquisition. Xiaolong ZHANG: data curation; writing-original draft; methodology; software; validation. Yanbo CHEN: supervision; data curation; writing-review & editing. Yujun WEI: methodology; writing-original draft. Yang DING: data curation; writing-original draft.
Xiaowei YE, Xiaolong ZHANG, Yanbo CHEN, Yujun WEI, and Yang DING declare that they have no conflict of interest.
All data, models, and code that underpin the findings of this study are accessible in a repository or online, in compliance with the data retention policies of the funders. The monitoring data are stored in the Harvard dataverse and can be visited through the following link: https://dataverse.harvard.edu/dataset.xhtml?persistentId=doi:10.7910/DVN/R5KO1R.
Breiman L, 2001. Random forests., 45(1):5-32. https://doi.org/10.1023/A:1010933404324
Chen RP, Li J, Kong LG, et al., 2013. Experimental study on face instability of shield tunnel in sand., 33:12-21. https://doi.org/10.1016/j.tust.2012.08.001
Chen RP, Liu Y, Liu SX, et al., 2014. Characteristics of upward moving for lining during shield tunnelling construction., 48(6):1068-1074 (in Chinese). https://doi.org/10.3785/j.issn.1008-973X.2014.06.014
Chen RP, Zhang P, Kang X, et al., 2019. Prediction of maximum surface settlement caused by earth pressure balance (EPB) shield tunneling with ANN methods., 59(2):284-295. https://doi.org/10.1016/j.sandf.2018.11.005
Ding Y, Ye XW, Guo Y, 2023a. A multistep direct and indirect strategy for predicting wind direction based on the EMD-LSTM model., 2023:4950487. https://doi.org/10.1155/2023/4950487
Ding Y, Ye XW, Guo Y, 2023b. Data set from wind, temperature, humidity and cable acceleration monitoring of the Jiashao bridge., 13(2-3):579-589. https://doi.org/10.1007/s13349-022-00662-5
Ding Y, Hang D, Wei YJ, et al., 2023c. Settlement prediction of existing metro induced by new metro construction with machine learning based on SHM data: a comparative study., in press. https://doi.org/10.1007/s13349-023-00714-4
Elbaz K, Shen SL, Sun WJ, et al., 2020. Prediction model of shield performance during tunneling via incorporating improved particle swarm optimization into ANFIS., 8:39659-39671. https://doi.org/10.1109/ACCESS.2020.2974058
Elbaz K, Yan T, Zhou AN, et al., 2022. Deep learning analysis for energy consumption of shield tunneling machine drive system., 123:104405. https://doi.org/10.1016/j.tust.2022.104405
Elbaz K, Zhou AN, Shen SL, 2023. Deep reinforcement learning approach to optimize the driving performance of shield tunnelling machines., 136:105104. https://doi.org/10.1016/j.tust.2023.105104
El-Gallad A, El-Hawary M, Sallam A, et al., 2002. Enhancing the particle swarm optimizer via proper parameters selection. Canadian Conference on Electrical and Computer Engineering, Conference Proceedings, 2:792-797. https://doi.org/10.1109/CCECE.2002.1013043
Fargnoli V, Gragnano CG, Boldini D, et al., 2015. 3D numerical modelling of soil–structure interaction during EPB tunnelling., 65(1):23-37. https://doi.org/10.1680/geot.14.P.091
Geng DX, Hu YC, Jiang YL, et al., 2021. Modified calculation model for segment floating in slurry shield tunnel., 35(5):04021068. https://doi.org/10.1061/(ASCE)CF.1943-5509.0001632
Ho TK, 1998. The random subspace method for constructing decision forests., 20(8):832-844. https://doi.org/10.1109/34.709601
Kohestani VR, Bazarganlari MR, Marnani JA, 2017. Prediction of maximum surface settlement caused by earth pressure balance shield tunneling using random forest., 5(1):127-135. https://doi.org/10.22044/jadm.2016.748
Liang JX, Tang XW, Wang TQ, et al., 2022. Numerical analysis of the influence of a river on tunnelling-induced ground deformation in soft soil., 23(7):564-578. https://doi.org/10.1631/jzus.A2100683
Lin SS, Shen SL, Zhou AN, 2022. Real-time analysis and prediction of shield cutterhead torque using optimized gated recurrent unit neural network., 14(4):1232-1240. https://doi.org/10.1016/j.jrmge.2022.06.006
Lovatti BPO, Nascimento MHC, Neto ÁC, et al., 2019. Use of random forest in the identification of important variables., 145:1129-1134. https://doi.org/10.1016/j.microc.2018.12.028
Luo WP, Yuan DJ, Jin DL, et al., 2020. Prediction and analysis of slurry pressure at the shield cut in composite strata based on random forest., 53(S1):43-49 (in Chinese). https://doi.org/10.15951/j.tmgcxb.2020.s1.008
Lv F, Yu J, Zhang J, et al., 2022. A novel stacking-based ensemble learning model for drilling efficiency prediction in earth-rock excavation., 23(12):1027-1046. https://doi.org/10.1631/jzus.A2200297
Lv QQ, Zhou JJ, Yang ZX, et al., 2017. Prediction of shield tunnel segment up-floating caused by formation rebound., 37(S2):87-93 (in Chinese). https://doi.org/10.3973/j.issn.2096-4498.2017.S2.013
Meng XH, Babaee H, Karniadakis GE, 2021. Multi-fidelity Bayesian neural networks: algorithms and applications., 438:110361. https://doi.org/10.1016/j.jcp.2021.110361
Neu GE, Edler P, Freitag S, et al., 2022. Reliability based optimization of steel-fibre segmental tunnel linings subjected to thrust jack loadings., 254:113752. https://doi.org/10.1016/j.engstruct.2021.113752
Raissi M, Perdikaris P, Karniadakis GE, 2019. Physics-informed neural networks: a deep learning framework for solving forward and inverse problems involving nonlinear partial differential equations., 378:686-707. https://doi.org/10.1016/j.jcp.2018.10.045
Shan F, He XZ, Armaghani DJ, et al., 2022. Success and challenges in predicting TBM penetration rate using recurrent neural networks., 130:104728. https://doi.org/10.1016/j.tust.2022.104728
Shen SL, Elbaz K, Shaban WM, et al., 2022. Real-time prediction of shield moving trajectory during tunnelling., 17(4):1533-1549. https://doi.org/10.1007/s11440-022-01461-4
Shi JW, Chen YH, Lu H, et al., 2022. Centrifuge modeling of the influence of joint stiffness on pipeline response to underneath tunnel excavation., 59(9):1568-1586. https://doi.org/10.1139/cgj-2020-0360
Shu Y, Zhou SH, Ji C, et al., 2017. Analysis of shield tunnel segment uplift data and uplift value forecast during tunnel construction in variable composite formation., 36(S1):3464-3474 (in Chinese). https://doi.org/10.13722/j.cnki.jrme.2016.0606
Talmon AM, Bezuijen A, 2013. Analytical model for the beam action of a tunnel lining during construction., 37(2):181-200. https://doi.org/10.1002/nag.1092
Wang F, Gou BC, Qin YW, 2013. Modeling tunneling-induced ground surface settlement development using a wavelet smooth relevance vector machine., 54:125-132. https://doi.org/10.1016/j.compgeo.2013.07.004
Wang J, Feng K, Wang YC, et al., 2022. Soil disturbance induced by EPB shield tunnelling in multilayered ground with soft sand lying on hard rock: a model test and DEM study., 130:104738. https://doi.org/10.1016/j.tust.2022.104738
Wang SM, He C, Nie L, et al., 2019. Study on the long-term performance of cement-sodium silicate grout and its impact on segment lining structure in synchronous backfill grouting of shield tunnels., 92:103015. https://doi.org/10.1016/j.tust.2019.103015
Wang SM, Lin ZY, Peng XY, et al., 2022. Research and evaluation on water-dispersion resistance of synchronous grouting slurry in shield tunnel., 129:104679. https://doi.org/10.1016/j.tust.2022.104679
Xu YF, Sun DA, Sun J, et al., 2003. Soil disturbance of Shanghai silty clay during EPB tunnelling., 18(5):537-545. https://doi.org/10.1016/S0886-7798(03)00083-X
Yang L, Meng XH, Karniadakis GE, 2021. B-PINNs: Bayesian physics-informed neural networks for forward and inverse PDE problems with noisy data., 425:109913. https://doi.org/10.1016/j.jcp.2020.109913
Yang Q, Geng P, Wang JX, et al., 2022. Research of asphalt–cement materials used for shield tunnel backfill grouting and effect on anti-seismic performance of tunnels., 318:125866. https://doi.org/10.1016/j.conbuildmat.2021.125866
Ye F, Zhu HH, Ding WQ, 2008. Longitudinal upward movement analysis of shield tunnel based on elastic foundation beam., 29(4):65-69 (in Chinese).
Ye JN, Liu Y, Chen RP, et al., 2014. Study of the permissible value of upward floating for segment in shield tunnel construction., 33(s2):4067-4074 (in Chinese). https://doi.org/10.13722/j.cnki.jrme.2014.s2.084
Ye XW, Jin T, Yun CB, 2019. A review on deep learning-based structural health monitoring of civil infrastructures., 24(5):567-585. https://doi.org/10.12989/sss.2019.24.5.567
Ye XW, Jin T, Chen YM, 2022. Machine learning-based forecasting of soil settlement induced by shield tunneling construction., 124:104452. https://doi.org/10.1016/j.tust.2022.104452
Ye XW, Zhang XL, Zhang HQ, et al., 2023. Prediction of lining upward movement during shield tunneling using machine learning algorithms and field monitoring data., 41:101002. https://doi.org/10.1016/j.trgeo.2023.101002
Zhang P, Chen RP, Wu HN, 2019. Real-time analysis and regulation of EPB shield steering using random forest., 106:102860. https://doi.org/10.1016/j.autcon.2019.102860
Zhang P, Yin ZY, Jin YF, 2022a. Bayesian neural network-based uncertainty modelling: application to soil compressibility and undrained shear strength prediction., 59(4):546-557. https://doi.org/10.1139/cgj-2020-0751
Zhang P, Yin ZY, Jin YF, et al., 2022b. Physics-informed multifidelity residual neural networks for hydromechanical modeling of granular soils and foundation considering internal erosion., 148(4):04022015. https://doi.org/10.1061/(ASCE)EM.1943-7889.0002094
Zhou J, Li XB, Mitri HS, 2016. Classification of rockburst in underground projects: comparison of ten supervised learning methods., 30(5):04016003. https://doi.org/10.1061/(ASCE)CP.1943-5487.0000553
Zhou J, Shi XZ, Du K, et al., 2017. Feasibility of random-forest approach for prediction of ground settlements induced by the construction of a shield-driven tunnel., 17(6):04016129. https://doi.org/10.1061/(ASCE)GM.1943-5622.0000817
Zhou SH, Ji C, 2014. Tunnel segment uplift model of earth pressure balance shield in soft soils during subway tunnel construction., 2(4):221-238. https://doi.org/10.1080/23248378.2014.966420
题目:基于粒子群优化-随机森林(PSO-RF)算法的盾构隧道施工期管片最大上浮量预测
作者:叶肖伟1,2,张小龙2,陈延博1,2,魏瑜均2,丁杨3
机构:1浙江大学,软弱土与环境土工教育部重点实验室,中国杭州,310027;2浙江大学,建筑工程学院,中国杭州,310027;3浙大城市学院,城市基础设施智能化浙江省工程研究中心,中国杭州,310015
目的:盾构隧道施工阶段面临管片上浮问题,不均匀上浮将引起管片破损、开裂、渗漏水等病害,严重影响隧道施工质量与长期服役性能。本文系统地总结了管片上浮机理与影响因素,提出粒子群优化-随机森林(PSO-RF)混合算法,建立管片最大上浮量预测模型,可实现盾构隧道管片上浮量的准确预测,用以指导盾构隧道安全施工。
创新点:1. 提出混合的PSO-RF算法,预测管片最大上浮量;2. 总结盾构隧道施工期管片上浮机理与影响因素。
方法:1. 基于管片上浮机理,筛选出12个管片上浮影响因素;2. 提出PSO-RF混合优化算法,提升预测模型的预测性能;3. 基于管片上浮数据库,建立管片上浮预测模型,并对比PSO-RF模型与RF模型的预测性能。
结论:1. 提出的PSO-RF混合模型明显提升了管片最大上浮量预测模型的预测性能;2. PSO-RF管片上浮预测模型成功预测了管片的最大上浮量,有更小的预测误差(MAE=4.04 mm,RMSE=5.67 mm)与更高的相关性 (2=0.915);3. 盾构机千斤顶推力与隧道埋深是影响管片最大上浮量预测模型性能的主要因素。
关键词:随机森林;粒子群优化;管片上浮;机器学习预测;盾构隧道施工
https://doi.org/10.1631/jzus.A2300011
Revision accepted Aug. 7, 2023;
Crosschecked Sept. 25, 2023;
Online first Nov. 21, 2023
© Zhejiang University Press 2024
Jan. 7, 2023;
猜你喜欢
安徽农学通报(2017年1期)2017-02-15
软件(2016年7期)2017-02-07
计算机应用(2016年12期)2017-01-13
南水北调与水利科技(2016年6期)2017-01-06
电脑知识与技术(2016年23期)2016-11-02
科技视界(2016年20期)2016-09-29
现代电子技术(2015年16期)2015-11-17
现代电子技术(2015年21期)2015-11-09
现代电子技术(2015年15期)2015-08-14
现代电子技术(2015年8期)2015-07-09
 Journal of Zhejiang University-Science A(Applied Physics & Engineering)2024年1期
- Journal of Zhejiang University-Science A(Applied Physics & Engineering)的其它文章
- Numerical modeling and experimental investigation of a two-phase sink vortex and its fluid–solid vibration characteristics
- Biomimetic microchannel network with functional endothelium formed by sacrificial electrospun fibers inside 3D gelatin methacryloyl (GelMA) hydrogel models
- Comparison of the hygrothermal performance of two light-framed timber structure buildings under different operation modes
- Biotreatment of incinerated bottom ash and biocementation of sand blocks using soybean urease
- Effect of nitrile butadiene rubber hardness on the sealing characteristics of hydraulic O-ring rod seals