
Comparison of the hygrothermal performance of two light-framed timber structure buildings under different operation modes
2024-01-24 06:01WanqingXUYucongXUEJiangLUYifanFANXiaoyuLUO
关键词:室内环境
Wanqing XU, Yucong XUE, Jiang LU, Yifan FAN, Xiaoyu LUO
Research Article
Comparison of the hygrothermal performance of two light-framed timber structure buildings under different operation modes

1College of Civil Engineering and Architecture, Zhejiang University, Hangzhou 310058, China2International Research Center for Green Building and Low-Carbon City, International Campus, Zhejiang University, Jiaxing 314400, China3School of Civil Engineering and Architecture, Zhejiang University of Science and Technology, Hangzhou 310023, China
Light-framed timber structure (LTS) buildings have been highly valued in recent years due to their low-carbon characteristics. However, the applicability of the building envelope is closely related to indoor and outdoor conditions. The hot summer and cold winter (HSCW) climate zone in China has high humidity and great temperature variation throughout the year, resulting in distinct outdoor environments in different seasons. The indoor environment is greatly affected by energy-consumption patterns and window-opening habits, which largely depend upon the regulation operations of occupants. All these interrelated factors lead to extremely complex boundary conditions on each side of the building envelope. Whether the structures of LTS buildings are applicable in this climate zone, therefore, needs to be carefully considered. In this study, two LTS buildings with different envelopes were established in Haining, China, situated in the HSCW climate zone, and selected as the study objects. Different operation modes were adopted to create a variety of indoor environments. Under each condition, the processes of heat and moisture transfer within the building envelopes and the indoor environment were monitored and compared. The comparison indicated that the building envelope with high moisture storage and insulation ability maintained a relatively stable indoor environment, especially when the environment changed abruptly. Conversely, if the outdoor environment was equable (e.g., relative humidity within the range of 30%–60%) or intermittent energy consumption modes were adopted, the building envelope with a low thermal inertia index and weak moisture-buffering ability performed better because it enabled a faster response of the indoor environment to air conditioning. Moreover, a high risk of moisture accumulation between the thermal insulation layer and other materials with a large water vapour transfer resistance factor was also identified, suggesting a higher requirement for the vapour insulation of the envelopes of LTS buildings.
Light-framed timber structure (LTS) buildings; In-situ experiment; Typical operation mode; Indoor environment; Heat and moisture transfer
1 Introduction
Currently, the massive emission of carbon dioxide exacerbates the global greenhouse effect, leading to global warming, ocean acidification, desertification, and extreme climatic events (Yoro and Daramola, 2020). In 2019, China emitted 9825.8 million tons of carbon dioxide, 20% of which could be attributed to the construction industry (Tsinghua University Building Energy Conservation Research Center, 2019; BP, 2020). This indicates that there is great potential to reduce emissions and conserve energy by considering the total life cycle of buildings. Researchers have found that the selection of structural systems as well as the materials of the envelope play a significant role in the total life cycle emissions of buildings (Wang et al., 2018; Ma, 2019; Zhang et al., 2021; Punhagui and John, 2022). Compared with other materials, wood can significantly assist in reducing carbon when used as a building material. Firstly, wood emits less carbon dioxide at the production stage due to the solidification of carbon dioxide during the growth of wood (Fei et al., 2002; Jiang, 2005; Zeng et al., 2018). Secondly, its low thermal conductivity gives wooden structure buildings satisfactory thermal insulation performance. To achieve the same thermal insulation effect, the required thickness of wood is 1/15 of that of concrete and 1/400 of that of steel (Fei et al., 2002). Thus, the insulation layer used for wooden structures can be thinner than that used for steel structures. Finally, after the demolition of wooden structure buildings, most components (e.g., beams and columns) can be reused, and waste materials can be effectively degraded (Wang, 2009).
As well as having low carbon emissions, wooden structure buildings can also provide a satisfactory indoor hygrothermal environment due to the high porosity and excellent moisture storage capacity of wood (Simonson et al., 2001; Hameury and Lundström, 2004; Li et al., 2012). Li et al. (2012) indicated that wooden materials can effectively adjust indoor humidity by decreasing the average indoor humidity and the amplitude of relative humidity. A similar result was reported by Wang (2009) who foundthat wooden structure building envelopes helped to decrease the average daily amplitude of the temperature and relative humidity, resulting in a more comfortable indoor environment in winter. Therefore, wooden structure buildings and their corresponding envelopes have become increasingly valued and promoted all over the world, especially light-framed timber structures (LTSs), which use wood as the frame and can be built quickly.
The hygrothermal performance of LTS buildings has also been researched. Results indicate that LTS buildings provide a suitable indoor environment and are energy-efficient under unoccupied or continuous energy-consumption patterns, especially in winter (Zhao, 2007; Zhang, 2011). However, the low thermal stability of LTS buildings is a potential cause of overheating of indoor environments when the outdoor temperature is extremely high (Adekunle and Nikolopoulou, 2016). Latif et al. (2014) considered the influence of moisture load on LTS walls. Their results suggested that during high internal moisture load in vapour open panels, the temperature and relative humidity of insulation-oriented strand board (OSB) interfaces could be favourable for mould growth. Tests in an environmental chamber also have been conducted to compare the hygrothermal performance of LTS walls with different insulation materials under dynamic profiles (Latif et al., 2018). Several other studies have been carried out under different climates. For example, Fu et al. (2020)constructed full-sized mock-up models in the hot summer and cold winter (HSCW) zone with an unoccupied indoor condition. Brambilla and Gasparri (2020)compared the hygrothermal behaviour of LTS buildings and cross-laminated timber (CLT) buildings under different climates in Australia and different indoor climate profiles by simulation.
However, both the indoor and outdoor environments determine whether the building envelope is appropriate in a specific situation, and the results under different conditions might be contradictory (Xu et al., 2019; Al-Saadi and Al-Jabri, 2020; Khan and Bhattacharjee, 2021; Nasrollahzadeh, 2021). In particular, as a type of biomass material, wood exhibits a high risk of mildew and rot when a large amount of moisture accumulates over a long time. The application of wood materials and corresponding envelopes might be limited in situations with high relative humidity. In China, the climate varies with geographical location. The HSCW climate zone covers the middle and lower reaches of the Yangtze River, which is one of the most economically developed and densely populated areas in China (Xu et al., 2013). This zone has distinct four-season characteristics, so the buildings in this zone develop enormous heating and cooling loads (Yu, 2009; You et al., 2017). Therefore, the thermal design of buildings must include suitable insulation measures to avoid overheating in summer and indoor heat loss in winter (MOHURD, 2016). Because the climate in this area is characterized by high year-round humidity, a large amount of vapour is transferred and stored in the exterior walls of buildings, which affects the hygrothermal properties of building materials (Liu et al., 2015). Thus, exterior walls should also meet moisture-proof requirements. In contrast to the continuous energy-consumption pattern in the cold and severe cold climate zones, an intermittent energy-consumption pattern supplemented by ventilation is more prevalent in the HSCW climate zone, i.e., occupants decide whether to activate heating or cooling equipment according to the actual conditions (Chen et al., 2020). Studies of the intermittent energy-consumption patterns of buildings have been conducted, which have helped to obtain accurate energy-consumption data and assess the indoor hygrothermal environment (Qiu, 2009; He, 2015; Ruan et al., 2015; Meng et al., 2018; Wessberg et al., 2019; Ge et al., 2021a). While those studies paid attention to traditional building materials and structures, few studies of LTS buildings have considered the energy-consumption pattern, let alone building envelope optimization, under the above pattern. This might hinder the development of the LTS buildings in the HSCW zone.
Considering the research gaps identified above, the objective of this study was to explore the indoor hygrothermal environment of LTS buildings and the process of heat and moisture transfer within building envelopes. Furthermore, we compared the advantages and disadvantages of different panels hung on each side of the envelope. Thus, two full-scale buildings with different configurations were established in Jiaxing, China, a typical city in the HSCW climate zone. Then, in situ experiments were performed under variable energy use and ventilation modes.
This paper is organized as follows. In Section 2, the calculation method, material physical parameters, experimental instruments, and methods are introduced. The experimental results are analyzed in Section 3 and discussed in Section 4. Finally, the conclusions of this study are outlined in Section 5.
2 Methodology
2.1 Method for calculating the hygrothermal parameters of the enclosure
2.1.1Thermal parameters of the exterior walls
The total thermal resistance0and thermal transmittancecan be used to assess the thermal performance of walls. These parameters are widely used in various thermal standards such as the national standard of the People's Republic of China GB 50176–2016 (MOHURD, 2016) and the international standard ISO 6946:2007(E) (ISO, 2007) and research (Latif et al., 2014, 2018). The methods are detailed below.
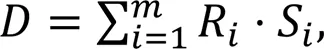
The calculation method for the thermal resistance valueof each layer of a building envelope can be expressed as

whereis the material thickness, m;is the material thermal conductivity, W/(m·K).
The total thermal resistance0, which is the sum of the surface thermal resistance and thermal resistance of each layer, can be calculated according to Eq. (2):

whereinis the thermal resistance of the internal surface, m2·K/W;exis the thermal resistance of the external surface, m2·K/W;is the number of levels;Ris the thermal resistance value of theth layer, m2·K/W.
The thermal transmittanceof the building envelope is the inverse of0expressed as
A thermal bridge is a part of a building envelope that creates a less-resistant path for heat transfer and thus lowers the overall thermal insulation performance (Lu et al., 2020; Ge et al., 2021b). In wooden structure buildings, the keel acts as a type of thermal bridge due to a lack of thermal insulation over the main part. Following JGJ 134–2010 (MOHURD, 2010), the average thermal transmittance of the exterior wallmcan, therefore, be defined to evaluate the overall thermal performance, as expressed in Eq. (4).
The weighted total thermal resistance of the building envelopem, i.e., the inverse ofm, can be calculated with Eq. (5).
wherePis the thermal resistance of the main part of the external walls, W/(m2·K);is the number of thermal bridges with different thermal transmittance values in the external walls;Biis the thermal transmittance of theth thermal bridge in the exterior walls, W/(m2·K);Pis the area of the corresponding part of the insulation material, m2;Biis the area of theth thermal bridge, m2.
When the environmental temperature periodically fluctuates, heat can be stored and released by building materials. Therefore, the thermal storage coefficientis introduced as the coefficient of heat accumulation for wall materials, which can be calculated as follows:
whereis the material density, kg/m3;is the specific heat capacity, J/(kg·K);is the fluctuation cycle time, h.
The thermal inertia indexcan be used to characterize the degree of attenuation of the envelope for temperature waves, which can be written as
whereSis the coefficient of heat accumulation for the material of theth layer, W/(m2·K).
2.1.2Moisture parameters of the exterior walls
The total water vapour diffusion resistance of the building envelope can be determined as follows:
where0is the total water vapour diffusion resistance, m2·s·Pa/kg;His the water vapour diffusion resistance of theth layer, m2·s·Pa/kg;dis the thickness of theth layer, m;δis the water vapour transfer coefficient of theth layer, kg/(m·s·Pa);airis the water vapour transfer coefficient of air, kg/(m·s·Pa);μis the water vapour transfer resistance factor, dimensionless.
2.2 Overview of the test buildings and outdoor environment
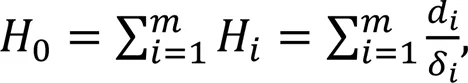
To investigate which structure is more suitable for the HSCW climate zone, two full-scale test LTS building models (Fig. 1a) were established in the International Campus, Zhejiang University, Haining, China. Haining is an eastern coastal city in China located at longitude 120°41′ east and latitude 30°32′ north. As in other cities in the HSCW climate zone, Haining has four distinctive seasons, with a great difference in temperature between winter and summer. In 2021, the average temperature was 5.92 ℃ in January and 29.14 ℃ in July. The relative humidity of Haining is generally high throughout the year, with an average value of 75.69%.
Fig. 1 Test buildings: (a) photo; (b) plan (unit: mm)
Piles cast from reinforced concrete were used to construct the foundations of the buildings, which are elevated above the ground to reduce additional influences on the heat and moisture transfer process and indoor environment. As load-bearing structures of these buildings, keels were built with light spruce-pine-fir (SPF) wood. The distance between the keels is 0.61 m. Both buildings have a floor area of 12.60 m2and a double-slope roof, the highest point of which is located 3.50 m above the floor. A door and a window are set in the eastward and northward walls, respectively, of each building (Fig. 1b). To prevent severe impacts of solar radiation on indoor temperature and humidity, suspended ceilings were fitted between the indoor space and the roof.
Figs. 2a and 2b show the wall construction of Houses 1 and 2. Taking GJBT‒1303 (MOHURD, 2014) as the reference, the core part of both exterior walls comprised OSB, SPF keels, gypsum board, and mineral wool. The hanging board was the only difference between these buildings. In House 1, pine hanging boards were adopted on both sides of the wall. In House 2, only the outer side of the wall was protected, with a fibercement board. These differences resulted in different moisture transfer performance levels of the walls of these buildings which may lead to a different situation for vapour distribution and accumulation.
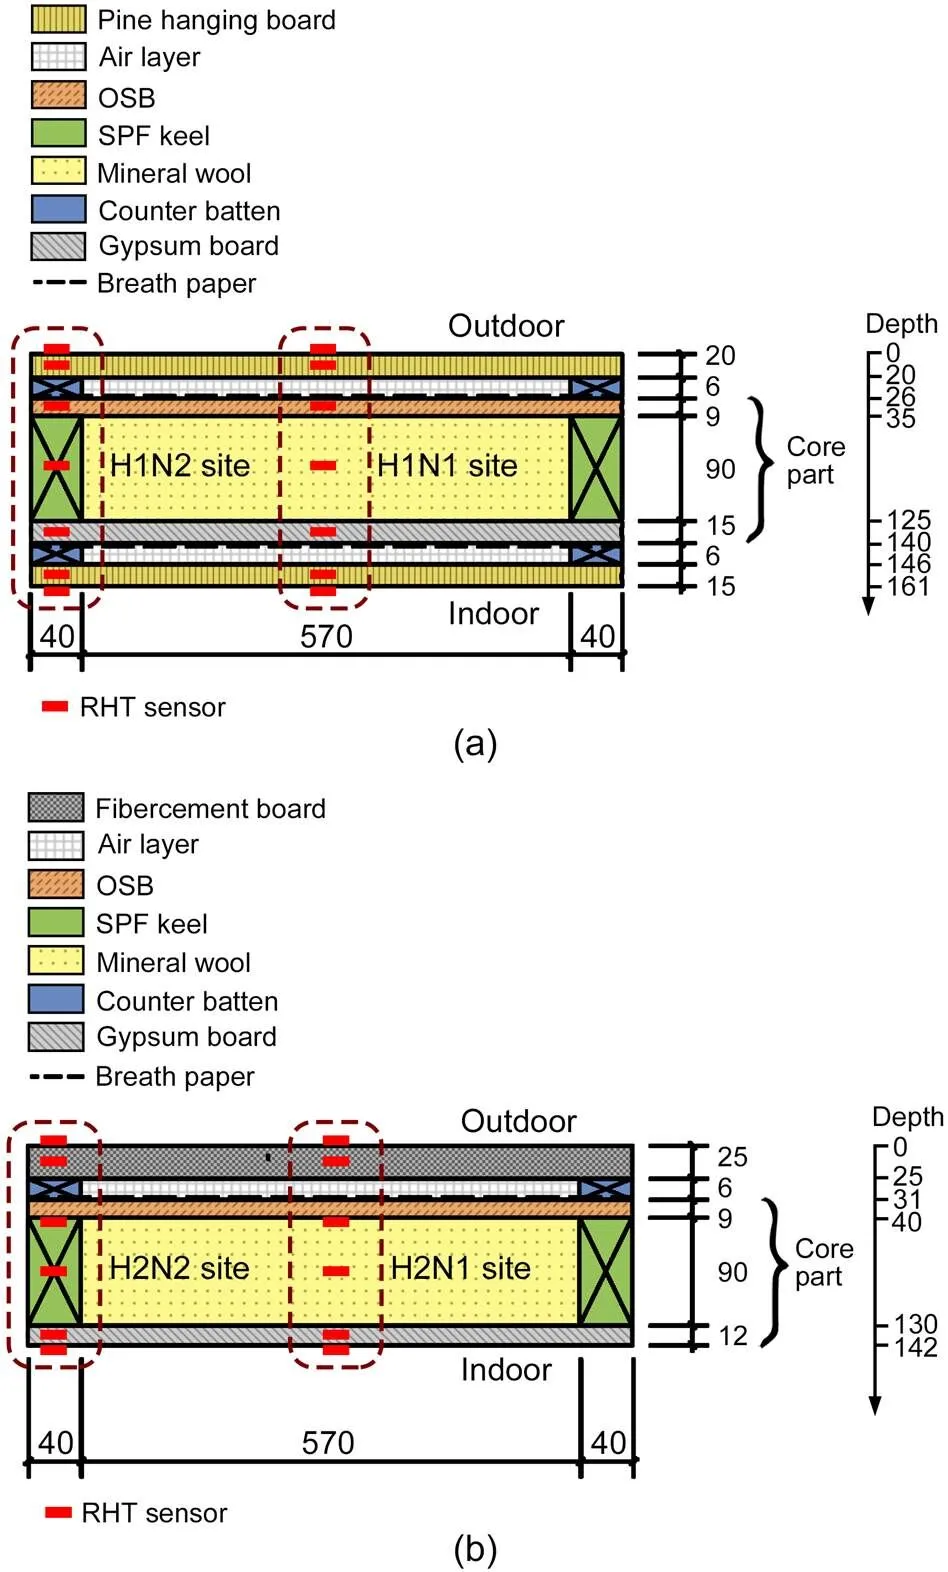
Fig. 2 Wall construction and positions of the measuring points: (a) House 1; (b) House 2 (unit: mm). RHT: relative humidity and temperature. H1 (House 1) and H2 (House 2) are denoted in order to distinguish the sites in the different buildings; for example, H1N1 means the N1 site in the House 1
To assess the performance of the two walls, the hygrothermal parameters of the building envelope were calculated according to the methods described in Sections 2.1.1 and 2.1.2. In a given unit (i.e., a part of the wall comprising the main part and the thermal bridge, shown as the rectangle in Fig. 3), the area of the thermal bridge (SPF keel) is 0.185 m2, whereas the area of the main part is 1.659 m2. According to GB 50176–2016 (MOHURD, 2016), theexandinvalues were 0.04 and 0.11 m2·K/W, respectively. The hygrothermal parameters of the materials used in these buildings are given in Table 1. Relevant SPF and OSB parameters have been measured before, while the hygrothermal parameters of the other materials were obtained from the WUFI-Plus database (WUFI, 1998).

Fig. 3 Measuring sites on the wall: (a) northward wall; (b) southward wall (unit: mm)
The calculation results for the exterior walls are listed in Table 2. The walls of the LTS buildings met the requirement of0for the HSCW zone in GB/T 51350–2019 (MOHURD and SAMR, 2019), suggesting that the buildings have a good thermal performance. The0value of House 1 was 8.6% higher than that of House 2. Themvaluesof both buildings were lower than0due to the poor thermal insulation performance of the keels. The0value of the wall of House 1 was 21.39 times higher than that of the wall of House 2, indicating that House 1 achieved a greater ability to resist water vapour transfer through the wall.
2.3 Monitoring system
To investigate how the heat and moisture transfer process is impacted by the different elements of the building envelopes (e.g., keel and window), six measuring sites, denoted by N1–N6, were selected on the northward wall (Fig. 3). Similarly, measuring sites were selected on the southward wall to clarify the influence of different solar radiation conditions. However, since there is no window in the southward wall, only five measuring sites were established, denoted by S1–S5.
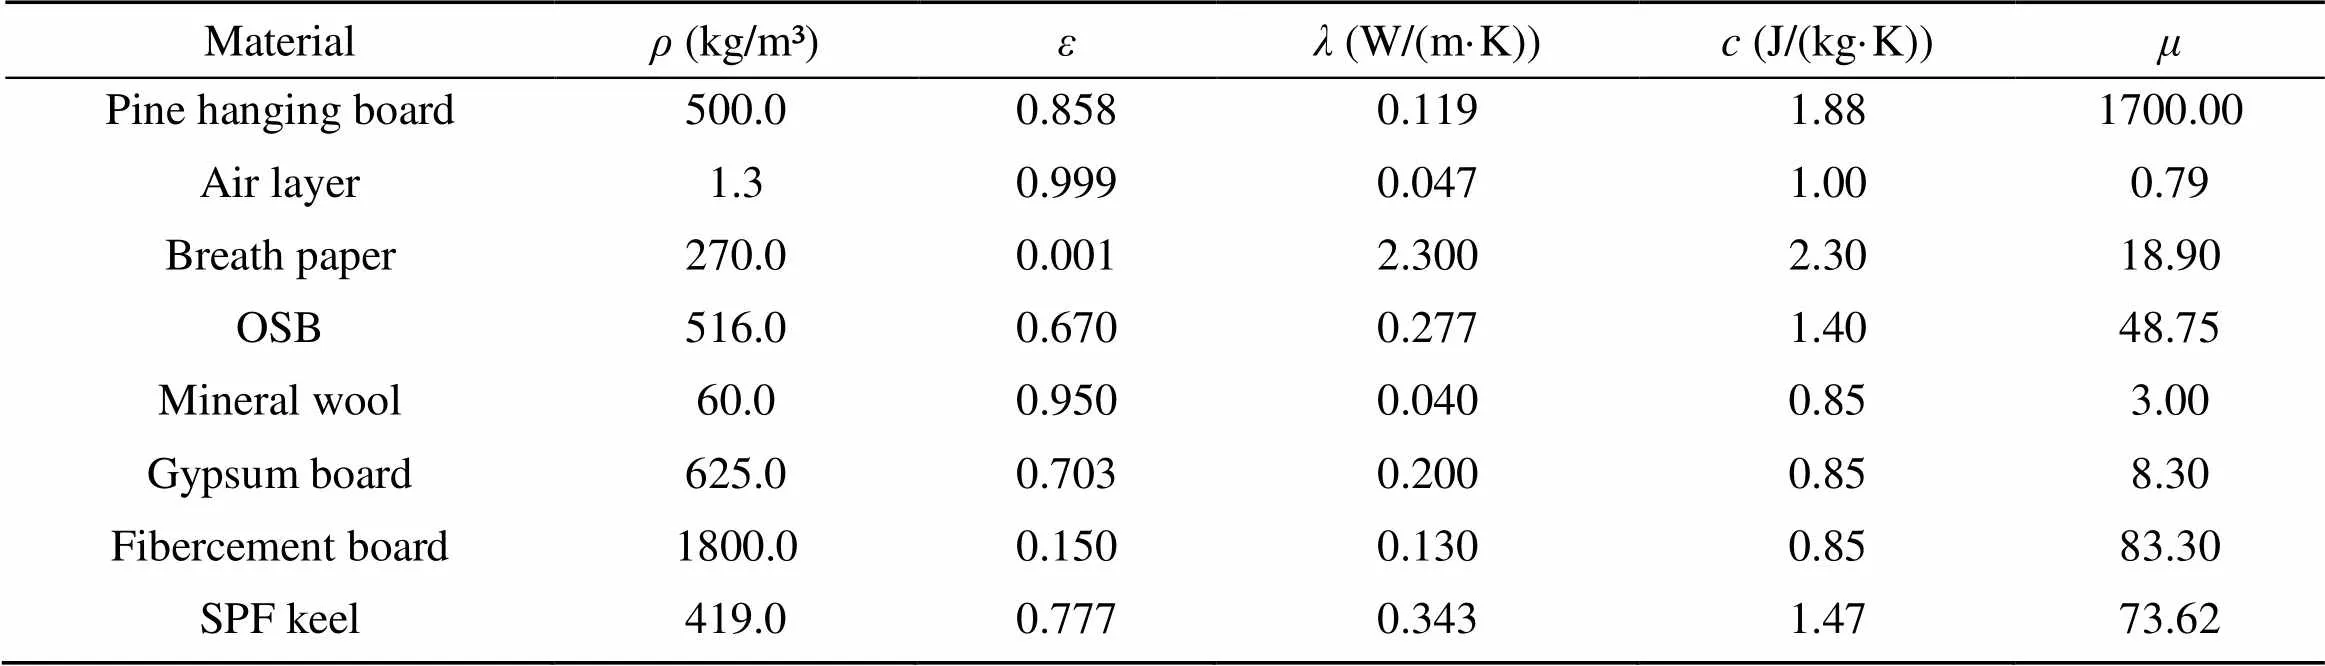
Table 1 Hygrothermal parameters of the materials
is the porosity of the materials (dimensionless)

Table 2 Hygrothermal characteristics of the two types of building envelopes
Notably, the N1 and S1 sites correspond to the main part of the wall, while the N2 and S2 sites correspond to the location of the keel. These four sites were located at a height of 1400 mm, in the center of the wall. In addition, to investigate the difference in heat and humidity at different heights, the N3/S3 and N4/S4 sites were located at heights of 2600 and 200 mm, respectively, which were 1200 mm above and below the N1/S1 sites, respectively. In addition, the N5/S5 and N6 sites were set up to monitor the situation of sites that had weak insulation. The N5 and S5 sites were located at a corner of the wall, and the N6 site was under the window.
Each measuring site contained several measuring points with different depths (Figs. 2a and 2b). At each measuring point, an RHT sensor was placed to monitor changes in the temperature and relative humidity within the building envelope, and the heat and moisture transfer process was then detected. Note that at measuring sites N3/N4/N5/N6 and S3/S4/S5, RHT sensors were set only in the mineral wool, gypsum board, and inner pine hanging board, since heat and moisture transfer in these materials interacts more directly with the indoor environment. Data were gathered automatically using SV3000 software (SONBEST Company of Shanghai, China).
Outdoor temperature and relative humidity were measured with an integrated weather station installed near the test buildings. To record changes in the indoor temperature and relative humidity, an automatic temperature and relative humidity recorder was set on the working face at a height of 1 m in the center of each building, according to the GB/T 50785–2012 standard (MOHURD and AQSIQ, 2012). Details of the equipment used are given in Table 3.
2.4 Experimental setup
Previous studies have investigated the energy-consumption patterns and ventilation habits of residents in the HSCW zone using typical operation modes to control the indoor environment (Qiu, 2009; He, 2015; Chen et al., 2020; Ge et al., 2021a). These studies concluded that in this zone, air conditioners are rarely operated all day. Instead, intermittent energy-consumption patterns assisted by ventilation are often adopted to adjust indoor temperature and humidity. In summer, cooling systems are often operated at night, with natural ventilation at the rest of the time. In winter, intermittent heating is often conducted for several hours in the evening, while ventilation is conducted for a short time in the morning. Winter operation modes were chosen as the main test subject in this study. Among these modes, the typical operation modes of the bedroom and living room in winter were selected, considering the influence of occupants. We assumed that there were two occupants in each test building. In the typical bedroom mode, both members occupied the room at night (20:00–8:00 the next day). In the typical living room mode, one member only occupied the room at dusk (18:00–20:00), while the other member occupied the room from 8:00 to 20:00. In addition, the unoccupied and continuous energy-use modes were selected since these modes were adopted in most studies. Detailed information on the settings of the above modes is provided in Table 4. The rate of vapour generated by the occupants referred to the WUFI-Plus database (WUFI, 1998), at 70 g/(h·person) when the occupants remained still and 35 g/(h·person) when sleeping. The vapour generation process of occupants was simulated with humidifiers. The set temperature for the air conditioners was 18 ℃ in winter and 26 ℃ in summer.
3 Results and discussion
3.1 Indoor hygrothermal environment
3.1.1Continuous energy-consumption patterns in winter and summer
Since there were some similar conclusions for the hygrothermal performance of the two buildings, the common phenomena and results will be described and analyzed first. Then, the difference between the two buildings caused by construction will be analyzed in Section 3.3.
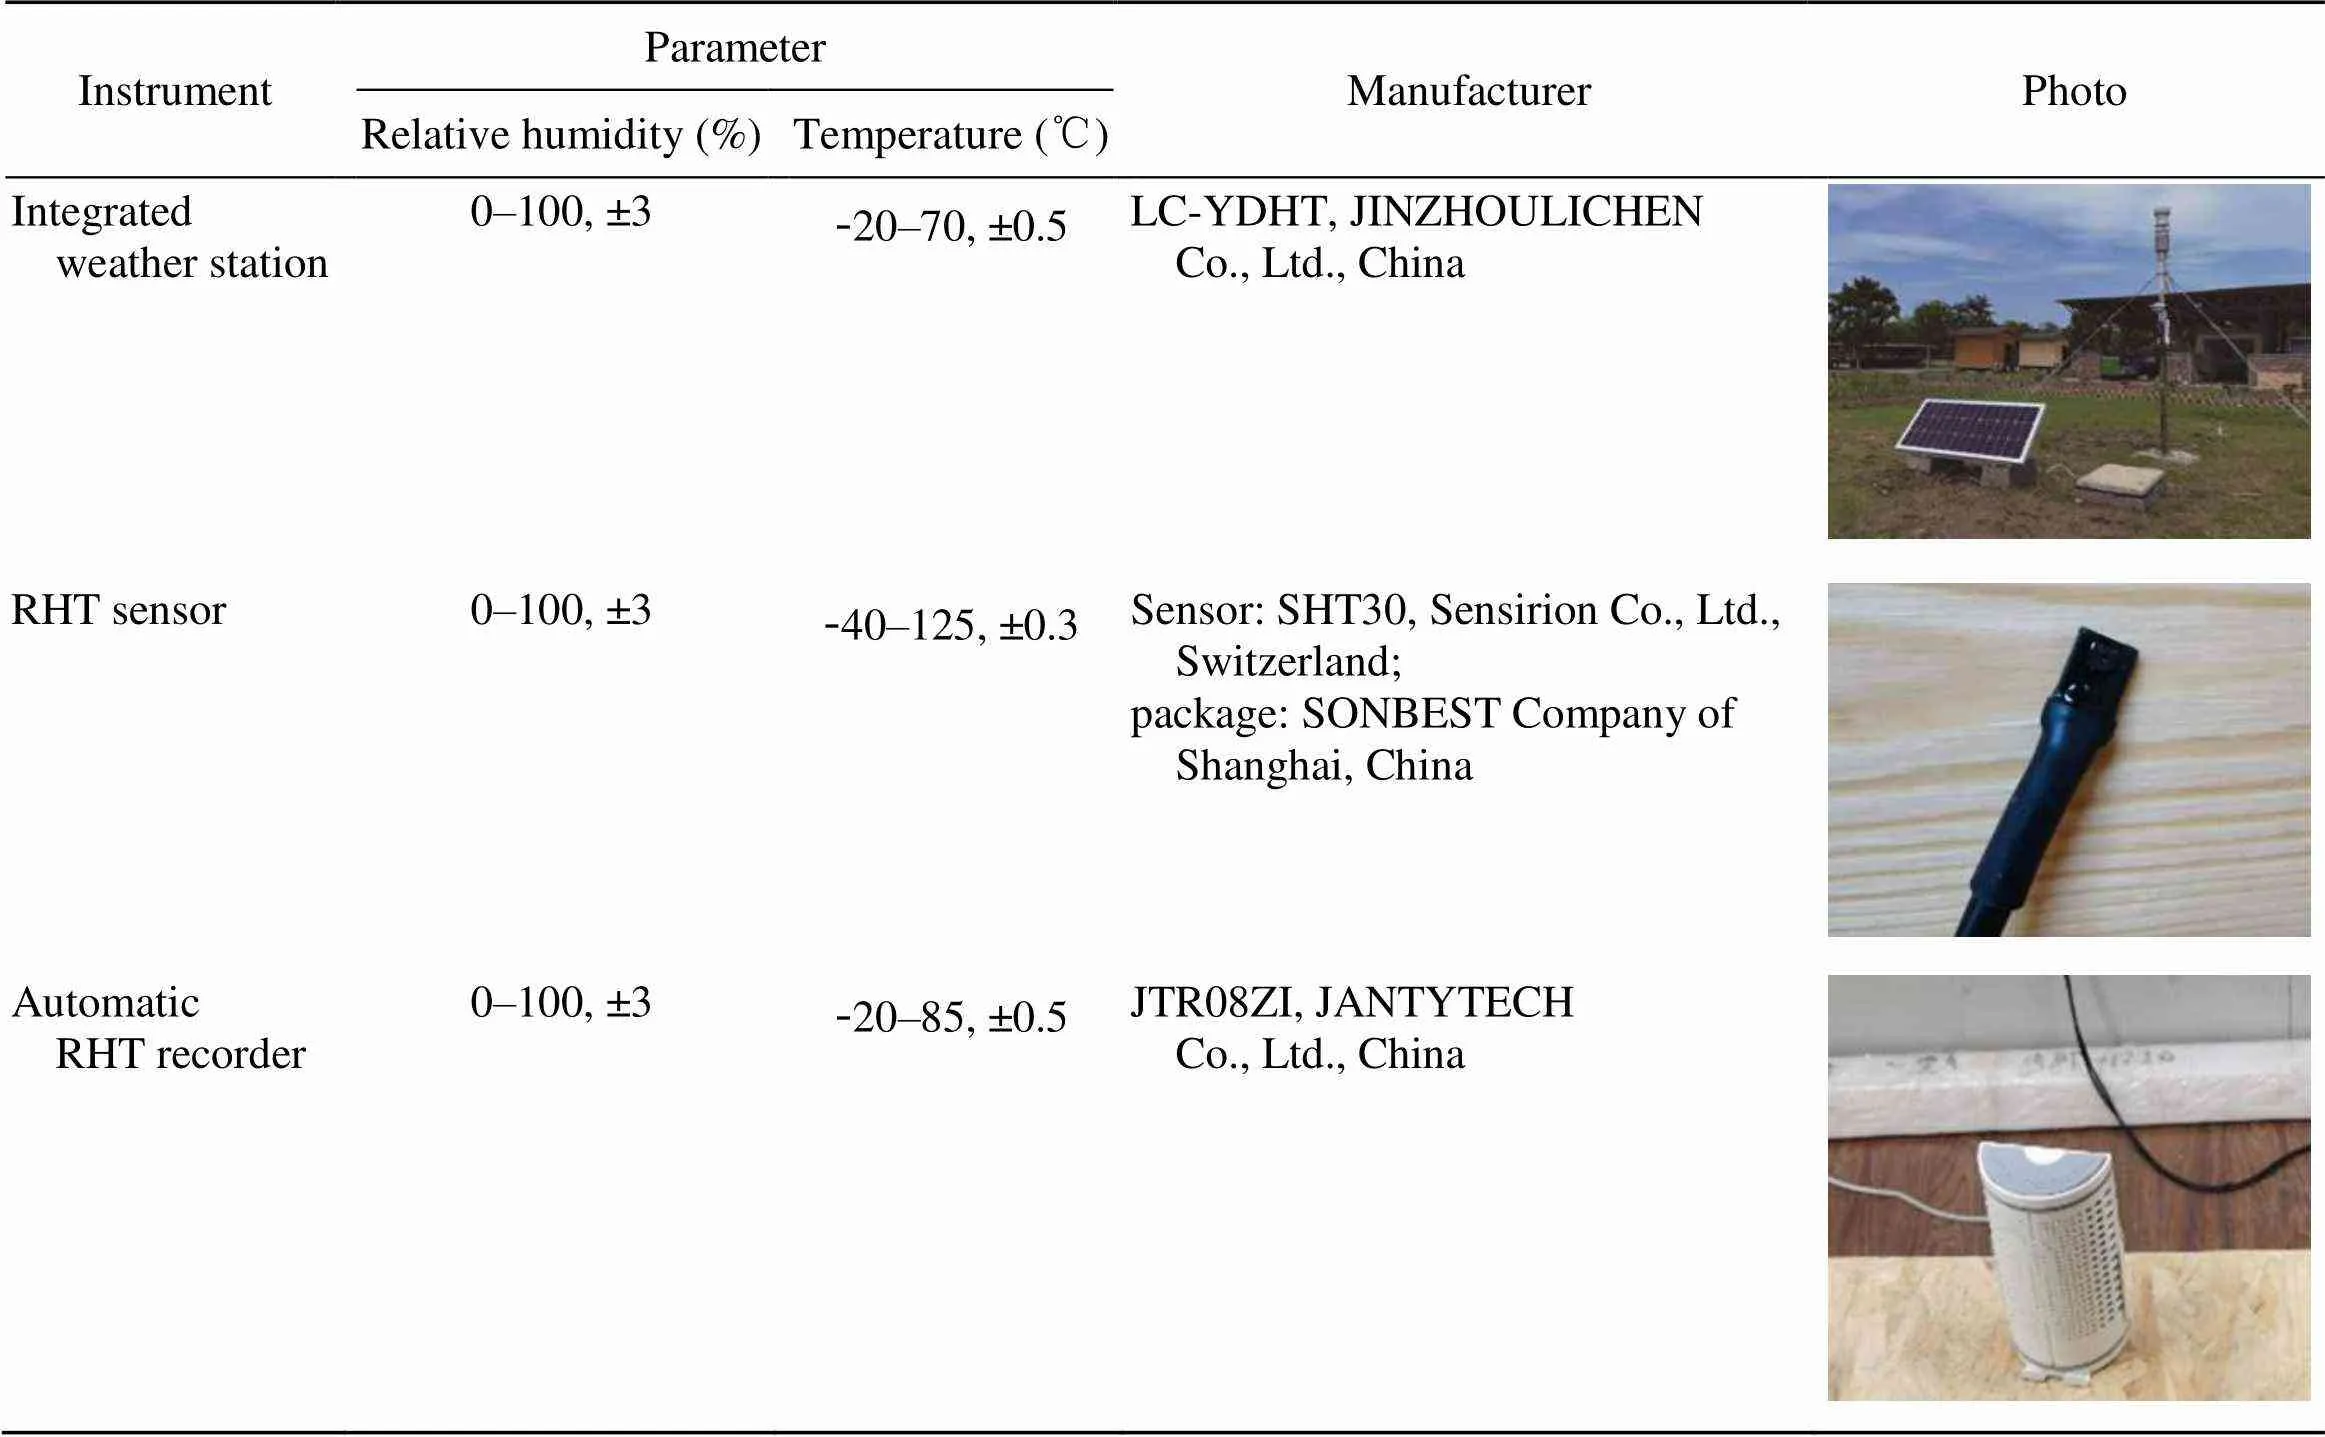
Table 3 Sensors used in the experiment

Table 4 Detailed information on the operation modes used in the experiment
Fig. 4 shows the indoor temperature and humidity under the S-AC mode (Figs. 4a and 4b) and W-AC mode (Figs. 4c and 4d). Because of the uneven air distribution, the measured temperature of the indoor air differed from the set temperature (26 ℃ in summer and 18 ℃ in winter). Owing to the effect of the outdoor temperature and solar radiation, the indoor temperature increased by about 2 ℃ at noon in summer, as shown by the arrow in Fig. 4a. In winter, because the outdoor temperature remained more stable and solar radiation conditions reduced the heat load during the daytime, the indoor temperature could be maintained at a stable level.
The gradient of the water vapour partial pressuredetermines the direction of vapour transfer. Thevalue can be calculated based on the measured temperatureand relative humiditywith reference to Tetens equation:
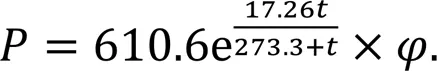
Because of the relatively highandvalues in the outdoor environment, the outdoor averagevalue reached 3179 Pa under the S-AC period, much higher than the indoor average values of 2001 (House 1) and 2167 Pa (House 2). As a result, large amounts of water vapour were transferred from outside to inside, causing the indoorvalue to rise. Thevalue was higher than 70% for more than half the time in both buildings. But under the W-AC mode, the outdoorvalue was low, so the air could hold less water vapour than in summer. The averagevalue of the outdoor air was only 327 Pa, whereas the values of the indoor air were 845 (House 1) and 727 Pa (House 2). Therefore, moisture was transferred from inside to outside, lowering the indoorvalue.
3.1.2Typical operation modes in winter
To investigate the impact of the different operation modes on the indoor environment, the hygrothermal parameters on three typical days were selected under each mode (Fig. 5). In general, the modes involving active adjustment (i.e., W-periods 1 and 3) created a comfortable environment with a relatively highvalue over the mode without space heating (i.e., W-period 2). However, the indoordropped rapidly after the space heating equipment was deactivated. Also, opening windows for morning ventilation (8:00–10:00) did not cause a significant drop in the indoorvalue. This was because the rising sun rapidly heated the outdoor air and reduced the difference inbetween the inside and outside environments of these houses. Nevertheless, bothanddropped to relatively low values close to the outdoor air values (circles in Figs. 5a2 and 5a3 and Figs. 5c2 and 5c3) when the window was open, indicating that the drying effect of ventilation largely depends on the outdoor conditions.
Fig. 4 Indoor temperature and humidity under the continuous energy-consumption mode: (a) temperature in summer; (b) relative humidity in summer; (c) temperature in winter; (d) relative humidity in winter
Vapour generation due to the occupants was obviously the crucial factor influencing theandvalues of the indoor air. As shown by arrow (1) in Fig. 5c3, thevalue of the indoor air of both houses experienced a sustained rise when water vapour was generated at a rate of 70 g/h from 8:00 to 18:00 under the W-period 3 mode. Accordingly,increased over a certain period (Fig. 5c2). When the vapour generation amount doubled from 18:00 to 20:00 under the same mode, the rate of increase insignificantly increased, as shown by arrow (2) in Fig. 5c3. However,decreased because of the increasing indoorvalue due to space heating during this period. This phenomenon suggests thatalso significantly affects, which could also be observed under the W-period 1 mode, as shown by arrows (2) in Figs. 5a2 and 5a3. In contrast to the period from 8:00 to 18:00 under the W-period 3 mode, the increase inwas accompanied by a decline inunder the W-period 1 mode (arrows (1) in Figs. 5a2 and 5a3), although vapour was continuously generated at a rate of 70 g/h. The reason for this anomaly might be related to the influence of temperature on the equilibrated water content, which is discussed in Section 4.

Fig. 5 Hygrothermal parameters under different operation modes: (a1–a3) W-period 1; (b1–b3) W-period 2; (c1–c3) W-period 3
In these two LTS buildings, a relatively stable and comfortable indoor hygrothermal environment (Figs. 5b1 and 5b2) could be created by preventing the indoor environment from becoming extremely cold and humid, even though the indoor environment was not actively adjusted (i.e., W-period 2). Space heating could be considered optional if the requirements for the indoor hygrothermal environment are satisfied, which suggests that LTS buildings may have considerable potential for saving energy.
3.2 Heat and moisture transfer process within the envelope
Fig. 6 shows thevalue of each layer of the two buildings under the S-AC mode. A large amount of water vapour was transferred inwards. Moreover, the decline inattributed to the cooling system also resulted in a highvalue of the materials on the inner side. So, an upward trend in thevalue was observed from the OSB mineral wool to the gypsum board.
A difference could also be observed between the northward wall and the southward wall. Comparing Figs. 6a and 6c with Figs. 6b and 6d, thevalues of the inner materials of the S1 site reached a higher state than those of the N1 site. On the one hand, more vapour was transferred through the southward wall due to a bigger gradient ofand. On the other hand, thevalue and saturated water vapour pressure on the inner side of the southward wall differed slightly from those on the northward wall. Therefore, thevalue of the materials on the inner side of the southward wall increased. Besides, the outer materials would easily be influenced by the outdoor environment. The outer materials on the S1 site had lowervalues than those on the N1 site due to solar radiation. But moisture accumulation on the surface of the wall caused by wind-driven rain could also contribute to the extremely highvalues of the exterior materials.
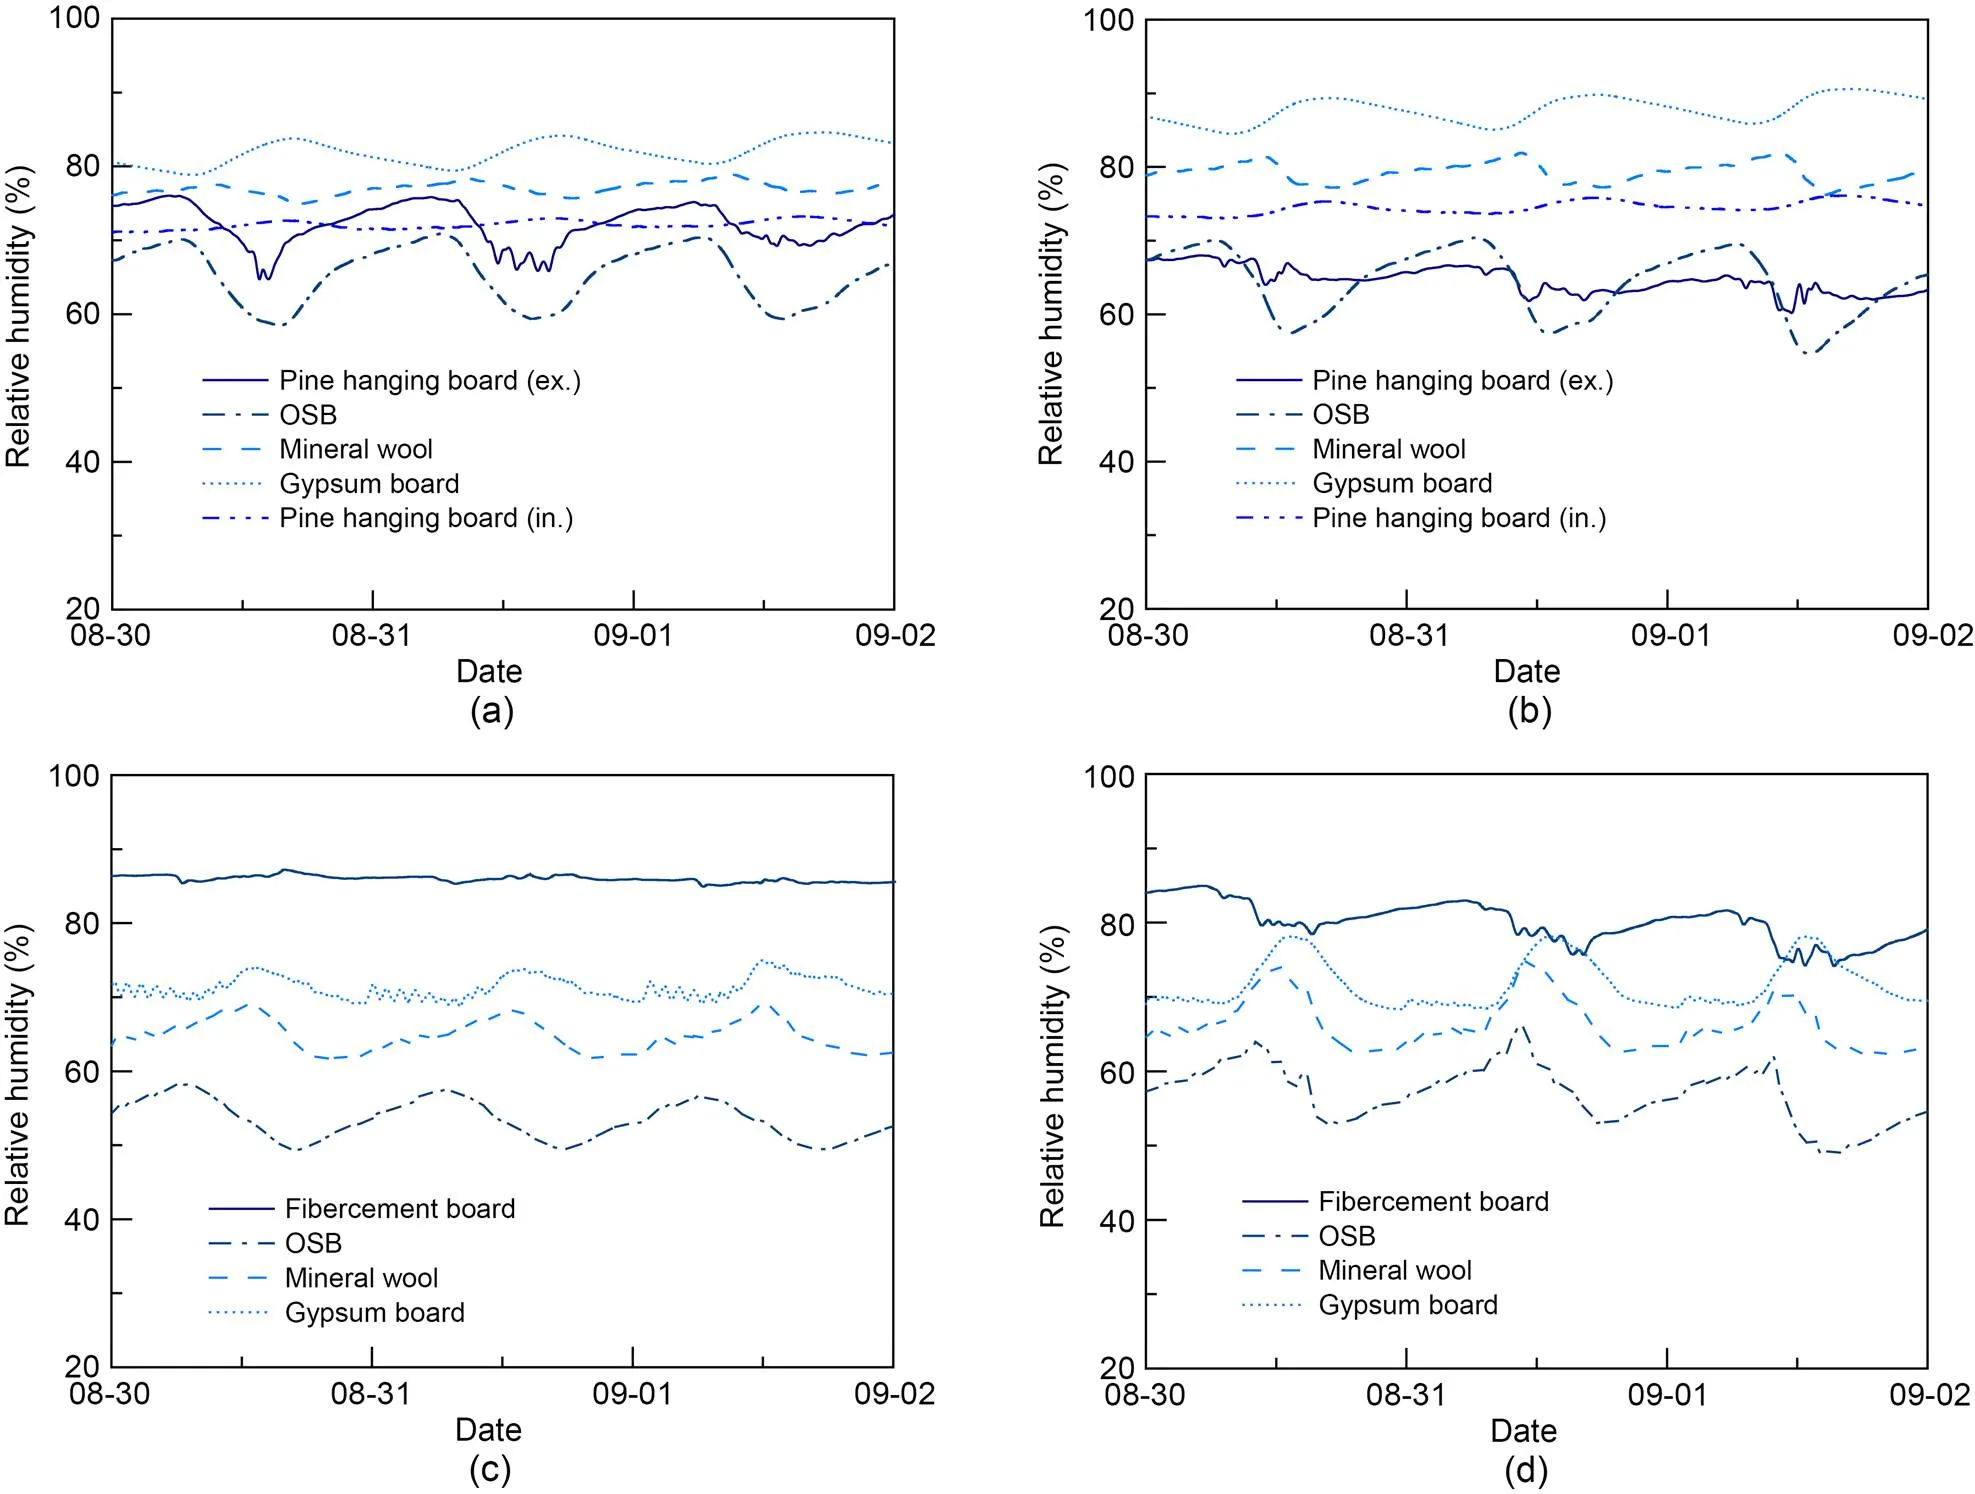
Fig. 6 Relative humidity in each layer in summer: (a) H1N1 site; (b) H1S1 site; (c) H2N1 site; (d) H2S1 site. ex.: exterior; in.: inner
Under the W-AC mode, both heat and moisture were transferred from inside to outside. From the mineral wool to the OSB layer, thevalue rose sharply while the temperature dropped. So, the OSB might carry the risk of a highvalue (Fig. 7) and the possibility of subsequent mould growth. Likewise, theof the OSB layer was higher than that of the other materials in typical operation modes (Fig. 8). Moreover, the value fluctuated notably, especially under the modes of W-periods 1 and 3 (as shown by the arrows in Fig. 8a). This occurred because the heat and moisture transfer intensity was high during the heating periods, and more water vapour was transferred to the OSB layer from the inside compared with the period without heating.
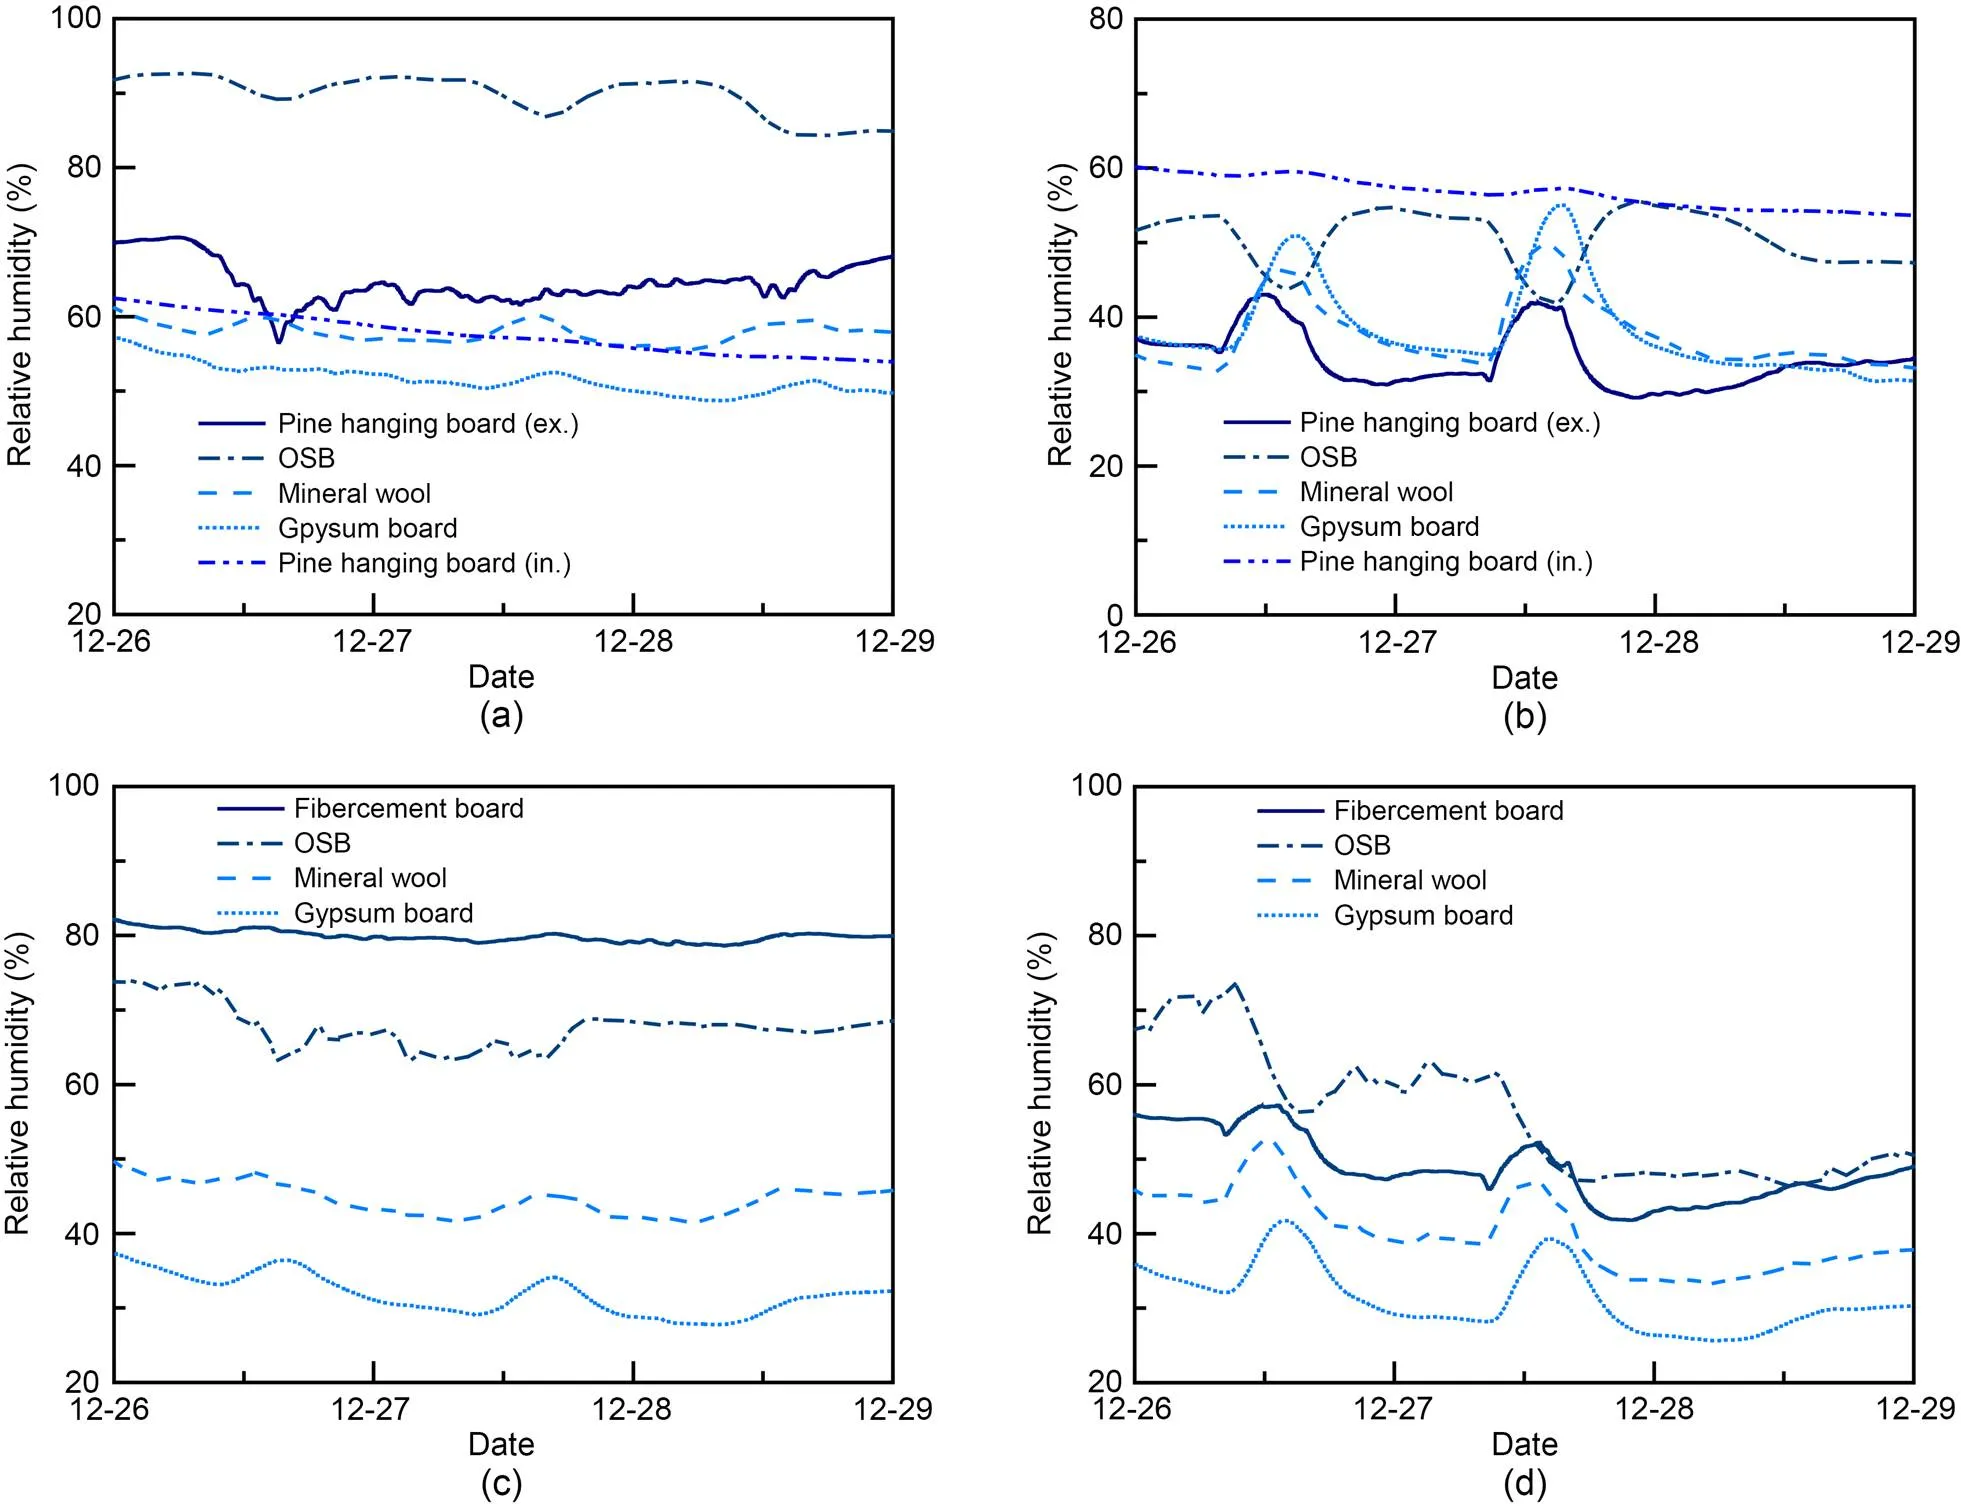
Fig. 7 Relative humidity in each layer in winter: (a) H1N1 site; (b) H1S1 site; (c) H2N1 site; (d) H2S1 site
Also, the overallvalue at the S1 site in these two buildings was lower than that at the N1 site due to the influence of solar radiation, and there was almost no risk of mildew on the southward wall under this mode.
3.3 Influence of the structure and materials on heat and moisture transfer
3.3.1Influence of materials
The wall of House 1 had slightly higher0andvalues (Section 2.2). Moreover, pine boards, the panels hung on both sides of its wall, have a characteristically highvalue, and can hold a large amount of water in a certain relative humidity (according to the WUFI-Plus database (WUFI, 1998), under avalue of about 40%, the equilibrium water content in pine board can reach 16.00 kg/m3, while that in gypsum board can reach only 3.33 kg/m3). Thus, the wall of House 1 had a much bigger0value and stronger moisture buffering ability. Therefore, firstly, the exterior wall of House 1 attained a notable ability to resist vapour transfer. Secondly, it could absorb or release more water vapour in response to a change ofvalue. While it helped to adjust the indoor hygrothermal environment, it also made a larger gradient ofand increased the intensity of moisture transfer (Fig. 9).
Thus, for the indoor environment, House 1 was more stable in the hygrothermal environment in most situations, with smaller fluctuations of,, andcompared with House 2, especially when both buildings were unoccupied. Because the exterior wall of House 2 had a lower ability to resist water vapour transfer, more vapour entered and exited the indoor space through the building envelope. Under the S-AC mode, the averageof House 2 was higher than that of House 1 in summer. For 78% of the time, thevalue of House 2 exceeded 70%. Under the W-AC mode, thevalue of House 2 was consistently lower than 30% (for 86% of the time), while the indoorvalue of House 1 could be maintained above 30%. Theandvalues of the innermost pine board of House 1 were also much higher than those of the indoor space. This showed that if thevalue of the indoor air continued to be maintained at a low level, the wall of House 1 still provided the ability to adjust the indoor environment to prevent the room from being overly dry.
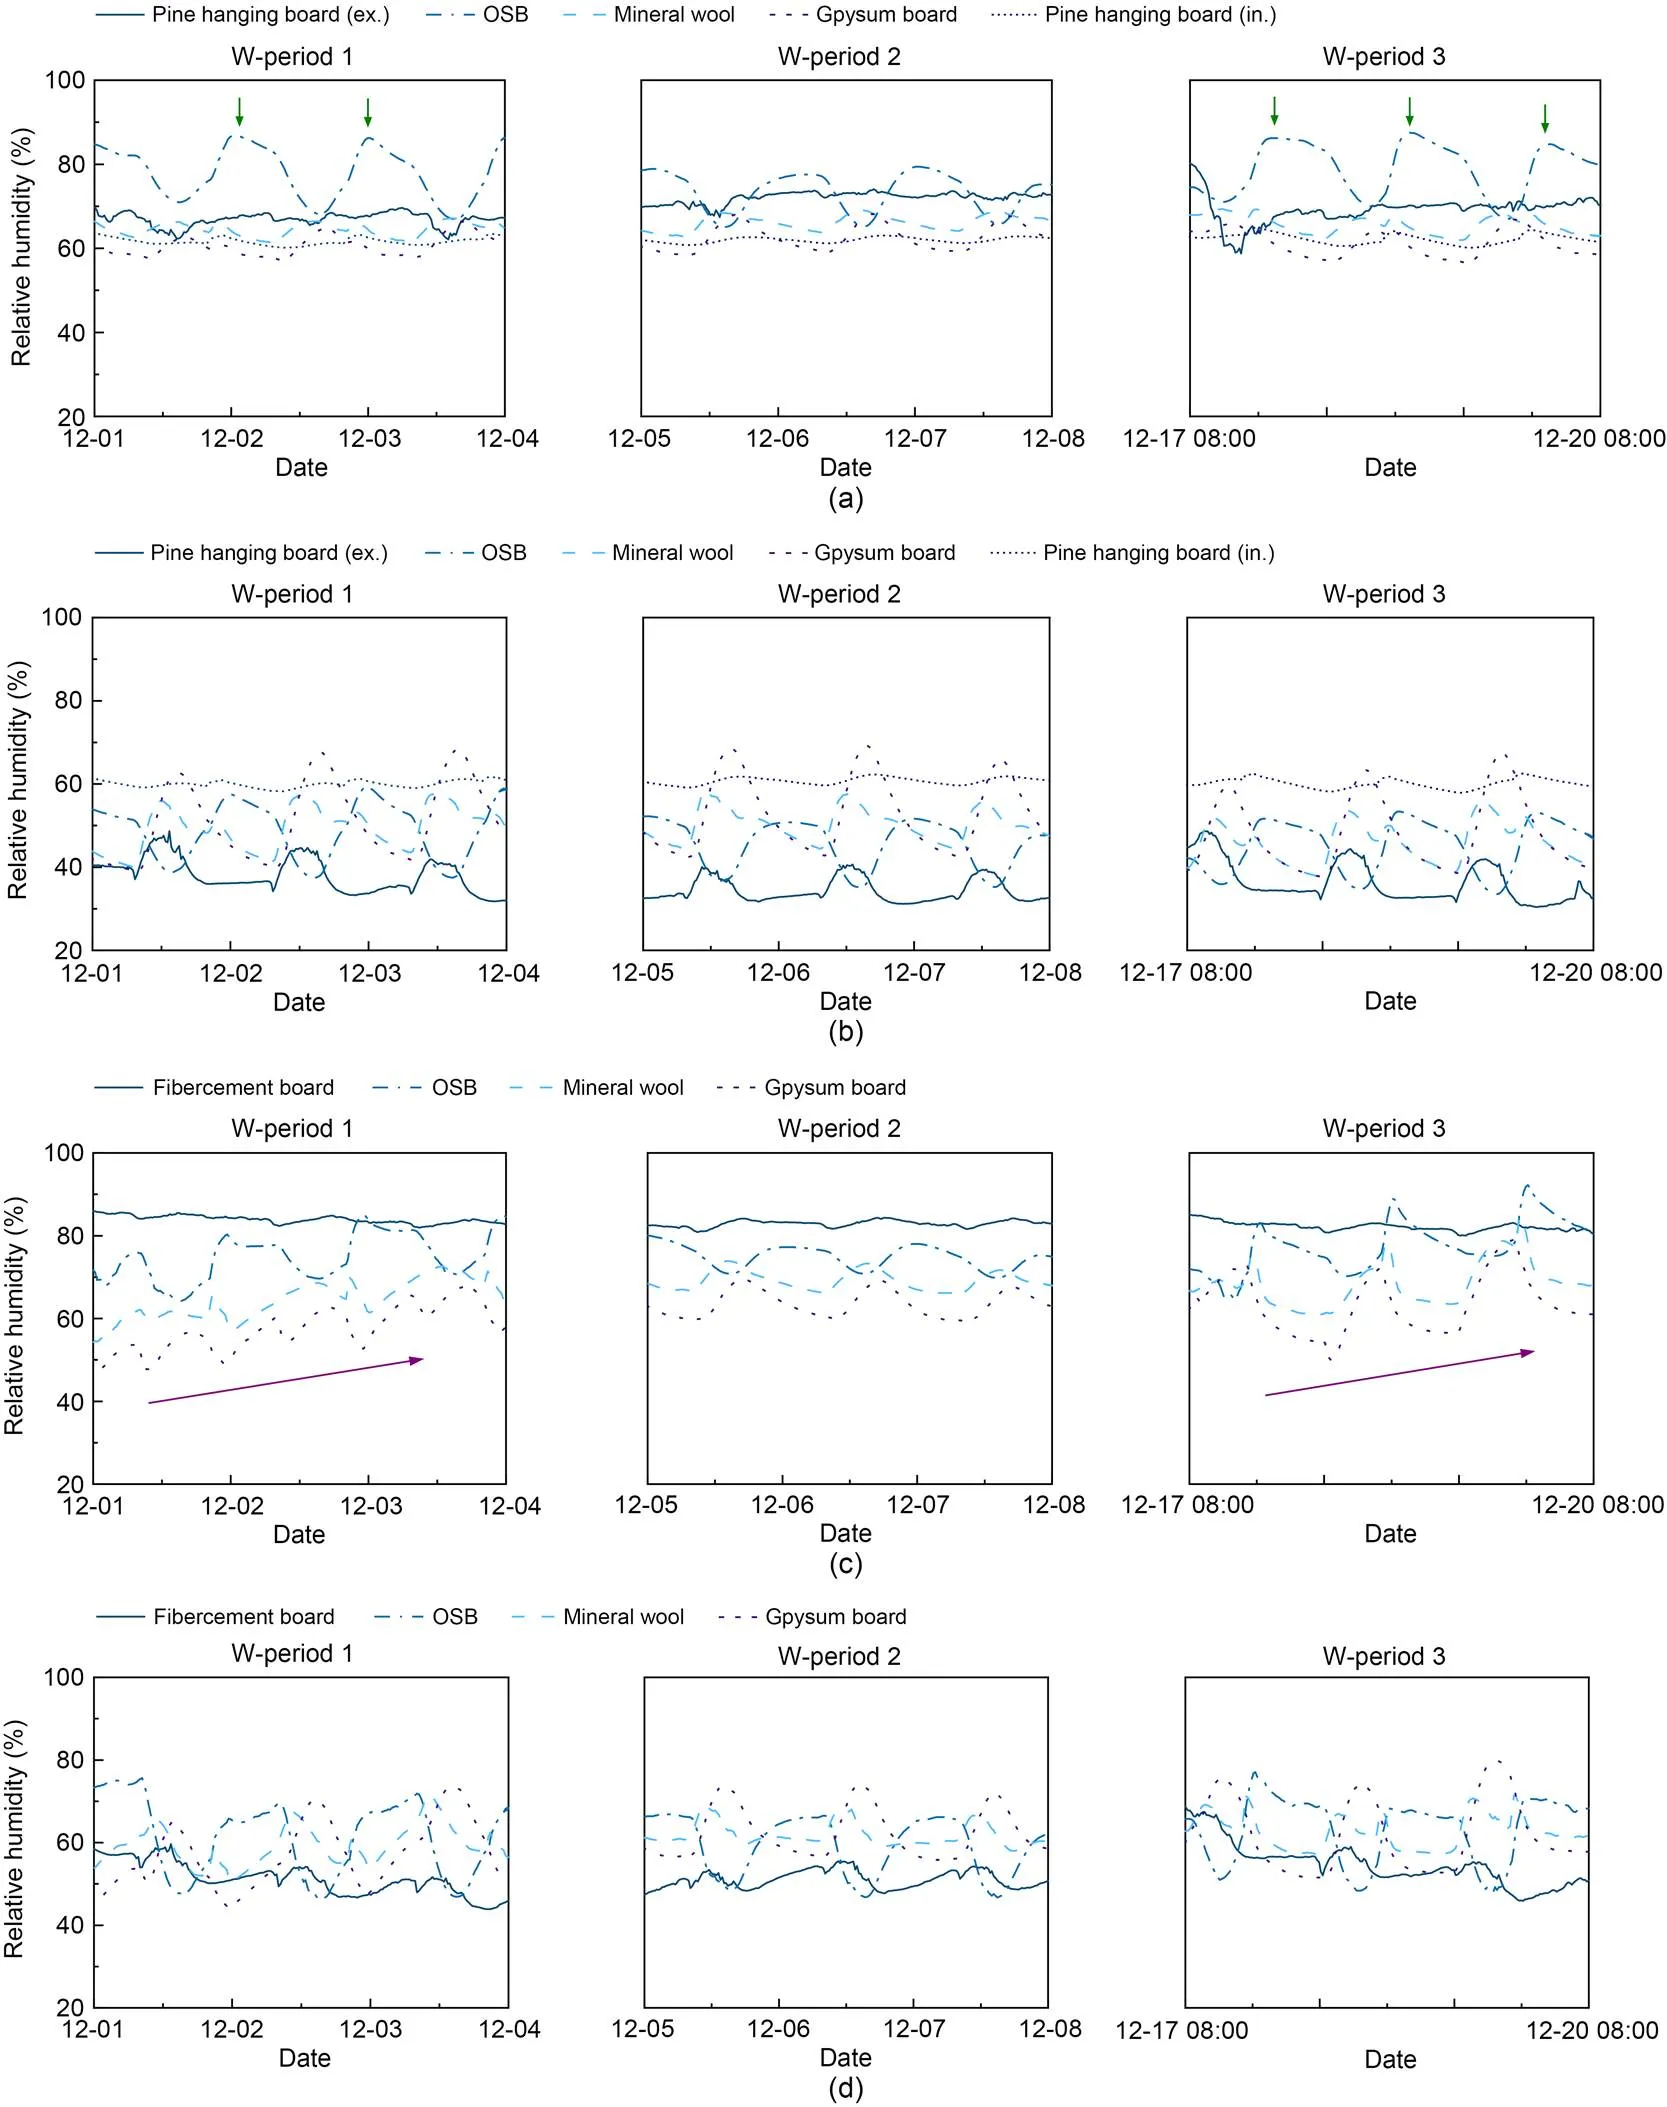
Fig. 8 Relative humidity of each material: (a) H1N1 site; (b) H1S1 site; (c) H2N1 site; (d) H2S1 site
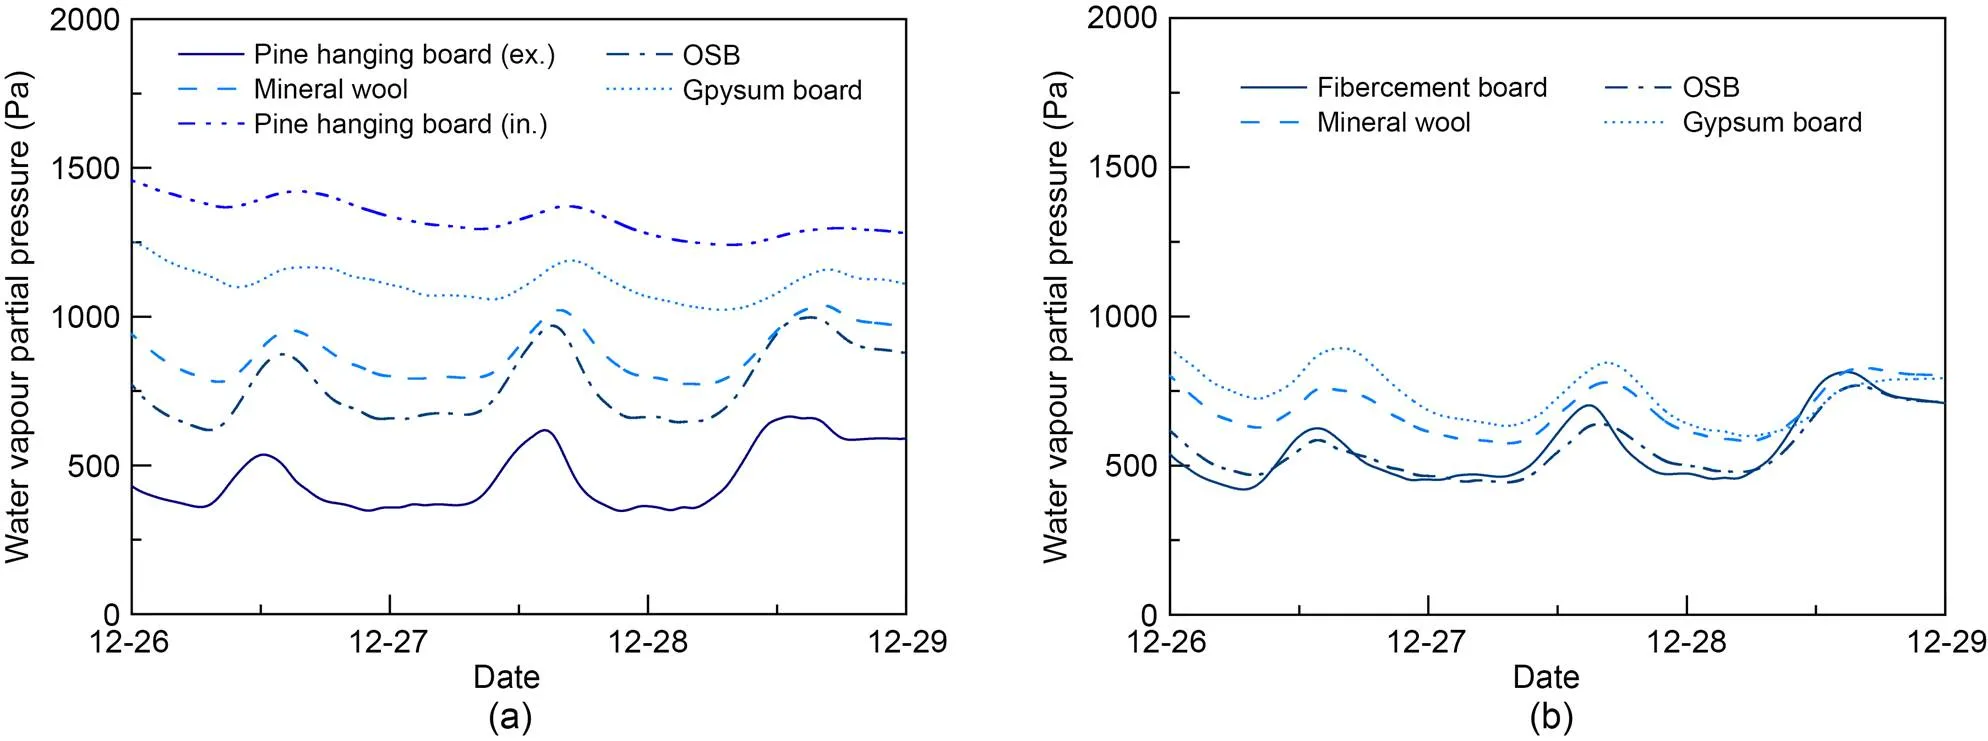
Fig. 9 Water vapour partial pressure of each material under the continuous energy-consumption mode in winter: (a) H1N1 site; (b) H2N1 site
However, in House 1, the characteristics of the pine board caused a different situation for moisture distribution within the building envelopes compared with House 2. The accumulation of vapour and highvalue in materials occurred in both summer and winter in House 1. Depending upon the direction of vapour transfer, OSB had a highvalue in winter and gypsum board had a highvalue in summer. In House 2, only OSB in winter had the same risk. But when vapour was continuously transferred from the inside to the outside through the envelope, the interior materials of House 2 could also suffer a rise in relative humidity (as shown by the arrows in Fig. 8c) due to their lower equilibrium water content to hold vapour. The vapour entered and left the center of the building envelope easily in House 2, causing thevalue of mineral wool to fluctuate greatly (Fig. 10).
Finally, the exterior pine board had mould growth visible on the surface six months after construction. This suggests that wooden boards might not be suitable in the HSCW zone, since this area is so rainy.
3.3.2Influence of the structure
The core parts of the building envelopes were almost the same in both LTS buildings, resulting in similar resistances of heat and moisture transfer (Fig. 2). Unlike other depth ranges within building envelopes, the depth ranges of 35–125 mm in House 1 and 40–130 mm in House 2 consisted of two materials, i.e., the mineral wool and SPF. Therefore, the hygrothermal transfer direction was not limited to being perpendicular to the surface of the envelopes and the multidimensional transmission deserves consideration. Therefore, the temperature and humidity data collected from measuring points on the mineral wool and SPF were specially selected to analyze the influence of structure and position on heat and moisture transfer within the building envelope.
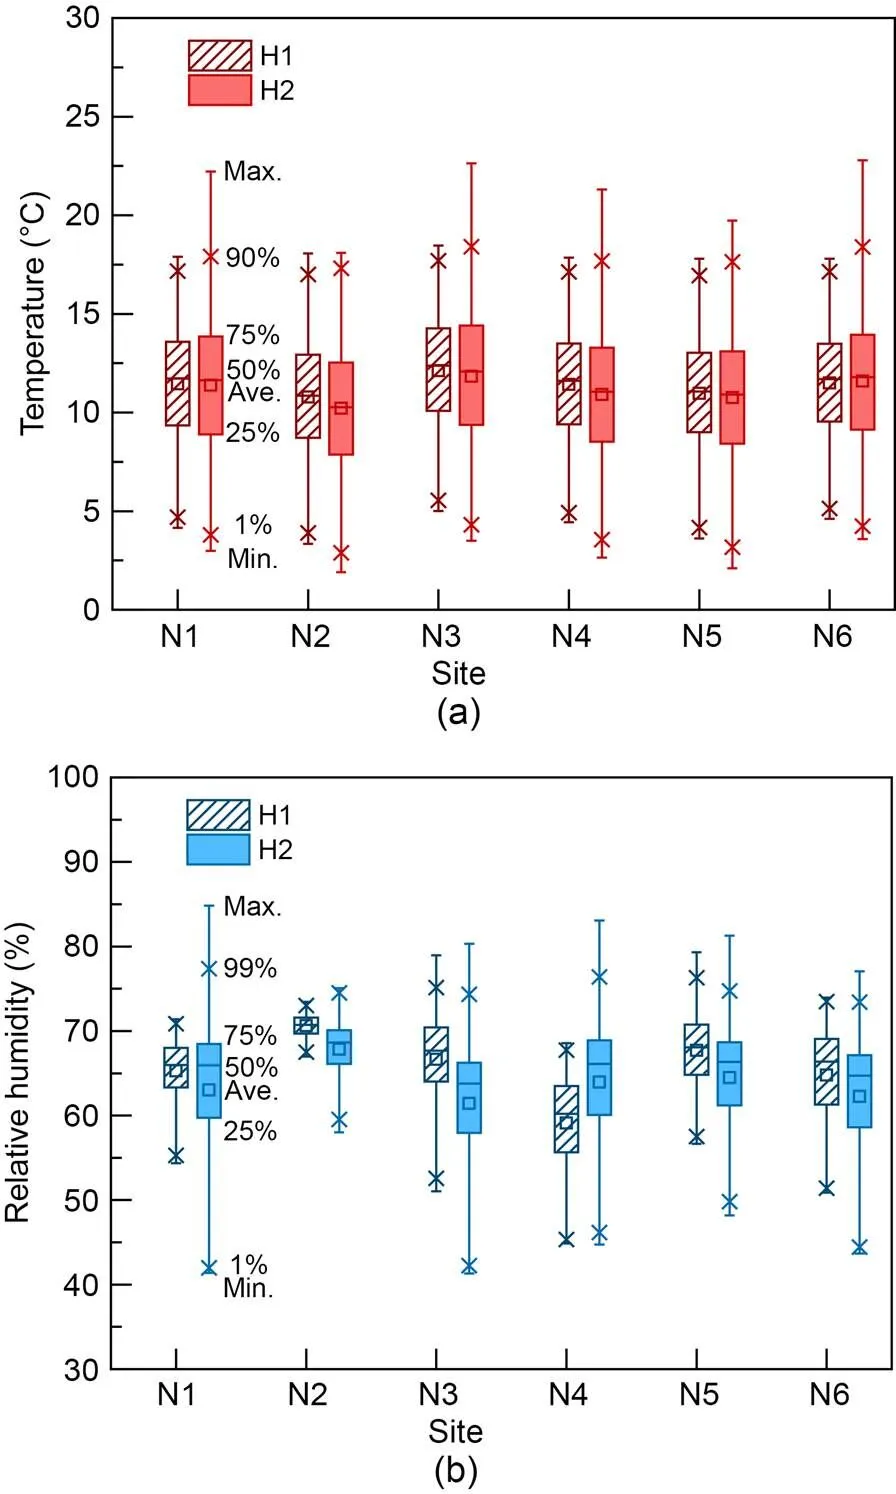
Fig. 10 Comparison of the temperature and relative humidity of mineral wool among the different sites on the northward wall: (a) temperature; (b) relative humidity. Max.: maximum; Ave.: average; Min.: minimum
As shown in Fig. 10a,generally showed a downward trend from the highest site to the lowest site (sites N3 to N1 to N4, i.e., from heights of 2600 to 1400 to 200 mm). Site N3 also attained the highestvalue among all six sites on the northward wall. This phenomenon was caused mainly by the upward movement of hot air, which has a low density. The N2/N5/N6 sites exhibited poor thermal insulation conditions. Located at the position of the thermal bridge (i.e. the SPF keel), the N2 site had the lowestvalue among all sites. Site N5 was located at the corner of the junction of the wall, where heat could easily dissipate towards the outside. Therefore, thevalue at this site was also low. However, the N6 site (below the window) differed slightly from the N1 site, indicating there were no additional risks of mould and rot for this site, at least for the layer of mineral wool.
Thevalues in the northern mineral wool layer are shown in Fig. 10b. Since the N3 site experienced a high temperature (Fig. 10a), the H2N3 site exhibited a lowervalue than the other sites. However, the H1N3 site attained a highvalue, and the possible reason will be discussed in Section 4.
3.4 Thermal comfort evaluation
The indoor air quality standard GB/T 18883–2002 (AQSIQ et al., 2002) suggests a certain range of indoorandvalues in an air-conditioned environment. In summer, the suggested range is 22–28 ℃ forand 40%–80% for. In winter, the suggested ranges forandare 16–24 ℃ and 30%–60%, respectively. Theassessment standard for healthy buildings T/ASC02–2016 (ASC, 2017) suggests that therange should be maintained within 30%–70% based on health and comfort considerations. According to the above standards, 22–28 ℃ forand 30%–70% forcould be regarded as appropriate ranges in summer, whereas 16–24 ℃ forand 30%–60% forcould be suitable in winter.
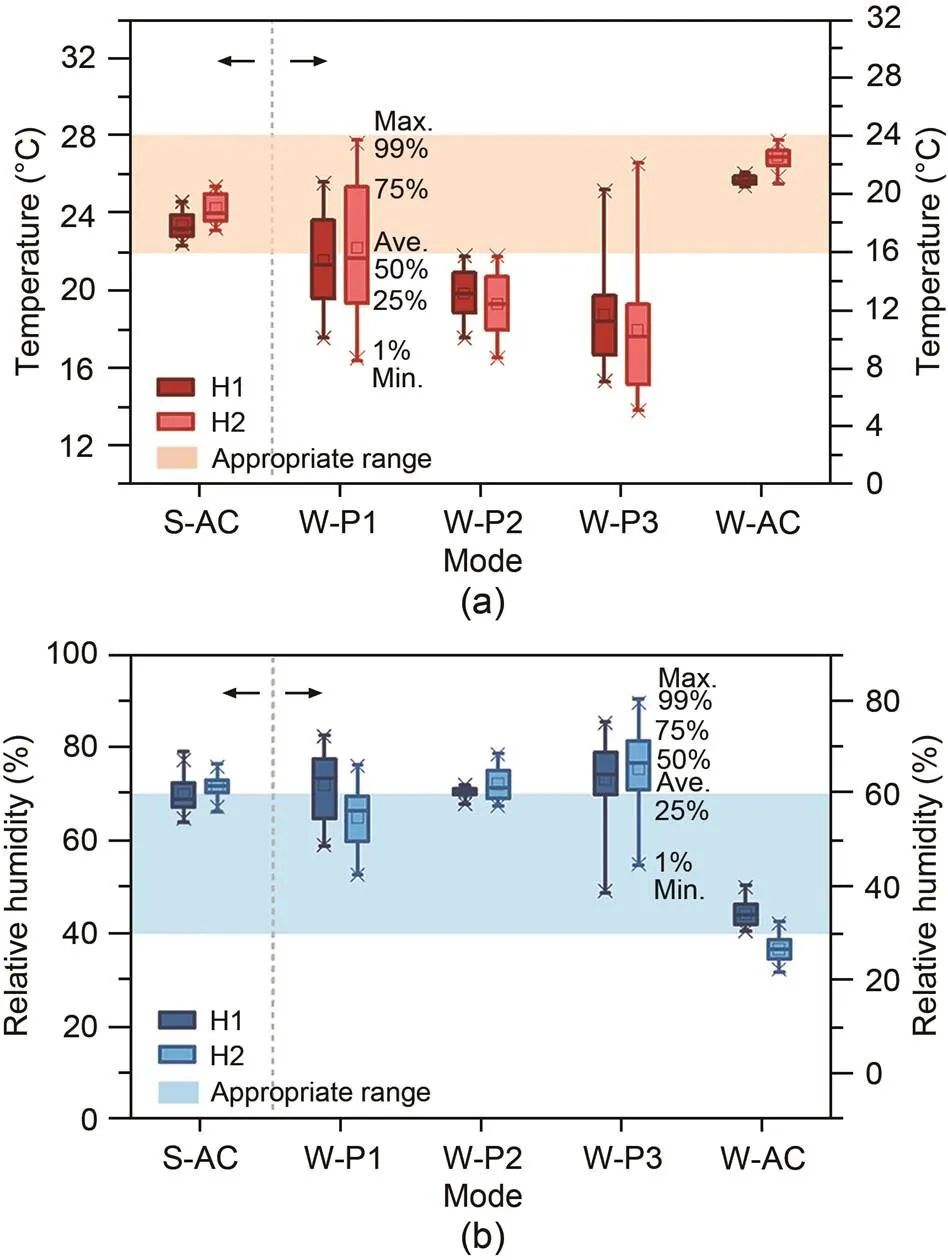
Fig. 11 Average temperature and relative humidity of the two buildings at each stage: (a) average temperature; (b) relative humidity. W-P1–W-P3: W-periods 1–3
Theandvalues and the appropriate ranges are shown in Fig. 11. Note that data were selected only from when the buildings were occupied under the modes of W-periods 1 and 3. As shown in Fig. 11a, thevalue of the indoor space fluctuated notably since the heating system was intermittently operated, i.e., W-periods 1 and 3. Compared to House 2, thevalue of House 1 remained more stable under all modes due to its highervalue. Moreover, its minimum value was higher when the air conditioner was not continuously operated, revealing a better performance in resisting the low temperature of the outdoor environment. However, when the air conditioner was operated intermittently, thevalue of House 1 rose more slowly than that of House 2, and taking longer to reach the lower limit of the suitable range.
As shown in Fig. 11b,was maintained within the appropriate range for a longer time in House 1 under the modes in which the behaviours of occupants were not considered (S-AC, W-AC, and W-period 2). However, when intermittent energy-consumption and ventilation were adopted (i.e.,W-periods 1 and 3),was rather similar under different modes in House 1, whereas it varied significantly in House 2. This phenomenon indicates that House 1 had a stronger ability to resist the influence of the environment and adjust the indoor humidity, but this was not always positive, especially when the outdoor environment was relatively suitable. This house type might be more favourable when adopting the continuous energy-consumption mode or the outdoor environments are harsh (i.e., extremely low temperature or unsuitable relative humidity level). Conversely, House 2 was more suitable for intermittent heating modes, though the small correspondingmay make the occupants feel cold after the heating system and ventilation are shut down. In other words, House 2 is preferred in suitable outdoor environments.
It could also be concluded that the intermittent energy-consumption modes (i.e.,W-periods 1 and 3) could effectively improve the hygrothermal comfort compared with the mode without active adjustment (W-period 2), although these modes could still not rival the continuous energy-consumption modes. Moreover,andwere more suitable under the W-period 1 mode than those under the W-period 3 mode. This was because of different behaviour patterns, i.e., the heating system was operated at the beginning of the occupied period, and ventilation was conducted after the occupants had left under the W-period 1 mode, whereas the buildings were ventilated at the beginning and heated at the end of the occupied period under the W-period 3 mode.
4 Discussion
The results indicated that the LTS walls had high0values. Previous studies of the thermal performance of LTS buildings compared with that of other types of buildings reported that the LTS buildings performed better. This was attributed to the much higher0value of the LTS envelope (Zhao, 2007; Wang, 2009). However, thevalue of LTS buildings (e.g. 2.05 and 1.89 in this study) can be much smaller, even if the0is almost the same. For example, a brick wall with exterior expanded polystyrene board (EPS) insulation exhibits an0value of 2.81 m2·K/W, and thevalue can reach 10.99 (parameters of the materials were selected from the WUFI-Plus database (WUFI, 1998)). Therefore, though the0value of the LTS envelope can meet the requirements of nearly zero energy buildings in the HSCW zone, there is still the problem of insufficient thermal stability.
The results of experiments showed the changes ofandfor both the indoor space and exterior walls, revealing that the wall construction type and operation mode of the occupants critically influenced the hygrothermal environment. However, note that the setting of the attic could also influence the indoor environment.
From 23:00 to 8:00 the next day under the W-period 1 mode and from 10:00 to 18:00 under the W-period 3 mode, the vapour generation rate reached 70 g/h, and there was no need for space heating (Fig. 5). However, as the arrows (1) show, though thevalue increased in both periods, thevalue decreased under the W-period 1 mode, but rose under the W-period 3 mode. This phenomenon may be related to moisture transfer from the attic space. Previous studies mentioned that wood materials store less moisture at high temperatures than at low temperatures (Poyet and Charles, 2009; Bjarløv et al., 2016). When thevalue of the attic rose due to solar radiation during the daytime, moisture migrated from the wood material into the attic space and then transferred into the indoor space as an additional moisture source. Therefore, the moisture source originating from the attic and the vapour generated by the occupants became superimposed during 10:00–18:00 under the W-period 3 mode and exceeded the amount transferred outwards through the exterior wall, which led to the increment in.
This phenomenon was also observed when there was neither vapour generation nor ventilation (from 10:00 to 20:00 under the W-period 1 mode and from 20:00 to 8:00 the next day under the W-period 3 mode), as indicated by the arrows (3) in Figs. 5a2, 5a3, 5c2, and 5c3.andboth increased under the W-period 1 mode due to moisture transfer from the attic, but decreased under the W-period 3 mode. For the same reason, the H1N3 site exhibited both higherandvalues than those at the sites below (Section 3.3.2). However, the H2N3 site did not show a highvalue. This may be because of the difference in materials on the inner side between these two buildings. When hot and humid air was transferred from the attic to the upper wall in House 2, the transferred air was more easily exchanged and mixed with the indoor air through the upper gypsum board since gypsum board exhibited a lowvalue. In House 1, the innermost pine board exhibited a highvalue, and much of the vapour could remain within the mineral wool layer and transfer downwards. This also yielded a smaller difference inbetween the different sites of House 2 than between the different sites of House 1. However, in this study, no RHT sensors were placed in the attic. This requires more in-depth research in the future.
The appropriateness of LTS buildings in other climate zones could also be inferred from the results of hygrothermal performance for both buildings. House 1 was more favourable when the outdoor environments were harsh and when the continuous energy-consumption modes were adopted. Therefore, it would perform well in cold and severely cold climate zones in maintaining a stable indoor environment. The moisture buffering capacity of the pine board could also improve the air quality of indoor space by avoiding low indoor humidity. However, a vapour barrier might have to be added between the gypsum board and the pine board to prevent intensive moisture transfer from the indoor space to the envelope. In hot summer and warm winter climate zones and temperate climate zones, House 2 would be more suitable because of its quick response to adjustment of ventilation. Research on the hygrothermal performance of the LTS buildings with local operation modes in different climate zones should be carried out in the future.
5 Conclusions
In this study, two LTS buildings with different hanging boards on their exterior walls were built and exposed to various operation modes. The hygrothermal characteristics of the exterior walls were calculated. Theandvalues of the indoor space and walls under the different operation modes were monitored.
In general, we found thatandvalues of the indoor space and walls were significantly affected by the behaviour of occupants. As well as thermal comfort, their behaviour also influenced mould growth risks. Thevalues in wood materials can be high when air conditioners are operated or in the presence of indoor moisture sources, and the drying effect of ventilation on the inner material can be limited by the outdoor environment. Besides, the OSB layer in both buildings exhibited a high relative humidity in winter, due to its largervalue compared with mineral wool.
In terms of the difference between the two envelopes, calculations revealed that House 1 attained a slightly better thermal insulation performance. Also, the0of the exterior wall of House 1 was much higher than that of House 2, and the moisture buffer capacity was increased by the additional pine board on the interior side. Therefore, the indoorandfluctuations in House 1 were smaller than those in House 2. The differences in the hygrothermal characteristics further influenced the thermal comfort of occupants. The exterior wall of House 1 attained a higher resistance to changes inand;when the indoor and outdoorandvalues were relatively unsatisfactory, a better adjustment ability could be obtained. However, House 2 achieved a short response time when the heating system was intermittently operated, so it could quickly reach the set temperature. The materials with the highest relative humidity in the exterior wall of House 1 differed between summer and winter due to the difference in the moisture transfer direction, i.e., in summer, the southward gypsum board exhibited the highest relative humidity, while in winter, this was observed for the northern OSB layer, both directly in contact with mineral wool.
For further optimization, attention should be focused on moisture accumulation in materials on both sides close to mineral wool as there may be insufficient airflow due to the small thickness of the air layer in the current structure. Also, it should be acknowledged that wood board is not suitable as the outmost hanging board in the HSCW zone with a rainy climate.
This work is supported by the National Natural Science Foundation of China (No. 51978623).
Wanqing XU designed the experiment, processed the corresponding data, and wrote the first draft of the manuscript; Yucong XUE helped to organize and revise the manuscript; Jiang LU was responsible for project administration and supervision; Yifan FAN and Xiaoyu LUO were responsible for supervision.
Wanqing XU, Yucong XUE, Jiang LU, Yifan FAN, and Xiaoyu LUO declare that they have no conflict of interest.
Adekunle TO, Nikolopoulou M, 2016. Thermal comfort, summertime temperatures and overheating in prefabricated timber housing., 103:21-35. https://doi.org/10.1016/j.buildenv.2016.04.001
Al-Saadi SN, Al-Jabri KS, 2020. Optimization of envelope design for housing in hot climates using a genetic algorithm (GA) computational approach., 32:101712. https://doi.org/10.1016/j.jobe.2020.101712
AQSIQ (General Administration of Quality Supervision, Inspection and Quarantine of the People’s Republic of China), MOH (Ministry of Health of the People’s Republic of China), SEPA (State Environmental Protection Administration), 2002. Indoor Air Quality Standard, GB/T 18883–2002. National Standards of the People’s Republic of China (in Chinese).
ASC (The Architectural Society of China), 2017. Assessment Standard for Healthy Building, T/ASC 02–2016. ASC, China (in Chinese).
Bjarløv SP, Johnston CJ, Hansen MH, 2016. Hygrothermal conditions in cold, north facing attic spaces under the eaves with vapour-open roofing underlay in a cool, temperate climate., 95:272-282. https://doi.org/10.1016/j.buildenv.2015.09.009
BP, 2020. Statistical Review of World Energy. https://www.Bp.com/statisticalreview
Brambilla A, Gasparri E, 2020. Hygrothermal behaviour of emerging timber-based envelope technologies in Australia: a preliminary investigation on condensation and mould growth risk., 276:124129. https://doi.org/10.1016/j.jclepro.2020.124129
Chen SQ, Wang XZ, Lun I, et al., 2020. Effect of inhabitant behavioral responses on adaptive thermal comfort under hot summer and cold winter climate in China., 168:106492. https://doi.org/10.1016/j.buildenv.2019.106492
Fei BH, Wang G, Ren HQ, et al., 2002. Wood structural houses in China: an analysis of advantages and disadvantages., 16(5):6-9 (in Chinese). https://doi.org/10.19455/j.mcgy.2002.05.002
Fu HY, Ding YW, Li MM, et al., 2020. Research on thermal performance and hygrothermal behavior of timber-framed walls with different external insulation layer: insulation cork board and anti-corrosion pine plate., 28:101069. https://doi.org/10.1016/j.jobe.2019.101069
Ge J, Li SM, Chen SQ, et al., 2021a. Energy-efficiency strategies of residential envelope in China’s hot summer–cold winter zone based on intermittent thermal regulation behaviour., 44:103028. https://doi.org/10.1016/j.jobe.2021.103028
Ge J, Xue YC, Fan YF, 2021b. Methods for evaluating and improving thermal performance of wall-to-floor thermal bridges., 231:110565. https://doi.org/10.1016/j.enbuild.2020.110565
Hameury S, Lundström T, 2004. Contribution of indoor exposed massive wood to a good indoor climate: in situ measurement campaign., 36:281-292. https://doi.org/10.1016/j.enbuild.2003.12.003
He LS, 2015. Analysis of Energy Savings Produced by the Inside and Outside Insulating Compound System in Hot Summer and Cold Winter Areas: Based on Intermittent and Loculose Energy Use. MS Thesis, Zhejiang University, Hangzhou, China (in Chinese).
ISO (International Organization for Standardization), 2007. Building Components and Building Elements–Thermal Resistance and Thermal Transmittance–Calculation Method, ISO 6946:2007(E). ISO, Geneva, Switzerland.
Jiang DT, 2005. Study on the function and benefit calculation of manufacturing oxygen and fixing carbolic of forest., 19(2):19-21 (in Chinese). https://doi.org/10.3969/j.issn.1004-7743.2005.02.007
Khan NA, Bhattacharjee B, 2021. Thermal and noise insulation performance interaction of building envelope during building simulation optimization in tropical climates., 200:107948. https://doi.org/10.1016/j.buildenv.2021.107948
Latif E, Ciupala MA, Wijeyesekera DC, 2014. The comparative in situ hygrothermal performance of Hemp and Stone Wool insulations in vapour open timber frame wall panels., 73:205-213. https://doi.org/10.1016/j.conbuildmat.2014.09.060
Latif E, Lawrence RMH, Shea AD, et al., 2018. An experimental investigation into the comparative hygrothermal performance of wall panels incorporating wood fibre, mineral wool and hemp-lime., 165:76-91. https://doi.org/10.1016/j.enbuild.2018.01.028
Li Y, Fazio P, Rao JW, 2012. An investigation of moisture buffering performance of wood paneling at room level and its buffering effect on a test room., 47:205-216. https://doi.org/10.1016/j.buildenv.2011.07.021
Liu XW, Chen YM, Ge H, et al., 2015. Determination of optimum insulation thickness for building walls with moisture transfer in hot summer and cold winter zone of China., 109:361-368. https://doi.org/10.1016/j.enbuild.2015.10.021
Lu J, Xue YC, Wang Z, et al., 2020. Optimized mitigation of heat loss by avoiding wall-to-floor thermal bridges in reinforced concrete buildings., 30:101214. https://doi.org/10.1016/j.jobe.2020.101214
Ma KW, 2019. Study on Carbon Emissions Calculation and Carbon Reduction Strategy of Office Buildings in Cold Regions. MS Thesis, Xi’an University of Architecture and Technology, Xi’an, China (in Chinese).
Meng X, Luo T, Gao YN, et al., 2018. Comparative analysis on thermal performance of different wall insulation forms under the air-conditioning intermittent operation in summer., 130:429-438. https://doi.org/10.1016/j.applthermaleng.2017.11.042
MOHURD (Ministry of Housing and Urban-Rural Development of the People’s Republic of China), 2010. Design Standard for Energy Efficiency of Residential Buildings in Hot Summer and Cold Winter Zone, JGJ 134–2010. National Standards of the People’s Republic of China (in Chinese).
MOHURD (Ministry of Housing and Urban-Rural Development of the People’s Republic of China), 2014. Drawing Collection for National Building Standard Design: Wooden Structure Building, GJBT–1303. National Standards of the People’s Republic of China(in Chinese).
MOHURD (Ministry of Housing and Urban-Rural Development of the People’s Republic of China), 2016. Code for Thermal Design of Civil Building, GB 50176–2016. National Standards of the People’s Republic of China (in Chinese).
MOHURD (Ministry of Housing and Urban-Rural Development of the People’s Republic of China), AQSIQ (General Administration of Quality Supervision, Inspection and Quarantine of the People’s Republic of China), 2012. Evaluation Standard for Indoor Thermal Environment in Civil Buildings, GB/T 50785–2012. National Standards of the People’s Republic of China (in Chinese).
MOHURD (Ministry of Housing and Urban-Rural Development of the People’s Republic of China), SAMR (State Administration for Market Regulation), 2019. Technical Standard for Nearly Zero Energy Buildings, GB/T 51350–2019. National Standards of the People’s Republic of China (in Chinese).
Nasrollahzadeh N, 2021. Comprehensive building envelope optimization: improving energy, daylight, and thermal comfort performance of the dwelling unit., 44:103418. https://doi.org/10.1016/j.jobe.2021.103418
Poyet S, Charles S, 2009. Temperature dependence of the sorption isotherms of cement-based materials: heat of sorption and Clausius–Clapeyron formula., 39(11):1060-1067. https://doi.org/10.1016/j.cemconres.2009.07.018
Punhagui KRG, John VM, 2022. Carbon dioxide emissions, embodied energy, material use efficiency of lumber manufactured from planted forest in Brazil., 52:104349. https://doi.org/10.1016/j.jobe.2022.104349
Qiu WN, 2009. Study of Residential Energy Consumption for Yangtze River Area Based on Building Energy-Saving Season. MS Thesis, Chongqing University, Chongqing, China (in Chinese).
Ruan F, Qian XQ, Qian KL, et al., 2015. Research on energy efficiency design for residential building envelope under the actual energy consuming method in hot summer and cold winter zone., 31(10):112-116 (in Chinese). https://doi.org/10.13614/j.cnki.11-1962/tu.2015.10.19
Simonson CJ, Salonvaara M, Ojanen T, 2001. Improving Indoor Climate and Comfort with Wooden Structures. Technical Research Centre of Finland, Espoo, Finland.
Tsinghua University Building Energy Conservation Research Center, 2019. China Building Energy Efficiency Annual Development Research Report 2019. China Architecture & Building Press, Beijing, China (in Chinese).
Wang JY, Wu HY, Duan HB, et al., 2018. Combining life cycle assessment and building information modelling to account for carbon emission of building demolition waste: a case study., 172:3154-3166. https://doi.org/10.1016/j.jclepro.2017.11.087
Wang XH, 2009. Research on Energy-Efficiency in Light-Frame Wood Residence and the Wall Heat Transfer. PhD Thesis, Chinese Academy of Forestry, Beijing, China (in Chinese).
Wessberg M, Vyhlídal T, Broström T, 2019. A model-based method to control temperature and humidity in intermittently heated massive historic buildings., 159:106026. https://doi.org/10.1016/j.buildenv.2019.03.024
WUFI, 1998. WUFI-Plus: Wärme Und Feuchte Instationär-Plus. Version 3.2, User’s Manual. Fraunhofer Institute for Building Physics, Munich, Germany (in German).
Xu CC, Li SH, Zou KK, 2019. Study of heat and moisture transfer in internal and external wall insulation configurations., 24:100724. https://doi.org/10.1016/j.jobe.2019.02.016
Xu LY, Liu JJ, Pei JJ, et al., 2013. Building energy saving potential in hot summer and cold winter (HSCW) zone, China—influence of building energy efficiency standards and implications., 57:253-262. https://doi.org/10.1016/j.enpol.2013.01.048
Yoro KO, Daramola MO, 2020. CO2emission sources, greenhouse gases, and the global warming effect.: Rahimpour MR, Farsi M, Makarem MA (Eds.), Advances in Carbon Capture. Woodhead Publishing, Oxford, UK, p.3-28. https://doi.org/10.1016/B978-0-12-819657-1.00001-3
You SJ, Li WQP, Ye TZ, et al., 2017. Study on moisture condensation on the interior surface of buildings in high humidity climate., 125:39-48. https://doi.org/10.1016/j.buildenv.2017.08.041
Yu YK, 2009. The Current Situation and Tendency of Urban Architectural Energy Consumption and the Countermeasures of Energy Saving in China. MS Thesis, Chang’an University, Xi’an, China (in Chinese).
Zeng J, Yu HY, Zhang DD, et al., 2018. Comparison of carbon emissions from structural building materials among timber construction and other types of construction., 32(1):28-32 (in Chinese). https://doi.org/10.19455/j.mcgy.20180107
Zhang MF, 2011. The Study on Energy Conservation of Timber Frame Residences in Chongqing. MS Thesis, Chongqing University, Chongqing, China (in Chinese).
Zhang XC, Xu J, Zhang XQ, et al., 2021. Life cycle carbon emission reduction potential of a new steel-bamboo composite frame structure for residential houses., 39:102295. https://doi.org/10.1016/j.jobe.2021.102295
Zhao Y, 2007. Research on the Thermal Characteristics of Modern Wood Framed Construction Wall. PhD Thesis, Chinese Academy of Forestry, Beijing, China (in Chinese).
题目:不同工况下两座轻型木结构建筑的湿热性能比较
作者:徐婉清1,2,薛育聪1,2,陆江3,樊一帆1,2,罗晓予1,2
机构:1浙江大学,建筑工程学院,中国杭州,310058;2浙江大学,海宁国际校区绿色建筑与低碳城市国际研究中心,中国嘉兴,314400;3浙江科技学院,土木与建筑工程学院,中国杭州,310023
目的:夏热冬冷地区气候全年高湿且居民采用间歇用能辅以通风的方式调节环境,由于建筑室内外环境条件复杂多变,轻型木结构建筑在该区的适用性尚有待研究。本文旨在研究用能季典型气象日及相应间歇用能工况下的室内环境及围护结构热湿传递特征,并探究在不同条件下围护结构不同朝向及不同位置热湿传递的差异,明确墙体冷凝霉变的关键位置,为工程运用提供参考。
创新点:1. 建立轻型木结构建筑足尺模型,并在墙体不同位置设置温湿度监测点进行实验与比较;2. 以夏热冬冷地区间隙用能工况作为实验条件,研究更加贴近真实情况。
方法:1. 通过文献调研梳理夏热冬冷地区居民用能及通风习惯,选择典型间歇工况作为实验条件。2. 运用温湿度自记仪、传感器对室内及墙体内部温湿度进行监测,通过对比不同时刻、位置的温湿度差异,总结轻型木结构建筑室内环境及围护结构材料在典型工况下的热湿特征。
结论:1. 一号建筑的总传热阻略高于二号建筑,总传湿阻大大高于二号建筑,其外墙对温湿度的变化具有更强的抵抗能力,在室内外环境不理想时能较好地保持与调节室内环境;而二号建筑在间歇用能和通风时相应较快。2. 岩棉层两侧的材料容易出现相对湿度较高的状况,夏季靠室内侧的石膏板具有高湿风险,而冬季靠室外侧的定向刨花板(OSB)层具有高湿风险。
关键词:轻型木结构建筑;现场试验;典型工况;室内环境;热湿传递
https://doi.org/10.1631/jzus.A2200536
Revision accepted Apr. 7, 2023;
Crosschecked Oct. 7, 2023
© Zhejiang University Press 2024
Nov. 8, 2022;
猜你喜欢
商品与质量(2021年43期)2022-01-18
建材发展导向(2021年19期)2021-12-06
河北画报(2021年2期)2021-05-25
河北画报(2021年2期)2021-05-25
中国惯性技术学报(2019年3期)2019-10-15
广东蚕业(2019年3期)2019-05-14
电子测试(2018年9期)2018-06-26
现代园艺(2018年2期)2018-03-15
现代园艺(2017年21期)2018-01-03
智能系统学报(2015年4期)2015-12-27
 Journal of Zhejiang University-Science A(Applied Physics & Engineering)2024年1期
- Journal of Zhejiang University-Science A(Applied Physics & Engineering)的其它文章
- Prediction of maximum upward displacement of shield tunnel linings during construction using particle swarm optimization-random forest algorithm
- Numerical modeling and experimental investigation of a two-phase sink vortex and its fluid–solid vibration characteristics
- Biomimetic microchannel network with functional endothelium formed by sacrificial electrospun fibers inside 3D gelatin methacryloyl (GelMA) hydrogel models
- Biotreatment of incinerated bottom ash and biocementation of sand blocks using soybean urease
- Effect of nitrile butadiene rubber hardness on the sealing characteristics of hydraulic O-ring rod seals