
A core-satellite self-assembled SERS aptasensor containing a “biological-silent region” Raman tag for the accurate and ultrasensitive detection of histamine
2024-02-15 07:59ChenChenYingfngZhngXimoWngXugungQioGeoffreyWterhouseZhixingXu
食品科学与人类健康(英文) 2024年2期
Chen Chen,Yingfng Zhng,Ximo Wng,Xugung Qio,Geoffrey I.N.Wterhouse,Zhixing Xu,
a Key Laboratory of Food Processing Technology and Quality Control in Shandong Province, College of Food Science and Engineering,Shandong Agricultural University, Tai’an 271018, China
b School of Chemical Sciences, The University of Auckland, Auckland 1142, New Zealand
Keywords: Surface-enhanced Raman spectroscopy Raman biological-silent region Aptamer Histamine detection Universal SERS-tag
ABSTRACT Herein,a novel interference-free surface-enhanced Raman spectroscopy (SERS) strategy based on magnetic nanoparticles (MNPs) and aptamer-driven assemblies was proposed for the ultrasensitive detection of histamine.A core-satellite SERS aptasensor was constructed by combining aptamer-decorated Fe3O4@Au MNPs (as the recognize probe for histamine) and complementary DNA-modif ied silver nanoparticles carrying 4-mercaptobenzonitrile (4-MBN) (Ag@4-MBN@Ag-c-DNA) as the SERS signal probe for the indirect detection of histamine.Under an applied magnetic f ield in the absence of histamine,the assembly gave an intense Raman signal at “Raman biological-silent” region due to 4-MBN.In the presence of histamine,the Ag@4-MBN@Ag-c-DNA SERS-tag was released from the Fe3O4@Au MNPs,thus decreasing the SERS signal.Under optimal conditions,an ultra-low limit of detection of 0.65 × 10⁻³ n g/mL and a linear range 10-2-105 ng/mL on the SERS aptasensor were obtained.The histamine content in four food samples were analyzed using the SERS aptasensor,with the results consistent with those determined by high performance liquid chromatography.The present work highlights the merits of indirect strategies for the ultrasensitive and highly selective SERS detection of small biological molecules in complex matrices.1 Yingfang Zhang and Chen Chen contributed equally to this work.*Corresponding authors.
1.Introduction
Histamine is hydrophilic vasoactive amine produced by the decarboxylation of histidine under the action of micro-organisms.It is present in meat,aquatic product and fermented foods[1].With prolonged storage or under the influence of external environment,histamine accumulates in food.Histamine levels are therefore considered an important indicator of food quality[2].Ingesting high levels of histamine can cause a range of health problems,including digestive problems,abnormal blood pressure or neurotoxicity,being life-threatening in some cases[3].Therefore,quantif ication of histamine in foods and beverages is of high importance for food safety and human health.
Traditional histamine detection techniques,such as highperformance liquid chromatography (HPLC),liquid chromatographytandem mass spectrometry (LC-MS/MS) and capillary electrophoresis,have limitations in practical applications[4-6].Although HPLC methods are eff icient and reliable,complicated sample derivatization processes are required before sample analysis[7].LC-MS/MS offers the advantage of accuracy,though analyses are time-consuming and require well-trained instrument technicians.Capillary electrophoresis allows good separation of histamine from related molecules,but with the disadvantage of low sensitivity.In general,the rapid quantif ication of histamine in foods remains a great challenge due to the following aspects: 1) low levels of histamine in foods,2) the low molecular weight of histamine,and 3) high complexity of the food matrix[8].Therefore,it is imperative to develop an ultrasensitive and selective method for accurately quantifying histamine in food samples that overcome these limitations.
Surface-enhanced Raman spectroscopy (SERS),is a highly sensitive and powerful analytical tool,that nowadays finds widespread application in bioanalytical sensing,environmental monitoring,disease diagnosis and food safety.SERS has been reported as a very useful technique for the detection of histamine[9-12].Traditional SERS analyses use “hot spots” created by plasmonic noble-metal nanoparticles (NPs) under laser excitation,a phenomenon which can enhance the SERS signal of analytes by many orders of magnitude[13-15].Undeniably,such SERS analysis shows incredible potential for exploring the particular vibrational modes in molecules,especially protein secondary structure[16-18].However,for the detection of small molecules (e.g.histamine) in complex sample matrices,the characteristic Raman peaks of the target analyte may overlap with those of other substances,complicating SERS analysis and analyte quantification.In recent years,the SERS-tag technology has attracted attentions,utilizing the SERS effect of plasmonic nanoparticles and the “fingerprint region” characteristics of a Raman reporter molecule(i.e.the SERS detection of a specific reporter molecule in the presence of the target analyte).This approach has been used successfully in the detection and imaging of various biochemical analytes,greatly reducing the effects of interferants on Raman detection[19-21].
Nevertheless,conventional SERS-tags that operate in the“fingerprint region” (i.e.give characteristic peaks for the Raman reporter molecule in the range 600-1 800 cm-1) may still be affected by the fluorescence background or matrix interference,compromising the accuracy of SERS analyses.Since most of the interfering substances have no Raman signals in the so-called “Raman biological-silent” region from 1 800 cm-1to 2 800 cm-1,researchers are now seeking Raman reporter molecules that possess characteristic peaks in “Raman biological-silent” region to improve the antiinterference performance of SERS-tag technology[22-23].The molecule 4-mercaptobenzonitrile (4-MBN) exhibits a Raman-active carbonnitrogen stretching mode at around 2 235 cm-1,making it an ideal Raman reporter molecule for anti-interference SERS analyses.
Whilst spherical silver and gold nanoparticles (Ag or Au NPs,respectively) are favored in SERS due to their relative ease of synthesis and good SERS performance[21,24],and functionalization of “bare noble-metal” NPs with SERS-tags can lead to premature shedding of the Raman reporter molecule,thus compromising the integrity of the SERS-tag and reliability of the SERS measurements[25].This motivates researchers to find ways of protecting the reporter molecules from the surrounding environment,ensuring that the reporter is only activated in the presence of the target analyte[20,26-27].
In biosensor development,aptamers are commonly used due to their high affinity for target analytes.Recently,Duan et al.[28]have been successfully screened histamine aptamer with good binding affinity,specificity and pH stability (dissociation constant of(11.620 ± 3.241) nmol/L).Meanwhile,a colorimetric detection method for histamine was established with this aptamer,achieving the limit of detection (LOD) of 1 ng/mL.Furthermore,the combined use of a SERS-tag and an aptamer has been shown to be very effective for the specific detection of targeted molecules[29-30],whilst also offering the advantage of low-cost detection of target analytes[31].Accordingly,we hypothesized that this same approach might be useful for the ultrasensitive SERS detection of histamine,motivating a detailed investigation.
In this study,we report an interference-free SERS sensing strategy for the detection of histamine at low concentrations in aqueous solutions and different foods.Magnetic Fe3O4@Au NPs modified by aptamer were prepared as the histamine recognize probe (Fig.1a),whilst complementary DNA (c-DNA) carrying a “biological-silent”region SERS-tag (Ag@4-MBN@Ag) served as the SERS signal probe (Fig.1b).By attaching the SERS signal probe to the surface of the recognize probe,a core-satellite SERS aptasensor was created(Fig.1c).In the presence of histamine,histamine was preferentially recognized and bound by the aptamer,resulting in detachment of the SERS signal probe (containing 4-MBN) from the recognize probe.Under an applied magnetic field,the core-satellite structure aggregated into an ideal SERS sensing platform with abundant “hot spots”.The intensity of the SERS signal at 2 235 cm-1due to the 4-MBN tag decreased as a function of the histamine concentration,thus allowing selective and rapid detection of histamine.Our experimental results validated this strategy,with the developed SERS aptasensor showing excellent histamine detection performance in a variety of foods.To the best of our knowledge,no previous SERS aptasensor based on magnetic nanoparticles operating in the “Raman biological-silent”region has yet been reported for histamine detection.
2.Materials and methods
2.1 Materials and reagents
Beer,syoyu,rice vinegar,kirschwasser and fish were purchased from RT-Mart (Tai’an,China) in February 2022.
Histamine,tyramine,L-tryptophan and dopamine (> 98%) were purchased from Yuanye Biological Technology Co.,Ltd.(Shanghai,China).Trichloroacetic acid,ethylene glycol,dansyl chloride acetone,HAuCl4·4H2O and ethanolamine were supplied by Shanghai Aladdin Biochemical Technology Co.,Ltd.(Shanghai,China).FeCl3·6H2O,polyvinylpyrrolidone (PVP,K30),11-mercaptoundecanoic acid (MUA),1-(3-dimethylaminopropyl)-3-ethylcarbodiimide hydrochloride (EDC),tris(2-carboxyethyl) phosphine (TCEP) and 4-MBN were obtained from Macklin Biochemical Technology Co.,Ltd.(Shanghai,China).Bovine serum albumin was purchased from Solarbio Technology Co.,Ltd.(Beijing,China).Cetyltrimethylammonium bromide (CTAB) was supplied by Beijing Biotopped Technology Co.,Ltd.(Beijing,China).Epigallocatechin-3-gallate (EGCG) and ascorbic acid (AA) were purchased from Sichuan Weikeqi Biological Technology Co.,Ltd.(Chengdu,China).Polyethylenimine (PEI,branched) and 2-(N-morpholine) ethane sulfonic acid (MES) were supplied by Sigma-Aldrich Trading Co.,Ltd.(Shandong,China).NaBH4was supplied by Tianjin Kemiou Chemical Reagent Co.,Ltd.(Tianjin,China).Dimethyl sulfoxide(DMSO),sodium carbonate,sodium hydroxide (NaOH),silver nitrate (AgNO3),sodium bicarbonate,acetone,sodium glutamate,sodium acetate,trisodium citrate and sodium chloride were purchased from Kaitong Chemical Reagent Co.,Ltd.(Tianjin,China).Tannic acid (TA) was supplied by Tianjin Basifu Chemical Trade Co.,Ltd.(Tianjin,China).Acetonitrile (> 99.9%) was obtained from Yuwanghetianxia Novel Material Co.,Ltd.(Shandong,China).Diethyl ether (> 99.5%) was purchased from Yantai Far East Fine Chemical Co.,Ltd.(Shandong,China).Filters (0.22-µm) were supplied by Keyilong Experimental Equipment Co.,Ltd.(Tianjin,China).Anhydrous ethanol,methanol,glacial acetic acid,n-hexane and hydrochloric acid were obtained from local suppliers and were analytical pure.Ultra-pure water was produced by an Aike instrument(Tangshi Kangning Technology Company,Chengdu,China) and was used throughout this work.Solutions of phosphate-buffered saline (PBS,pH 7.4) and PBS with 0.05% Tween-20 (PBST,pH 7.4) were prepared.
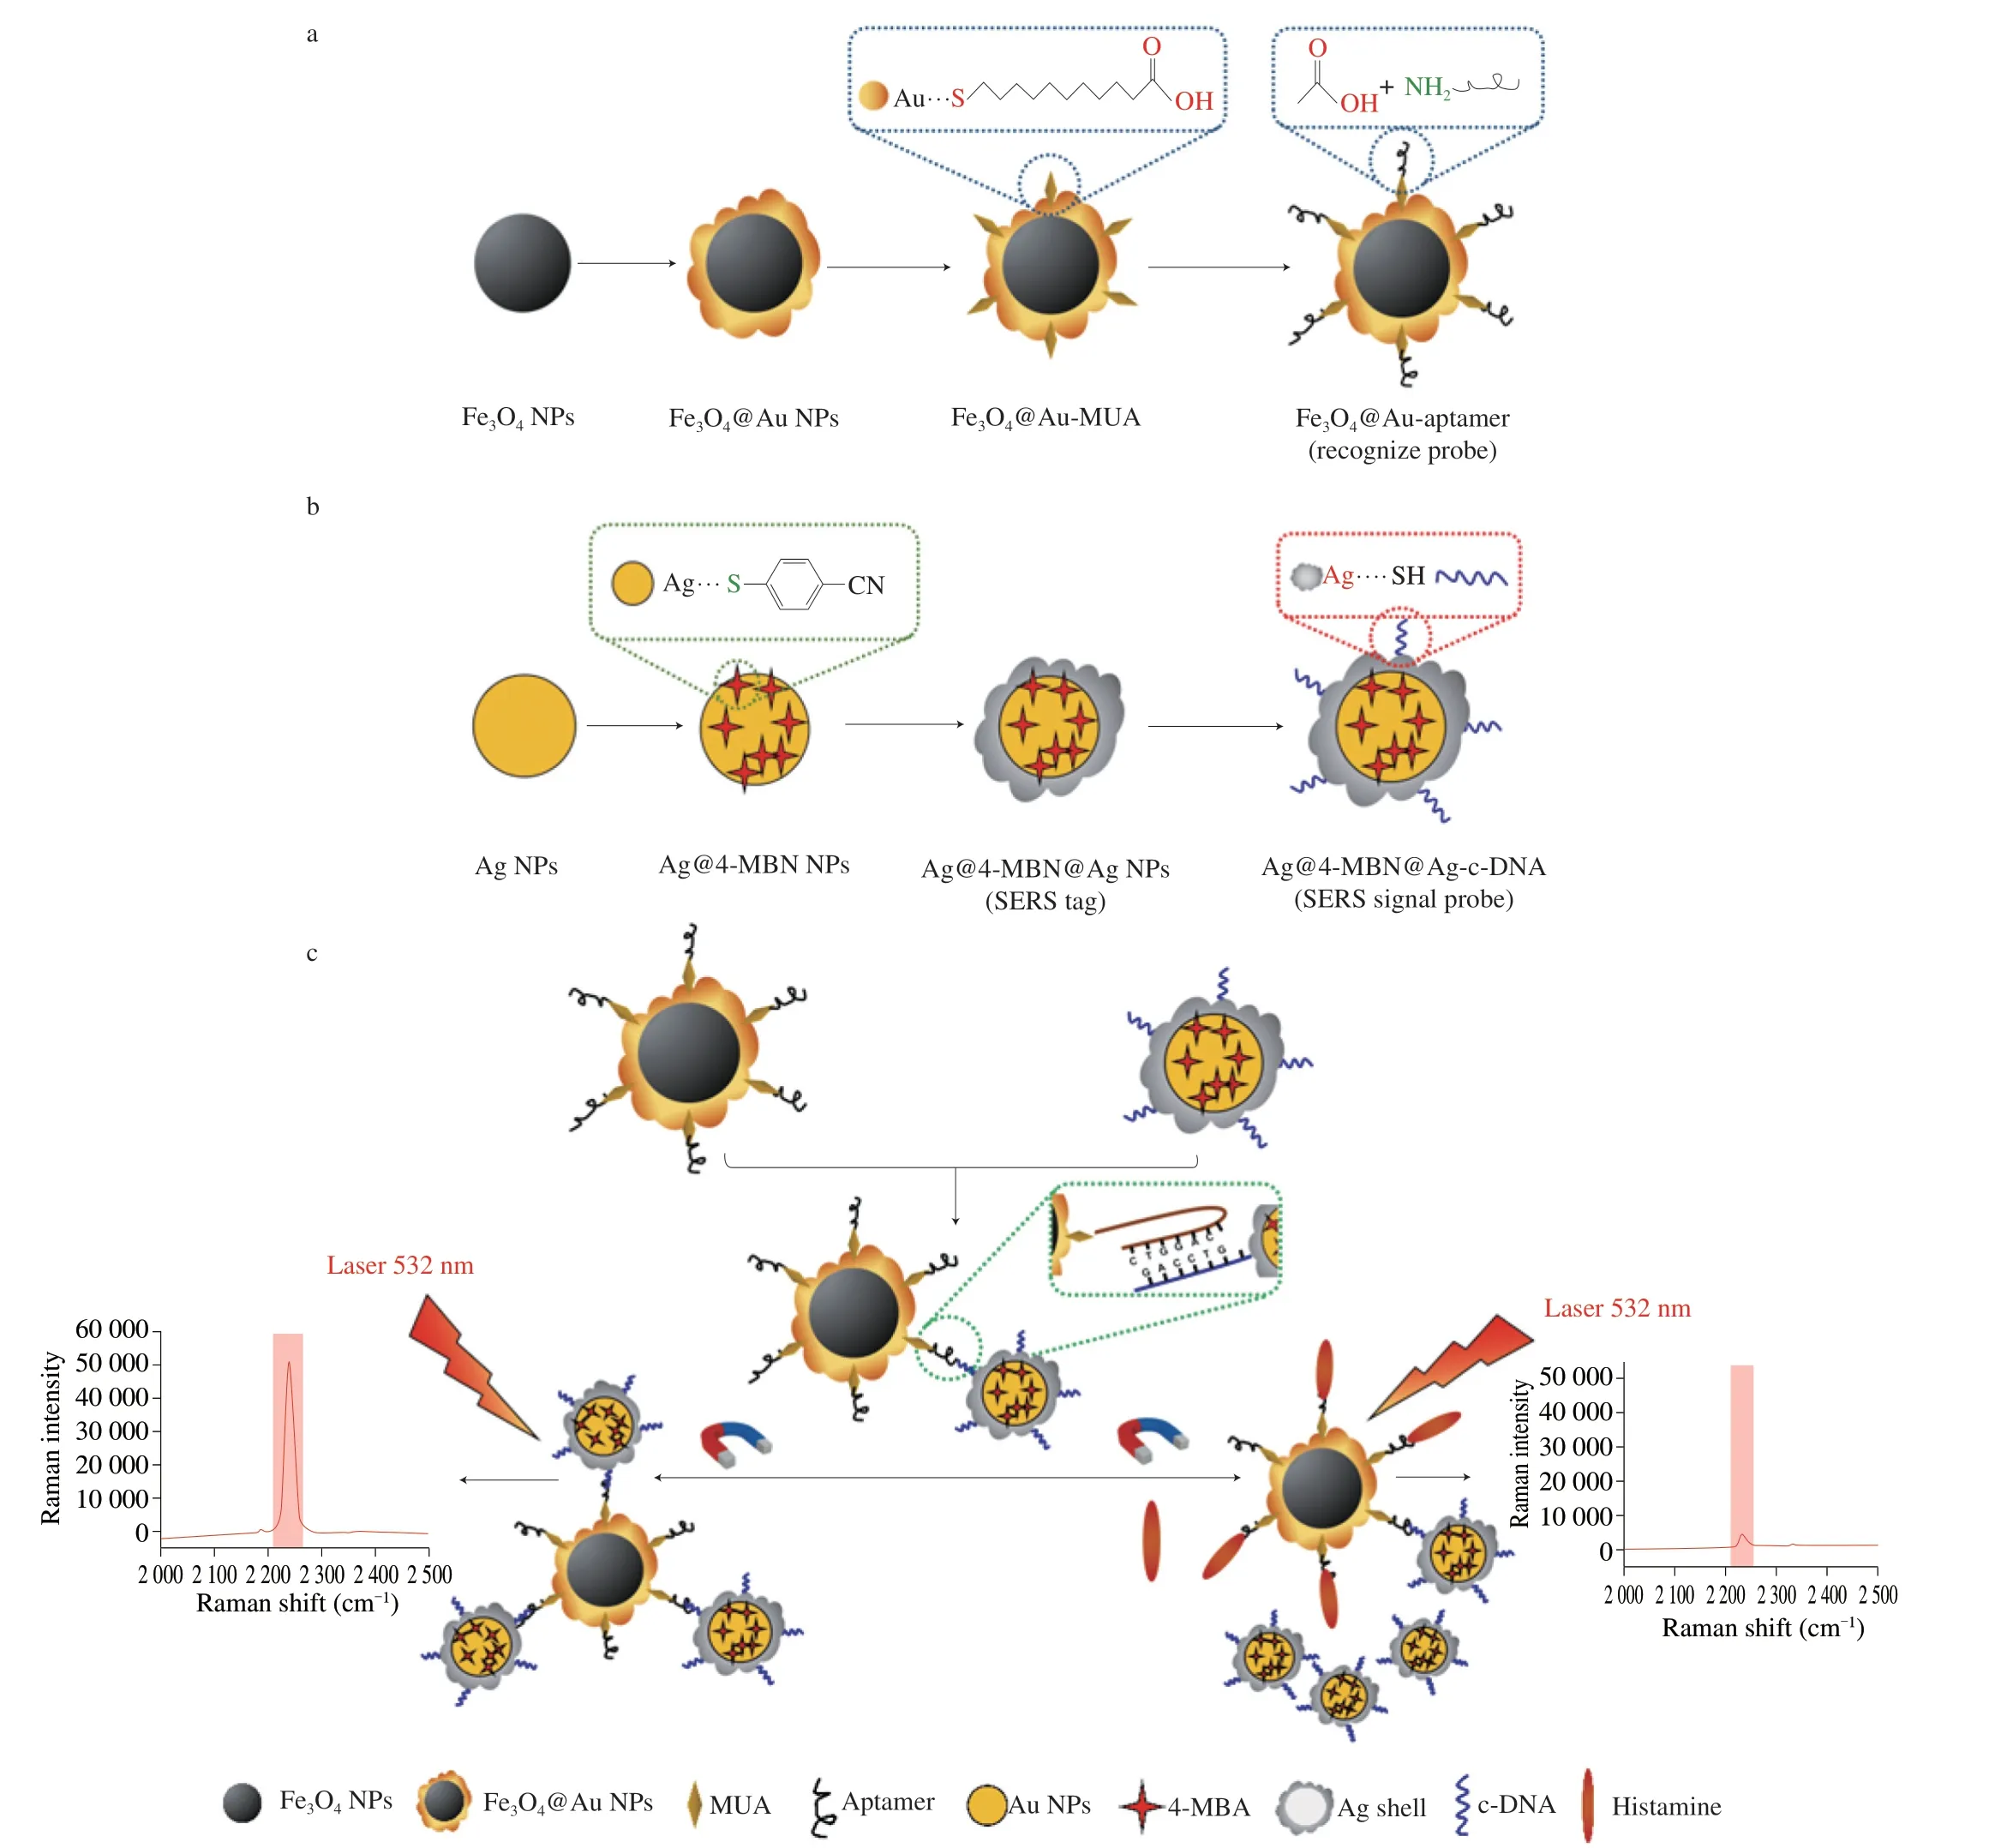
Fig.1 Schematic showing the fabrication of (a) Fe3O4@Au-aptamer MNPs and (b) Ag@4-MBN@Ag SERS-tag.(c) Histamine detection strategy used by the SERS aptasensor.
The histamine aptamer sequence was referenced to previous studies[28].The aptamer and the c-DNA chain used in this study were provided by Shanghai Sangon Biotech Co.,Ltd.(Shanghai,China).The sequences for each are shown in Table S1.
2.2 Apparatus
The morphologies of the synthesized materials were imaged using scanning electron microscopy (Sigma 500,ZEISS,Germany)and transmission electron microscopy (JEM-1400,JEOL,Japan).Ultraviolet-visible (UV-vis) absorption spectra were acquired on a UV-2700i Spectrophotometer (Shimadzu,Japan).Zeta potentials and dynamic light scattering size analyses of the prepared nanoparticles were performed on a Zetasizer-Nano-ZS (Malvern,U.K.).The X-ray diffraction pattern for synthesized materials was acquired on a D8advance diffractometer (Bruker,Germany).The energy dispersive spectroscopy (EDS) and element mapping were collected on a energy dispersive spectrometer (X-MaxN 80T,OXFORD,England).Histamine detection by the HPLC method used a HPLC system consisting of two pumps (LC-20AT),a C18reversed-phase column(4.6 mm × 250 mm,5 µm),and a UV detector (SPD-20A,Shimadzu,Japan).Mobile phase A was a 90% acetonitrile/10% mixture (0.01 mol/L ammonium acetate solution containing 1% acetic acid),and mobile phase B was a 10% acetonitrile/90% mixture (0.01 mol/L ammonium acetate solution containing 1% acetic acid).The detection wavelength was 254 nm,and the injection volume was 20 µL.The gradient elution procedure was shown in Table S2.The column temperature was 35 °C and the flow rate was 0.8 mL/min.Raman spectra were acquired on a DXR2xi Raman Imaging Microscope (Thermo,USA)equipped with a 50 × objective and a 532 nm laser.Spectra were acquired at a 5.0 s exposure time and 3.0 mW laser power.
2.3 Preparation of the superparamagnetic Fe3O4 NPs
Superparamagnetic Fe3O4nanoparticles were synthesized according to a literature method[32].Briefly,2.0 mmol of FeCl3·6H2O was dissolved in 20 mL of ethylene glycol under magnetic stirring.After stirring for 30 min,2.0 g of PVP was added,and the resulting solution then heated at 120 °C under a continuous flow of N2.After stirring at 120 °C for 1 h,1.5 g of sodium acetate was added to the solution and the heating stopped.After vigorously stirring for 30 min,the obtained homogeneous solution was transferred into a 25-mL teflon-lined stainless steel autoclave,then heated at 200 °C for 12 h.The obtained black product was washed three times with ethanol and then three times with water.Finally,the Fe3O4NPs product was dried in a vacuum at 60 °C for 12 h.
2.4 Preparation of the Fe3O4@Au magnetic NPs (MNPs)
2.4.1 Preparation of the Au seed solution
A seed solution containing gold nanoparticles of size around 3 nm was prepared according to a literature method[33].Briefly,0.5 mL of 24.3 mmol/L HAuCl4·4H2O was added to 50 mL of H2O under vigorously stirring,followed by the addition of 1.5 mL of a 1.0% (m/m)aqueous trisodium citrate solution.After stirring for 1 min,0.5 mL of an aqueous 0.075% (m/m) NaBH4solution was added,and the resulting mixture then stirred for 12 h at room temperature to obtain the Au seed solution.
2.4.2 Preparation of Fe3O4@Au MNPs
Monodisperse Fe3O4@Au MNPs were fabricated using a polyethylenimine-mediated seed growth strategy[19].Specifically,Fe3O4NPs (0.1 g) were added into 10 mL of an aqueous PEI solution(1.0 mg/mL) and the resulting dispersion sonicated for 15 min.The obtained Fe3O4@PEI NPs were washed with ultrapure water 5 times,then added to the previously prepared Au seed solution and the resulting dispersion sonicated for 30 min to form Fe3O4@PEI-Au seeds.The Fe3O4@PEI-Au seeds samples was collected by centrifugation,washed with water several times,then dried to a powder.Subsequently,Fe3O4@PEI-Au seeds (10 mg) were dispersed in 50 mL of an aqueous 0.1 mmol/L HAuCl4·4H2O solution,after which 0.5 mL of an aqueous hydroxylamine hydrochloride solution(100 mg/mL) was rapidly added and the mixture then sonicated for 5 min at 30 °C.Next,300 mg of PVP was added,after which the mixture was sonicated for another 15 min.Finally,the Fe3O4@Au MNPs product was collected using a magnet and washed 3 times with ultrapure water to remove any excess reagents.
2.5 Preparation of the Fe3O4@Au-aptamer (recognize probe)
The Fe3O4@Au-aptamer was prepared as follows.Firstly,10 mg of Fe3O4@Au MNPs were dispersed into 50 mL of an ethanolic MUA solution (30 µmol/L),followed by sonication for 60 min.The MUA-modified Fe3O4@Au MNPs were then collected by magnetic separation,after which they were dispersed in 500 µL of an aqueous MES buffer solution (0.1 mol/L,pH 5.5).Next,50 µL of an EDC solution (10 mmol/L in MES buffer) was added to activate the carboxyl groups.After shaking for 15 min at 37 °C,25 µL of NH2-modified aptamer (10 µmol/L) was added,and the resulting mixture shaken at 37 °C for 3 h.The aptamer-modified Fe3O4@Au MNPs were then incubated with 5 µL of ethanolamine for 1 h to block unreacted carboxyl groups.Finally,the Fe3O4@Au-aptamer was collected by magnetic separation,washed twice with PBS buffer,then stored in 10 mL of a 0.05% PBST buffer (10 mmol/L,pH 7.4) for further use.
2.6 Synthesis of the Ag@4-MBN@Ag SERS-tag
2.6.1 Preparation of quasi-spherical Ag NPs
Quasi-spherical Ag NPs were synthesized using polyphenol chemistry principles[21].Briefly,100 µL of TA (4%,m/m),10 µL of sodium carbonate (0.5 mol/L) and 200 µL of AgNO3(1%,m/m) were sequentially added into 5 mL of ultrapure water.After continuous shaking for 1 h,the dark brown Ag seeds produced were collected by centrifugation,washed three times with ultrapure water,and then finally and re-dispersed in 1 mL of ultrapure water.Next,25 µL of the Ag seed dispersion,50 µL of AgNO3solution (1%,m/m) and 200 µL of an aqueous EGCG solution (10 mmol/L) were successively added to 4.75 mL of ultrapure water.After shaking for 1 h,the gray-yellow quasi-spherical Ag NPs were collected by centrifugation,washed once with ultrapure water,redispersed in 5 mL of ultrapure water,then stored in a refrigerator at 4 °C for later use.
2.6.2 Synthesis of Ag@4-MBN NPs
Briefly,2.5 µL of a 4-MBN solution (0.1 mol/L in DMSO solvent) was added to 5 mL of the Ag NP dispersion,and the resulting dispersion shaken for 30 min.The obtained Ag@4-MBN dispersion was then centrifuged at 1 399 ×gfor 10 min to remove excess 4-MBN molecules (which were discarded in the supernatant),then redispersed in 5 mL of ultrapure water for further use.
2.6.3 Synthesis of Ag@4-MBN@Ag
Firstly,2 mL of the Ag@4-MBN dispersion was added to 4 mL of an aqueous CTAB solution (0.04 mol/L) under vigorous stirring.Then,150 µL of 0.1 mol/L AA,30 µL of 10 mmol/L AgNO3and 250 µL of 0.1 mol/L NaOH were sequentially added to the dispersion.After reaction for 3 min,the solid product was collected by centrifugation at 5 595 ×gfor 10 min and washed twice with ultrapure water to remove excess CTAB.Finally,the Ag@4-MBN@Ag NPs SERS tag was redispersed in 2 mL of ultrapure water.
2.7 Synthesis of the Ag@4-MBN@Ag-c-DNA (SERS signal probe)
Firstly,the sulfhydryl-modified complementary DNA (SH-c-DNA)was deprotected with TCEP before binding to Ag@4-MBN@Ag.Then,3 µL of c-DNA (100 µmol/L in PBS,pH 7.4) and 3 µL of TCEP solution (100 mmol/L in Tris-HCl,pH 7.5) were incubated at 37 °C for 1 h,after which 2 mL of the Ag@4-MBN@Ag NPs dispersion and 30 µL of bovine serum albumin (10 mg/mL) were added to the mixture.After incubation for 12 h,the solid product was collected by centrifugation at 4 532 ×gfor 5 min at room temperature to remove excess c-DNA.The collected Ag@4-MBN@Ag-c-DNA SERS signal probe was redispersed in 2 mL of ultrapure water for further use.
2.8 SERS aptasensor detection procedure
Briefly,200 µL of the SERS signal probe dispersion was incubated with 100 µL of the recognize probe for 1 h at room temperature.After 1 h,the Ag@4-MBN@Ag-c-DNA/Fe3O4@Auaptamer was collected using a magnet,washed twice with PBS buffer(pH 7.4),and then redispersed in 100 µL of PBS buffer.
Then,100 µL of histamine solution was incubated with the same amount of Ag@4-MBN@Ag-c-DNA/Fe3O4@Au-aptamer (SERS aptasensor) for 1 h at room temperature under gentle shaking.The product was collected by magnetically separation and washed twice with PBS buffer,then redispersed into 100 µL of PBS buffer.Finally,the dispersion was transferred to a silicon wafer and the SERS spectrum measured on a confocal micro-Raman system.
2.9 Pretreatment of samples
The pretreatment of liquid samples including beer,syoyu,kirschwasser,and rice vinegar was as follows: 1 mL of sample was precisely transferred into a 15 mL glass tube.Then,1 mL of saturated sodium bicarbonate solution,100 µL of sodium hydroxide solution(1 mol/L) and 1 mL of derivative reagent (10 mg/mL of dansyl chloride acetone solution) were added for derivatization.After vigorous stirring for 1 min,the mixture was heated in a water bath at 60 °C for 15 min.Subsequently,100 µL of sodium glutamate solution was added,after which the mixture was reacted for 15 min at 60 °C.Next,1 mL of ultrapure water was added,after which the acetone was removed in a water bath at 40 °C under nitrogen purging.Then,0.5 g of sodium chloride was added and the mixtures vortexed until the salt had completely dissolved.Subsequently,5 mL of diethyl ether was added and the mixture stirred vigorously for 2 min.The diethyl ether layer was transferred to a 15 mL centrifuge tube and the aqueous phase was extracted again.The extracts were dried in a water bath at 40 °C under nitrogen purging.The residues were redissolved in 1 mL of acetonitrile and filtered through a 0.22-µm membrane before HPLC analysis.
The pretreatment of fish sample was as follows: 10 g of minced fish was accurately weighed and placed in a 100-mL conical flask.Next,20 mL of a 5% trichloroacetic acid solution was added,and the resulting mixture shaken for 30 min.The mixture was then transferred to a 50 mL centrifuge tube,followed by centrifugation at 5 595 ×gfor 10 min.The supernatant was transferred into a 50-mL volumetric flask and the solid residues again extracted using 5% trichloroacetic acid.The extracts were combined and diluted to 50 mL with the 5% trichloroacetic acid solution.10 mL of the solution was transferred to a 25 mL test tube,after which 0.5 g of sodium chloride was added.After the sodium chloride had completely dissolved,10 mL of n-hexane was added and the mixture shaken for 5 min.Then,5 mL of the above solution was transferred into a 10 mL centrifuge tube and the NaOH solution was added to adjust pH of the solution to 12.Then,5 mL of an-butanol/trichloromethane (V:V=1:1)mixture was added.After centrifugation at 5 595 ×gfor 5 min,the organic phase was transferred to another 10 mL centrifuge tube and the lower aqueous phase again extracted.The organic extracts were combined,then diluted to 10 mL with an-butanol/trichloromethane(V:V=1:1) mixture.Hydrochloric acid (1.0 mol/L,200 μL) was added to 5 mL of the extract,and the extract evaporated to dryness in a water bath at 40 °C under nitrogen purging.The residues were redissolved in 1 mL of hydrochloric acid (0.1 mol/L).Finally,the derivatization was operated the same as above method.
The procedure for the SERS aptasensor tests for the liquid and fish extracts were the same as that described above for the histamine solutions in section 2.8.
2.10 Data analysis
ANOVA tests were performed using SAS software (SAS Institute,Cary,NC,USA) to evaluate differences between the mean values (three times) of the results obtained from the SERS aptasensor and HPLC.
2.11 Density functional theory (DFT) calculations for the Raman reporter molecule 4-MBN
Molecular simulations and Raman vibration calculations were carried out using the Gaussian 09 and Gaussview 5.0 programs.The theoretical Raman spectrum of 4-MBN data was obtained using the B3LYP and 6-311G*basis function set.
3.Results and discussion
3.1 DFT calculations and vibrational assignments for 4-MBN molecule
In order to confirm that 4-MBN molecule could serve as a Raman reporter molecule in “Raman biological-silent” region,molecular simulations and Raman vibration simulations experiments were carried out.The simulated and experimental Raman spectra for 4-MBN are shown in Fig.2a (the inset shows the structure of the 4-MBN molecule).The correction factor for the simulated Raman spectra was 0.966 3.The DFT simulated spectrum of 4-MBN shows a peak at 2 247 cm-1due to C≡N stretching,with a similar peak seen at 2 247 cm-1in the experimental Raman spectrum,indicating that the molecule is Raman active in the “Raman biological-silent” region.Hence,4-MBN can be used as a Raman reporter molecule for the detection of histamine.
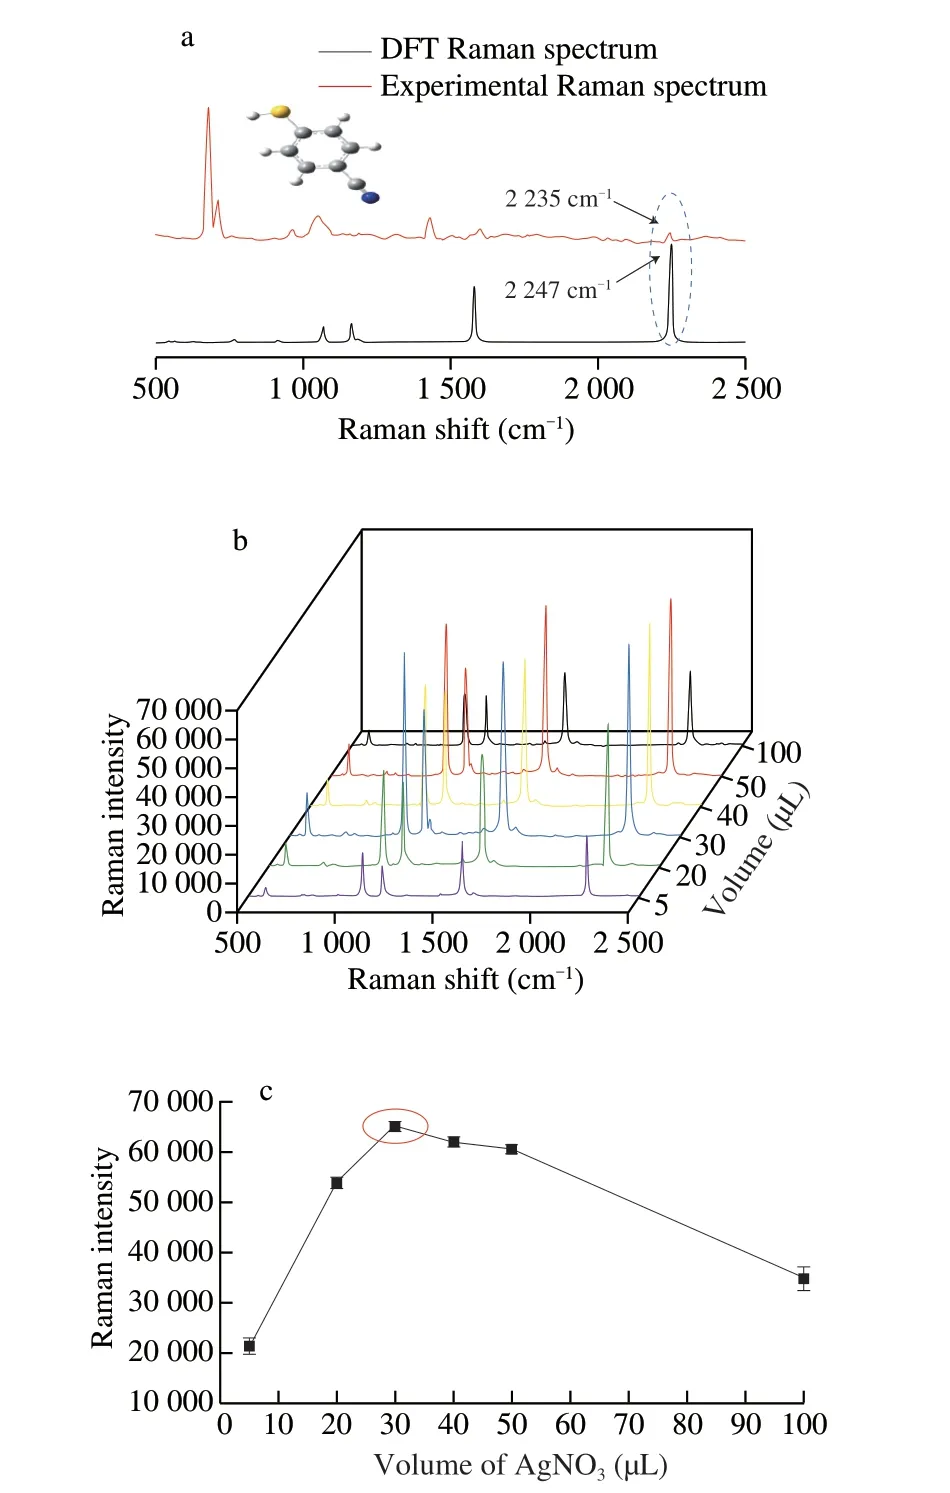
Fig.2 (a) DFT calculated Raman spectrum and experimental SERS spectrum for the 4-MBN molecule.(b) SERS for Ag@4-MBN@Ag nanoparticles synthesized using different amounts of AgNO3 in forming the Ag shell.(c) SERS intensities at 2 235 cm-1 versus amount of AgNO3 used in forming the Ag shell.
3.2 Optimizing the preparation of Ag@4-MBN@Ag SERS-tag
The SERS-tag used in this work contained Ag nanoparticles as the core,which were then functionalized with a 4-MBN layer and finally an Ag shell.In the preparation of the Ag@4-MBN@Ag SERS-tag,the Ag shell needed to be optimized.
The thickness of outer Ag shell on the SERS properties of SERStag (Ag@4-MBN@Ag) was investigated by adding different volumes(5,20,30,40,50,100 µL) of a 10 mmol/L AgNO3solution.As shown in Fig.2b,the SERS intensity at 2 235 cm-1increased with an increase of AgNO3volume up to 30 µL.However,when the volume of AgNO3was increased further (Fig.2c),the SERS intensity at 2 235 cm-1gradually decreased,likely due to the loss of Raman “hot spots”[26].Accordingly,30 µL of AgNO3solution was used in subsequent experiments for the Ag@4-MBN@Ag SERS-tag preparation.
3.3 Characterization of the prepared functional materials
Scanning electron microscopy images for the Fe3O4@Au seeds and Fe3O4@Au MNPs are shown in Figs.3a and b,respectively.The prepared Fe3O4@Au seeds were monodisperse and ellipsoidal with an average diameter of approximately 150-250 nm.After the further growth of gold on the Au seeds,the particle size of Fe3O4@Au MNPs increased to around 200-300 nm with the surface of the particles densely covered by AuNPs,indicating the successful synthesis of Fe3O4@Au MNPs.These results were consisted with the previous reports[19,32].
Figs.3c and d showed scanning electron microscopy images of Ag NPs and Ag@4-MBN@Ag NPs.The Ag NPs and Ag@4-MBN@Ag NPs were near-spherical and of uniform size (around 50-60 and 70-80 nm,respectively).Figs.S1a and S1b showed transmission electron microscopy images for Ag NPs and Ag@4-MBN@Ag NPs,respectively.The diameter of prepared Ag NPs was approximately 60 nm.After modification with 4-MBN molecules and growth of Ag shell,the particle size of the resulting Ag@4-MBN@Ag NPs product was roughly 70 nm,indicating that the Ag@4-MBN@Ag NPs was successfully synthesized[21].Embedding 4-MBN into the internal gap could induce the incident electromagnetic field to be squeezed into the gap,forming enhanced “hot spots” local electromagnetic field.
Scanning electron microscopy images for Fe3O4@Au-aptamer/Ag@4-MBN@Ag-c-DNA are displayed in Figs.3e and f,showing the SERS signal probe was successfully attached to the surface of recognize probe,forming a “core-satellite” structure.The images verify the successful construction of the SERS aptasensor.The abundant “hot spots” formed between the signal probes and recognize probes were expected to lead to significant SERS enhancement of the Raman signal of 4-MBN,thus forming the basis for the developed SERS aptasensor.
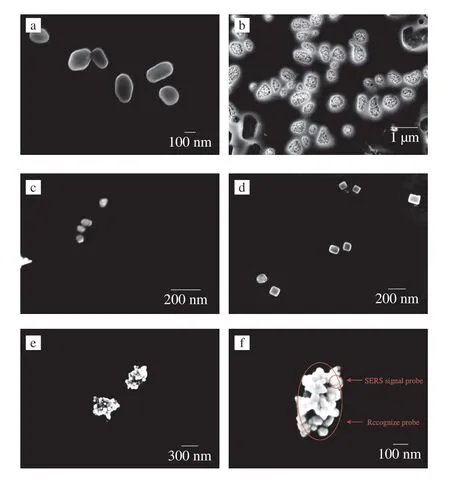
Fig.3 Scanning electron microscopy images of (a) Fe3O4@Au seeds,(b)Fe3O4@Au MNPs,(c) Ag NPs,(d) Ag@4-MBN@Ag NPs and (e,f) SERS aptasensor (i.e.Ag@4-MBN@Ag-c-DNA/Fe3O4@Au-aptamer).
To further confirm the size uniformity of Ag NPs and Ag@4-MBN@Ag NPs,their particle size distributions were investigated by dynamic light scattering (Fig.4a).The average particle size of Ag NPs and Ag@4-MBN@Ag NPs were determined to be 59 and 74 nm,respectively (with normal size distributions).The results were consistent with the results of the scanning electron microscopy and transmission electron microscopy investigations.The dynamic light scattering measurements established that the successful synthesis of Ag@4-MBN@Ag SERS-tag.
Zeta potential measurements were used follow each stage in the synthesis of the Fe3O4@Au-aptamer.As shown in Fig.4b,the surfaces of the Fe3O4NPs were positively charged (+12.97 mV).After modification with polyethylenimine (PEI),the Zeta potential of the Fe3O4NPs increased (+26.93 mV),indicating that the positively charged PEI changed the surface charge of Fe3O4NPs,which was favorable for the binding of the negatively charged Au seeds.After decoration with Au NPs,the zeta potential of Fe3O4@Au MNPs was -2.93 mV,which showed that negatively charged Au NPs were successfully modified on the surface of Fe3O4NPs.After aptamer coupling,the zeta potential became more negative(-8.76 mV),confirming that that the Fe3O4@Au-aptamer MNPs were successfully prepared[19].
The crystalline structure of Fe3O4@Au MNPs was next probed by powder X-ray diffraction (Fig.4c).The diffraction peaks at 30.4o,35.6o,43.2o,57.0oand 62.8owere due to the (112),(211),(220),(303)and (224) reflections of Fe3O4,respectively (JCPDS Card No.52-0102).A further set of diffraction peaks were observed at 38.2o,64.9o,77.3oand 82.1odue to the (111),(220),(311) and (222) reflections of face-centered cubic Au NPs (JCPDS Card No.04-0784).The XRD analysis thus verified the presence of nanocrystalline Fe3O4and Au NPs in the Fe3O4@Au MNPs sample.Furthermore,the EDS spectrum in Fig.4d showed that the main components of the Fe3O4@Au microspheres are O,Fe and Au.As shown in Fig.4e,the elemental mapping results demonstrated the distribution of O,Fe and Au in a single Fe3O4@Au MNP and its typical core-shell nanostructures,further indicating that the Au NPs were successfully coated on the surface of Fe3O4NPs.
The formation of Fe3O4@Au MNPs was further confirmed by UV-visible spectroscopy.Fig.S2 shows the UV-vis spectra of Fe3O4,Fe3O4@Au seeds and Fe3O4@Au MNPs.The wide plasmon band of Fe3O4can be attributed to the polydispersity of the particles,which was caused by the ferromagnetic behavior of the magnetic core.The plasmon band of Fe3O4@Au seeds was similar to Fe3O4nanoparticles,indicating that the adsorbed Au seeds were too small to affect the nanostructure.After the Fe3O4NPs were coated with a Au shell,an obvious UV absorbance peak appeared to be around 581 nm.This phenomenon could be due to the formation of a rough Au shell on the surface of Fe3O4NPs,leading to strong interactions and coupling between surface plasmons and adjacent Au NPs[34].The results proved that the Fe3O4@Au MNPs were successfully synthesized.

Fig.4 Dynamic light scattering particle size distributions for (a) Ag NPs and Ag@4-MBN@Ag SERS-tag (each result was 20 averages).(b) Zeta potentials of Fe3O4,Fe3O4@PEI,Fe3O4@Au and aptamer-modified Fe3O4@Au MNPs.(c) X-ray diffraction pattern for Fe3O4@Au MNPs.(d) EDS date from a single Fe3O4@Au MNPs.(e) Elemental mapping images of a single Fe3O4@Au MNP.(f) Raman spectra of 4-MBN molecule,and SERS spectra of Ag@4-MBN and Ag@4-MBN@Ag SERS-tag,respectively.
3.4 Study on the Raman performance and sensing mechanism of SERS-tag
In order to explore the signal-amplifying performance of the SERS-tag,Raman spectra were collected for the 4-MBN molecule,Ag@4-MBN NPs and Ag@4-MBN@Ag NPs.As shown in Fig.4f,the 4-MBN molecule possessed a very weak Raman peak at 2 235 cm-1.After immobilisation on the surface of Ag NPs by Ag-S bonding interaction,the Raman intensity of 4-MBN molecule increased significantly (around 11-fold compared to the 4-MBN molecule),indicating that SERS was in operation due to presence of local electromagnetic fields around the plasmonic Ag NPs.
After coating the Ag@4-MBN NPs with the Ag shell,the resulting Ag@4-MBN@Ag NPs showed a higher Raman signal (around 34-fold increase in intensity compared to the 4-MBN molecule),which might be attributed to the formation of interstitial Raman “hot spots” between the Ag core and the Ag shell (see attached chart),resulting in the enhanced plasmon resonance coupling.To sum up,the SERS-tag of Ag@4-MBN@Ag NPs showed a strong SERS signal that could be used in the sensitive detection of histamine.
3.5 Optimization of the SERS aptasensor
Next,the construction of the SERS aptasensor was optimized.The volume of recognize probe was fixed at 100 µL,then the volume(50,100,150,200,250,300 µL) of SERS signal probe varied in the preparation of SERS aptasensor whilst intensity of the Raman signal at 2 235 cm-1monitored (Fig.5a).Fig.5b shows that the Raman intensity at 2 235 cm-1increased with the volume of SERS signal probe up to 200 µL,with the SERS intensity then plateauing at higher signal probe volumes.Results indicate that at a SERS signal probe volume up to 200 µL,the signal probe attached to the recognize probe to boost the Raman signal.Above 200 µL,excess signal probe did not attach to the recognize probe,thus no change in the Raman signal was observed.Therefore,200 µL of SERS signal probe and 100 µL of the recognize probe were used to establish the SERS aptasensor.
To obtain good performance of SERS aptasensor,the incubation time (15,30,45,60 or 90 min) between the SERS signal probe and recognize probe needed to be optimized (Fig.5c).As shown in the Fig.5d,the SERS intensity at 2 235 cm-1gradually increased with incubation time up to 60 min and then stabilized,indicating that the SERS signal probes were completely attached to the recognize probes after incubation for 1 h.Therefore,a 1 h incubation time was used for subsequent experiments.
3.6 Affinity verification of aptamer
In order to verify the affinity of aptamer for histamine,different concentrations of histamine were incubated with the SERS aptasensor,and SERS signal in the supernatant was measured after magnetic separation.As shown in the Figs.S3a and S3b,when histamine was not present,there was no SERS signal in the supernatant,which indicated that the signal probe was recognized by the recognize probe.With the gradual increase of histamine concentration,SERS signal in the supernatant gradually increased,indicating that the aptamer effectively recognized the target histamine and gradually released c-DNA (i.e.the SERS signal probe).The experiment results demonstrated that the aptamer had histamine affinity under the experimental conditions.
3.7 Establishment of the SERS aptasensor method for histamine detection
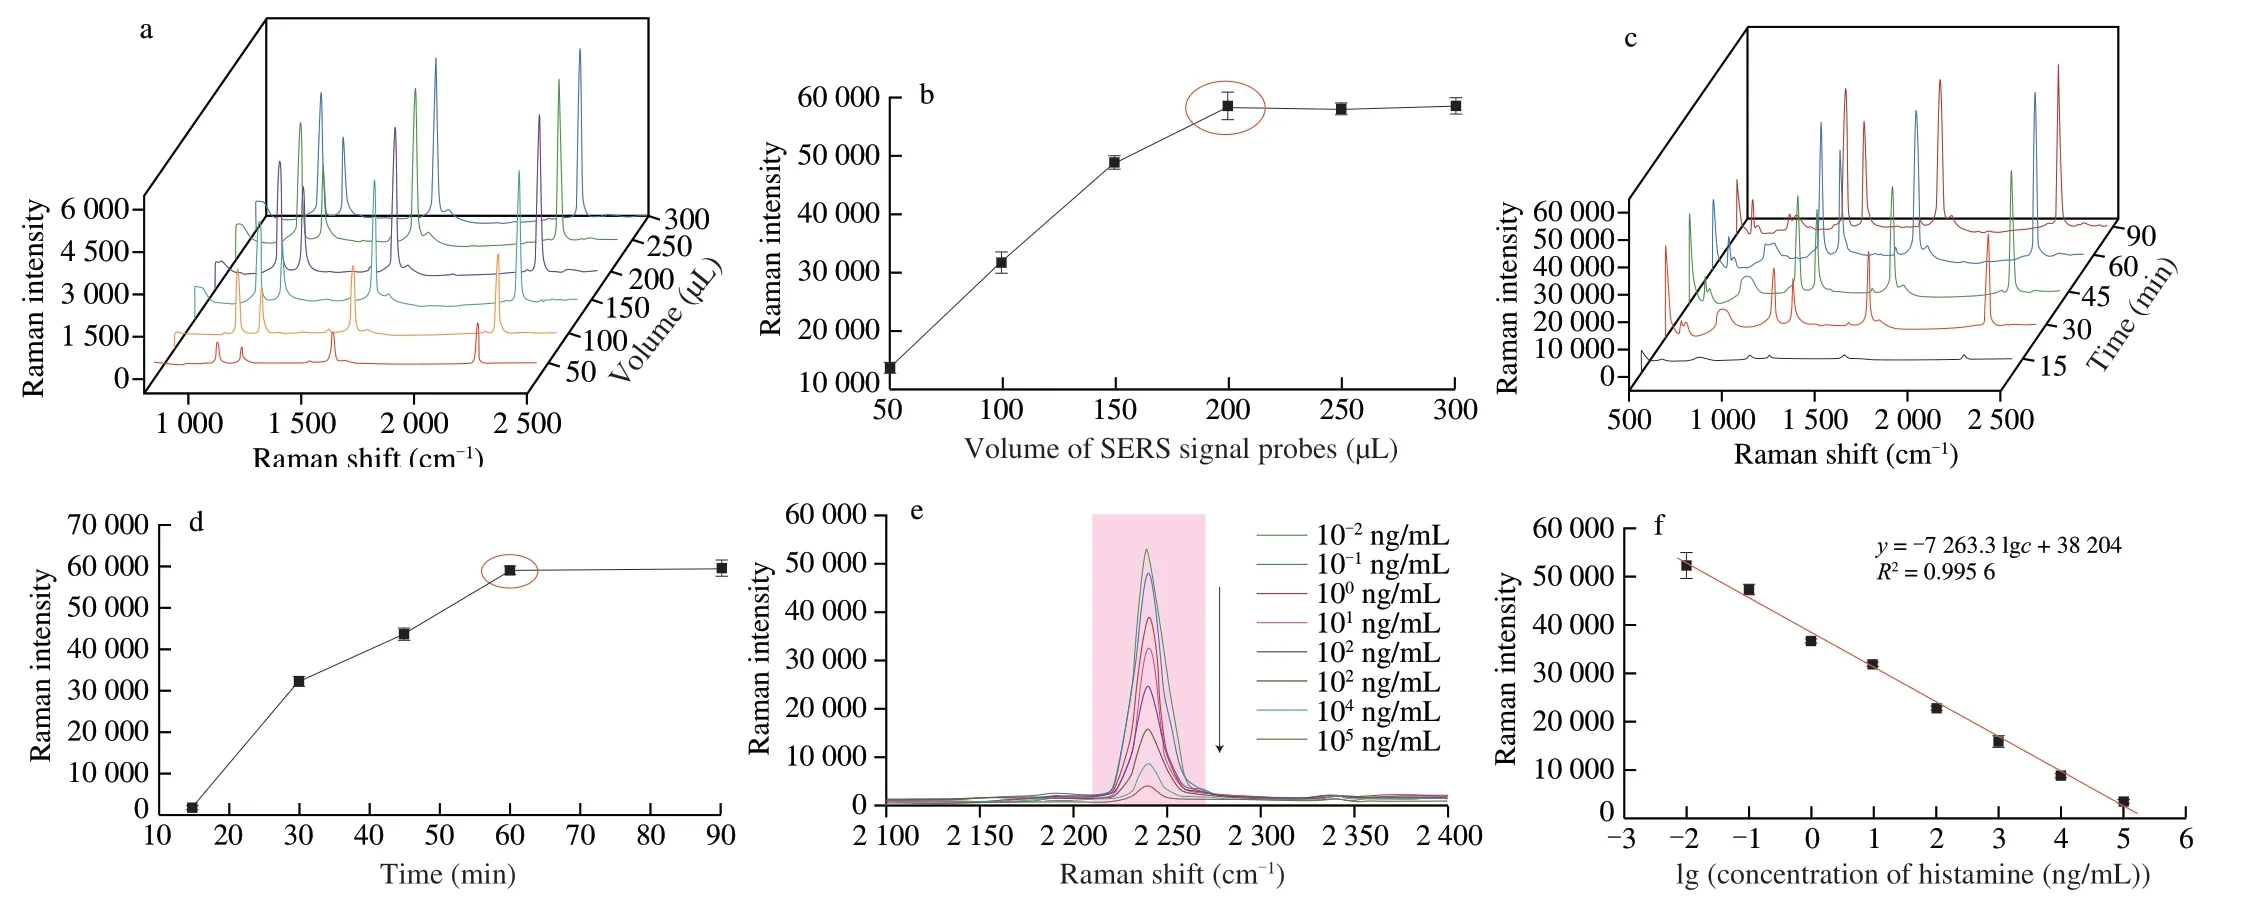
Fig.5 (a) SERS spectra collected from SERS aptasensors after incubation of 100 µL of recognize probe with different volumes (50,100,150,200,250,300 µL)of SERS signal probe for 2 h.(b) Plot of SERS intensity at 2 235 cm-1 versus volume of SERS signal probe.(c) Influence of incubation time (from 15 min to 90 min) on SERS spectra collected from the SERS aptasensor.(d) Plot of SERS intensity at 2 235 cm-1 versus incubation time.(e) SERS spectra collected at increasing concentrations of histamine.The aptasensor was incubated in histamine solutions of concentrations ranging from 10-2-105 ng/mL.(f) Linear relationship between the SERS intensity at 2 235 cm-1 and the logarithm of the histamine concentration over the range 10-2-105 ng/mL.
After optimization of the aptasensor fabrication conditions,Raman spectra were collected following the incubation of the SERS aptasensor in histamine solutions of different concentration (Fig.5e).As shown in Fig.5f,the SERS intensity at 2 235 cm-1decreased with increasing histamine concentration,demonstrating that histamine was preferentially bound by the aptamer,resulting in the disconnection of the SERS signal probe from the recognize probe (with the extent of loss of the SERS signal probe increasing with histamine concentration).A good linear relationship was established between the SERS intensity at 2 235 cm-1with the logarithm of the histamine concentration (10-2-105ng mL-1).The linear regression equation wasy=-7 263.3 lgc+38 204 (R2=0.995 6),whereyis the intensity at 2 235 cm-1and c is the concentration of histamine.The LOD for the SERS-tag aptasensor was calculated to be 0.65 × 10⁻³ng/mL(based on 3σ).
3.8 Evaluation of the SERS aptasensor method
The selectivity of the SERS aptasensor relied on the specific recognize of histamine by the aptamer.To evaluate the specificity of the SERS aptasensor for histamine,further experiments were conducted using structural analogs of histamine,including tyramine,L-tryptophan,dopamine,and mixtures of histamine with each compound (the chemical structures of histamine and the analogs are shown in Fig.S4).The SERS intensities at 2 235 cm-1of histamine(103ng/mL),tyramine (104ng/mL),L-tryptophan (104ng/mL),dopamine (104ng/mL) and histamine-analog mixtures(histamine+tyramine,histamine+L-tryptophan,histamine+dopamine,with histamine at 103ng/mL and the others at 104ng/mL) are shown in Fig.6a.For the histamine (103ng/mL) and histamine-analog mixtures,the SERS signal intensities at 2 235 cm-1were similar and significantly decreased compared to the aptasensor in the absence of histamine.Results imply that the recognize of histamine by the recognize probe was largely unaffected by the presence of tyramine,L-tryptophan or dopamine,even though the concentration of histamine(103ng/mL) was 10-fold lower than the other possible interferents(104ng/mL).However,the SERS intensity in the absence of histamine(i.e.when the sensor was incubated with tyramine,L-tryptophan or dopamine was similar to the original aptasensor in the absence of histamine,indicating that tyramine,L-tryptophan or dopamine were not recognizes by the recognize probe.The results conclusively demonstrate that the developed SERS aptasensor exhibited a high specificity for the histamine detection and showed excellent antiinterference properties.
Next,the signal-stability of the developed aptasensor was explored.The SERS stability was investigated by collecting 20 SERS spectra from randomly selected areas on aptasensor.A relative standard deviation (RSD) of 5.63% for the Raman intensity at 2 235 cm-1was obtained,indicating the good stability of the developed SERS aptasensor (Fig.6b).
To test the accuracy of the SERS aptasensor,beer samples were spiked with histamine at levels of 1.00 × 10-3,5.00 × 10-3,or 1.00 × 10⁻²ng/mL,then the concentration of histamine quantified using the aptasensor.Table 1 shows that histamine recoveries ranged from 88.00% to 101.80%,with relative standard deviations ranging from 6.88% to 13.64%.The SERS aptasensor thus offered good accuracy.
To investigate the practical utility of the established SERS aptasensor method,the levels of histamine in syoyu,rice vinegar,kirschwasser and fish samples were determined by HPLC and the SERS aptasensor method.The Raman spectra for histamine in actual food samples were shown Fig.S5.For the detection of histamine in syoyu sample (i.e.when the Raman peak value was low),a Raman peak with sharp signal and no-background interference was observed in the “Raman biological-silent” region,while the SERS signal in the“fingerprint region” was almost masked by the matrix background signal.The results proved that the developed SERS aptasensor method possessed good anti-interference and accuracy.Table S3 showed the histamine content in these samples by HPLC to be 4.31 × 104,0.10 × 104,2.55 × 104,0.22 × 104ng/mL,respectively.The histamine content in the same samples determine using the SERS aptasensor were 4.23 × 104,0.11 × 104,2.63 × 104,0.28 × 104ng/mL,respectively.There was no significant difference between the two methods in the determination of histamine (P> 0.05).Accordingly,the SERS aptasensor method developed herein is suitable for the detection of histamine in food samples.
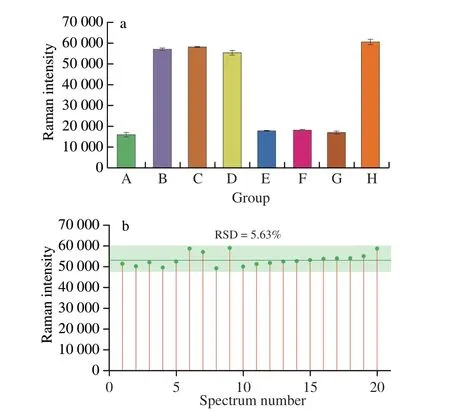
Fig.6 (a) Raman intensity at 2 235 cm-1 on SERS aptasensor after incubation in histamine (103 ng/mL),tyramine (104 ng/mL),L-tryptophan (104 ng/mL),dopamine (104 ng/mL) and mixed histamine (103 ng/mL)-analog (104 ng/mL)solutions (A: histamine;B: tyramine;C: L-tryptophan;D: dopamine;E:histamine+tyramine;F: histamine+L-tryptophan;G: histamine+dopamine;H: without analyte).(b) Reproducibility of the SERS signal at 2 235 cm-1 based on 20 measurements in a 10-2 ng/mL histamine solution using an aptasensor.
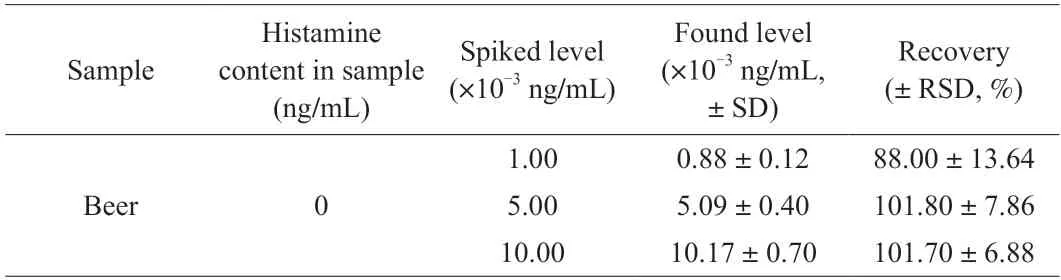
Table 1 Recoveries of histamine in spiked beer samples determined using the SERS aptasensor.
3.9 Merits of the SERS aptasensor
Compared with the other SERS sensors,the SERS aptasensor method reported in this work offered the following advantages:1) 4-MBN was selected as the Raman reporter molecule (C≡N stretch 2 235 cm-1),which avoided potential interference from biomolecules and signal-overlap between the Raman reporter molecule and histamine in “fingerprint” region (800-1 800 cm-1).Potentially,this would allow SERS analyses on complex samples with minimal purification,since the 2 235 cm-1peak (“Raman biological-silent” region) due to 4-MBN should be unaffected by other components in a sample.2) the Raman reporter molecule was embedded in the core-shell structured Ag NPs,which significantly enhanced the SERS sensitivity of the reporter molecule.Accordingly,the SERS aptasensor exhibited with a wide linear range(10-2-105ng/mL) and an ultra-low LOD (0.65 × 10⁻³ng/mL)compared with other methods for histamine detection (Table S4).3)The SERS strategy for histamine could further be extended to other target analytes by changing the sequences of aptamer and c-DNA.
4.Conclusion
A novel interference-free SERS aptasensor based on magneticinduced and aptamer-driven assemblies was developed,allowing rapid detection of histamine in foods over a wide concentration range with a very low LOD (0.65 × 10⁻³ng/mL).The presented SERS aptasensor could be extended to trace analysis of other hazards by changing specific aptamer and c-DNA.However,it can detect only single biological component.Therefore,it is necessary to explore a SERS aptasensor for detecting multiple biological components in“Raman biological-silent” region for the future.
Declaration of interest statement
We declare that we have no financial and personal relationships with other people or organizations that can inappropriately influence our work,there is no professional or other personal interest of any nature or kind in any product,service and/or company that could be construed as influencing the position presented in,or the review of,the manuscript entitled.
Acknowledgement
This work was financially supported by the National Natural Science Foundation of China (31972149).GINW acknowledges funding support from the MacDiarmid Institute for Advanced Materials and Nanotechnology and the Dodd-Walls Centre for Photonic and Quantum Technologies.
Appendix A.Supplementary data
Supplementary data associated with this article can be found,in the online version,at http://doi.org/10.26599/FSHW.2022.9250089.

- 食品科学与人类健康(英文)的其它文章
- Protective effects of oleic acid and polyphenols in extra virgin olive oil on cardiovascular diseases
- Diet and physical activity inf luence the composition of gut microbiota,benef it on Alzheimer’s disease
- Inf luence of nitrogen status on fermentation performances ofnon-Saccharomyces yeasts: a review
- Ganoderma lucidum: a comprehensive review of phytochemistry,eff icacy,safety and clinical study
- Resveratrol combats chronic diseases through enhancing mitochondrial quality
- Demonstration of safety characteristics and effects on gut microbiota of Lactobacillus gasseri HMV18