
Effects of forsythin extract in Forsythia leaves on intestinal microbiota and short-chain fatty acids in rats fed a high-fat diet
2024-02-15 07:58LnlnGuiShokngWngJingWngWngLioZitongChenPnHuiXiGuijuSunSuTin
食品科学与人类健康(英文) 2024年2期
Lnln Gui ,Shokng Wng, ,Jing Wng ,Wng Lio ,Zitong Chen ,D Pn ,Hui Xi,Guiju Sun,Su Tin
a Department of Nutrition and Food Hygiene, School of Public Health, Southeast University, Nanjing 210009, China
b Nanjing Municipal Center for Disease Control and Prevention, Nanjing 210003, China
c Department of Nutrition and Food Hygiene, School of Public Health, Hebei Medical University, Shijiazhuang 050017, China
Keywords: Forsythin High-fat diet Intestinal microbiota Short-chain fatty acid (SCFA)
ABSTRACT
1.Introduction
Forsythiasuspensa(Thunb.) Vahl is a deciduous Oleaceae shrub with both edible and medicinal properties,which is widely distributed in China,Korea,Japan and many European countries[1-2].F.suspensagrowing in hillside shrubs,tussock or sparse valley forests,is an excellent ornamental plant producing fragrant yellow f lowers in the spring.The fruit ofF.suspensais greenish when not ripe (Qingqiao) and yellow when fully ripe (Laoqiao),according to differences in harvest time.F.suspensahas a long history in China as a traditional Chinese medicine.According to the Pharmacopoeia Commission of PRC (2020),F.suspensahas functions of clearing heat and detoxifying,eliminating swelling and dispersing knots,and evacuating wind and heat.F.suspensaleaves contain a variety of chemical components,such as phillyrin,forsythiaside A,rutin and oleanolic acid.These components are higher inF.suspensaleaves than fruits[3-4].These compounds have antibacterial,anti-inf lammatory and antioxidant properties,and they inhibit the proliferation of human esophageal cancer cells and show neuroprotective effects[5-6].In 2017,F.suspensaleaves were included in the category of food because of their safety for consumption.
Gut microorganisms,which are considered the “second human genome”,are numerous and diverse.Different types of gut microorganisms interact in jointly regulating host immune function and maintaining the stability of the host’s intestinal environment[7].In recent years,greater attention has been paid to the role of intestinal microbiota in human health,and studies are increasingly examining the relationships among natural products,plant compounds and the intestinal microbiota[8-10].In China,herbal supplements have been used to treat obesity,type 2 diabetes and nonalcoholic fatty liver disease[11].In addition,tea polyphenols can ameliorate obesity caused by a high-fat diet[12].Flos Loniceracan ameliorate obesity by regulating distribution of intestinal microbiota and intestinal permeability[13].Short-chain fatty acids (SCFAs) including acetic acid,propionic acid and butyric acid,are produced mainly by anaerobic fermentation of gut microorganisms,and they play important roles in regulating energy metabolism and supply,and maintaining the dynamic balance of the gut environment[14].SCFAs control body weight and increase insulin sensitivity.Studies have shown that a high fiber diet promotes the beneficial production of SCFAs,end products of intestinal microbial fermentation[15-16].
As for the relationship betweenF.suspensaleaves and intestinal microbiota,previous studies have shown thatCoptidis RhizomaandForsythiae Fructuscan inhibit the multiplication ofLactobacillus acidophilus,Enterococcus faecalisandEscherichia coli[17].F.suspensacan also reduce the content of intestinal pathogenic bacteria in Lingnan damp-heat model mice and regulate the structure of intestinal microbiota[18].Phillyrin is the functional component ofF.suspensaleaves,and also one of the main components.With the continual improvement of living standards,human dietary habits have tended toward a Westernized high fat,high sugar diet.According to the literature,dietary structure affects the composition of the intestinal microorganisms[19].Therefore,this study investigated the effects of phillyrin extract fromF.suspensaleaves on the intestinal microbiota and content of SCFAs in rats with obesity induced by a high-fat diet.
2.Materials and methods
2.1 Plant materials
The forsythin was made in our laboratory.The preparation procedures were as follows.TheF.suspensaleaves were pulverized,combined with a 20× volume of water and extracted twice at 90 °C,for 60 min each time.After centrifugation,the supernatant was concentrated in a rotary evaporator and freeze-dried into powder.After high performance liquid chromatography detection,the content of forsythin was 13.3%.The obtained forsythin extract was prepared for subsequent animal experiments.F.suspensaleaves were purchased from Shanxi Huiyuan Sihai Agricultural Science and Technology Co.,Ltd.(Shanxi,China).
2.2 Animals, diets and experimental design
All animal experimental procedures used in this study were reviewed and approved by the Experimental Animal Ethics Committee of Southeast University (permission number: 20190805009).A total of 40 male SD rats (190-210 g of weight) were purchased from Zhejiang Academy of Medical Sciences (Zhejiang,China) (certificate number: SCXK-2019-0002).All animals were acclimated to a controlled environment with an ambient temperature of 20-26 °C and humidity of 45%-65% under a 12 h light/12 h dark cycle.
After 1 week of adaptive feeding,all rats were randomly divided into a control group (CON) (n=8) and obesity model group (OBM)(n=32).The rats in the CON group were fed standard chow,and those in the OBM group were switched to high-fat chow.The standard chow and high-fat chow were purchased from Suzhou Shuangshi Experimental Animal Science and Technology Co.,Ltd.(Suzhou,China).The high-fat chow was standard chow with additions of 15.0% sucrose,15.0% lard,and appropriate amounts of casein,calcium hydrogen phosphate,etc.The fat energy ratio was 39%.After 2 weeks,the rats in the OBM group were randomly divided into 4 groups (n=8 per group): a model control group (MOD),low-dose group (MD),high-dose group (HD) and standard group(SP).The content of forsythin in the MD group was 53.2 mg/(kg·day),and that in the HD group was 159.6 mg/(kg·day).The content of forsythin in the SP group was 54.3 mg/(kg·day),a value comparable to that in the MD group.The rats in the CON and the MOD groups were intragastrically administered distilled water at 0.1 mL/kg every day for 6 weeks.During the experimental period,food intake was recorded every day,and unconsumed food was recorded weekly.Body weight was measured once per week,and the gavage volume was adjusted according to body weight.
At the end of the experiment,all rats were fasted for 12 h and sacrificed by carbon dioxide inhalation.Two or three fecal pellets were collected from the colon and immediately placed in an ice box,frozen in liquid nitrogen and stored in a -80 °C refrigerator for subsequent intestinal flora and SCFA detection.
2.3 Fecal intestinal flora assays
2.3.1 16S rDNA sequencing
DNA from fecal samples was extracted with a Mobio soil microbial DNA strong extraction kit according to the manufacturer’s protocol.The purity and concentration of the extracted DNA were measured,and samples were stored at -20 °C.The V3-V4 regions of 16S rDNA were amplified with primers F: 5’-ACTCCTACGGGAGGCAGCA-3’ and R: 5’-GGACTACHVGGGTWTCTAAT-3’,and the PCR products were purified with AMpure XP magnetic beads.Electrophoresis was performed on 1.8% agarose gel for 40 min,and the results were quantified in ImageJ software.Finally,the library was constructed,and the Illumina HiSeq 2500 platform was used for high-throughput sequencing.
2.3.2 Evaluation of sequencing data quality
With FLASH software,PE reads were spliced according to the minimum overlap length of 10 bp and the maximum mismatch ratio allowed in the overlap region of 0.2.Raw reads were filtered into clean reads in Trimmomatic software.Finally,effective reads were obtained through UCHIME software identification.After sequencing,parameters such as the sequence number and sequence length(AvgLen) at each stage were evaluated.
2.3.3 OTU analysis
Usearch software was used to cluster the sequences at 97%similarity,and the number of operational taxonomic units (OTUs) was obtained.A Venn diagram demonstrated the number of common and unique OTUs between samples,and clearly indicated the coincidence of OTUs in each sample.According to the species represented by each OTU,common microorganisms in different environments were identified.
2.3.4 Alpha and beta diversity analysis
Alpha diversity reflects the species abundance and species diversity of a single sample.Beta diversity analysis was used to analyze the changes in species composition on the time and space scales,and the similarities in species diversity among different samples were compared.
2.3.5 Significance analysis of inter-group difference
Metastats software was used to analyze the species abundance between groups,and then the species showing differences between groups were selected according to thePvalues.
2.4 Detection of SCFAs in rat feces
2.4.1 Sample pretreatment
According to methods reported by Yao et al.[20]and Wu[21],the detailed steps for sample pretreatment were as follows.
• A (50 ± 1) mg mass of sample was placed in a 2 mL EP tube,and 0.5 mL pure water was added and vortexed 10 s.
• Steel beads were added,and the sample was were ground with a 40 Hz grinding machine for 4 min,then ultrasonicated for 5 min (in an ice water bath).
• The sample was centrifuged at 4 °C,5 000 r/min for 20 min.
• Then 0.3 mL supernatant was placed in a 2 mL EP tube,and 0.5 mL pure water was added and vortexed for 10 s.
• The sample was processed in a 40 Hz grinding machine for 4 min,then ultrasonicated for 5 min (in an ice water bath).
• The sample was centrifuged at 4 °C,5 000 r/min for 20 min.
• An 0.5 mL volume of supernatant was transferred to a 2 mL EP tube and combined with the step 4 supernatant,thus yielding 0.8 mL supernatant.
• Then 0.1 mL 50% H2SO4and 0.8 mL internal standard solution(2-methylvaleric acid,25 mg/L,methyl tert-butyl ether)were added and vortexed for 10 s,oscillated for 10 min and ultrasonicated for 10 min (in an ice water bath).
• The sample was centrifuged at 4 °C,10 000 r/min for 15 min.
• The sample was allowed to stand at -20 °C for 30 min.
• The supernatant was removed and placed into an injection bottle for GC-MS detection.
2.4.2 GC-MS analysis of SCFAs
The extracts were measured with a gas chromatography-mass spectrometer on an HP-FFAP capillary column (30 m × 250 µm,0.25 µm) with helium as a carrier gas at 1 mL/min.The inlet temperature was 240 °C,and the initial oven temperature was 80 °C.After injection,the oven temperature rose to 200 °C at a rate of 10 °C/min and was maintained for 5 min,then rose to 240 °C at 40 °C/min and was maintained for 1 min.The mass spectrometer parameters were set as follows: ion source temperature: 200 °C;4 bar temperature: 150 °C;transmission line temperature: 240 °C;electron energy: 70 eV;scan range:m/z33-150.
2.5 Statistical analysis
Data are reported as means ± standard deviation,and the differences between mean values of multiple groups were analyzed with one-way analysis of variance.P< 0.05 was considered to indicate a significant difference.
3.Results
3.1 Fecal intestinal flora assays
3.1.1 Quality assessment of sequencing data
A total of 3 030 688 pairs of raw reads were obtained from 40 samples.After splicing and filtering of the two-terminal sequence data,3 046 258 clean tags were generated.After removal of chimeras,2 823 221 effective tags were obtained.The effective tag length was between 418 and 427 bp,and the average length of the total tags was 422.08 bp.The sequencing quality was good (Table S1).
3.1.2 OTU analysis
As displayed in Table 1,the number of OTUs in the CON group was statistically significantly different from those in the MOD,HD and SP groups,thus indicating that the species abundance differed among groups,and the CON group had the highest abundance.
A Venn diagram shows the number of OTUs and the amount of overlap in each group (Fig.1).The CON,MOD,MD,HD and SP groups had a total of 455 OTUs,thus indicating at least 455 mutual bacterial species among the 5 groups.The numbers of specific OTUs in the CON and MOD group were four and one,respectively,but no specific OTUs were observed among the other groups,thus indicating a difference in microbial species among the groups.
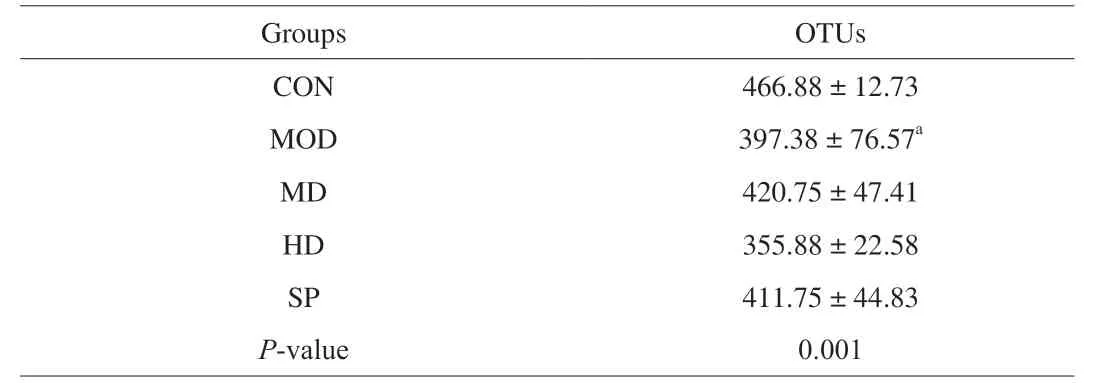
Table 1 Comparison of OTU number among groups.
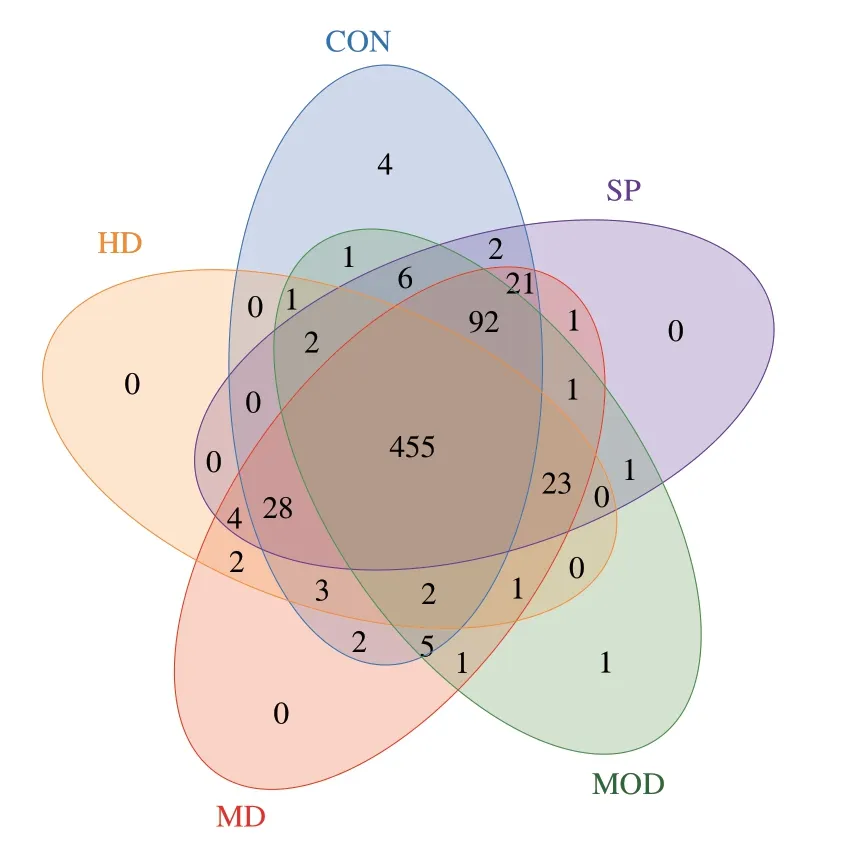
Fig.1 Venn diagrams of OTU distribution in all 5 groups.
3.1.3 Alpha diversity analysis
3.1.3.1 Rarefaction curve
As presented in Fig.2,when the number of sequences was less than 10 000,the rate of OTU increase was large,and the curve was steep.In contrast,when the number of sequences exceeded 10 000,the curve gradually became flat,thus indicating that the number of OTUs in each sample did not increase significantly with the increase in the number of sequences.According to the results of the previous sequencing data quality assessment,the average sequencing volume of each group was greater than 65 000.Therefore,the sample sequences in each group were sufficient and suitable for data analysis.

Fig.2 Rarefaction curves.The curves reflect the rate at which new OTUs appeared under continuous sampling.
3.1.3.2 Hierarchical abundance curve
The hierarchical abundance curve was used to explain the abundance and evenness of species composition.The wider and gentler the curve,the richer the species composition,and the higher the evenness.In Fig.3,each curve corresponds to a sample,labeled with different colors.The width of each sample curve was wide,thus indicating high species abundance between samples.In addition,except for several curves,most curves gradually became flat with an increase in OTU number,thus indicating relatively good uniformity of each sample.By further comparing the slope of each curve,we found differences in the proportion of each species among the samples.
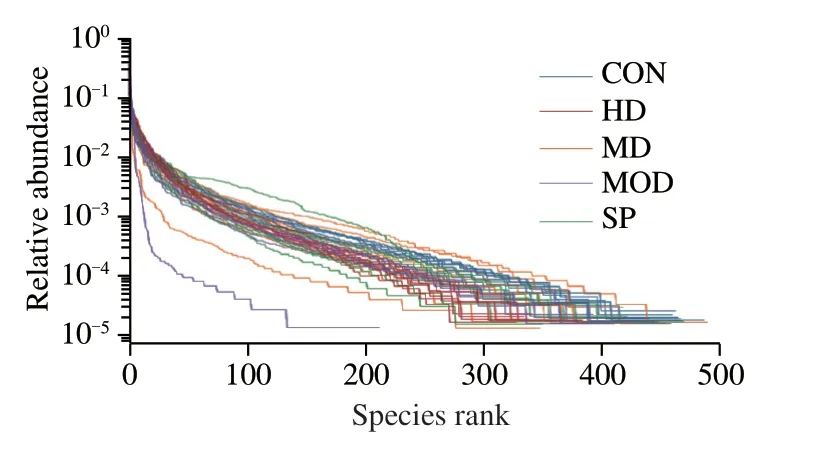
Fig.3 Hierarchical abundance curves of all samples in different groups.
3.1.3.3 Shannon index curve
Shannon index curves reflect the microbial diversity of each sample under different numbers of sequences.As shown in Fig.4,the curves of each group were gentle,thus indicating a sufficient sequencing number in each group.The Shannon index of the CON group was largest,followed by those of the HD,SP and MD groups,and that of the MOD group was smallest.
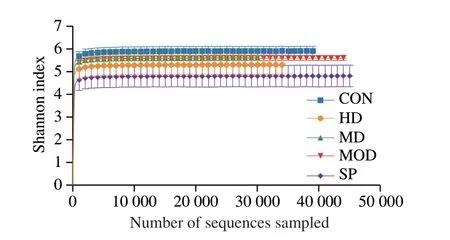
Fig.4 Shannon curves of different groups.
3.1.3.4 Species accumulation curve
The species accumulation curves indicated the relationship between sample numbers and the numbers of species detected.As shown in Fig.5,the red box curve tended to become flat after a sharp rise,whereas the green box curve tended to become flat after a decline,thus indicating that the sample size was sufficient,and data analysis could be performed.
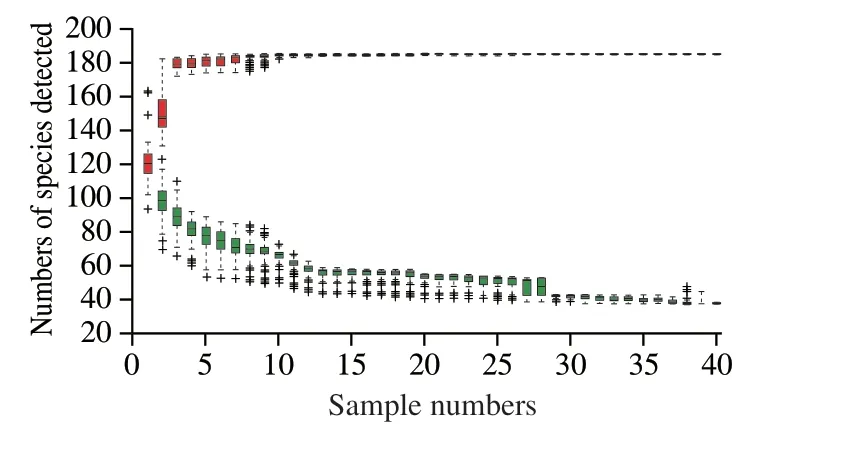
Fig.5 Species accumulation curves.The cumulative curve composed of single red boxes reflects the emergence rate of new species during continuous sampling,and that composed of green boxes reflects the emergence rate of common species during continuous sampling.
3.1.3.5 Alpha diversity index analysis
The sequencing depth index of each group reached 0.998 or more,thus indicating that the sequencing results represented the real situation in the samples.The Chao1 and ACE indices reflected species abundance (number of species).The Shannon and Simpson indices reflected species diversity.As shown in Fig.6,no significant difference in microbial diversity was observed among the CON,MOD,MD,HD and SP groups.The ACE and Chao1 indices of intestinal microbial communities in the MOD group significantly differed from those in the CON group (P< 0.05),thereby suggesting that the high-fat diet was associated with a decrease in microbial abundance.Although no significant difference was observed in the ACE and Chao1 indices of intestinal microbial communities among the MD,HD,SP and MOD groups,the ACE and Chao1 indices of intestinal microbial communities in the MD and SP groups were higher than those in the MOD group,but not the HD group.In addition,although no significant difference was observed in the Shannon and Simpson indices of intestinal microbial communities among the CON,MOD,MD,HD and SP groups,the Shannon and Simpson indices of the CON group were highest,followed by those in the SP group and HD group,and those in the MOD group were lowest,in agreement with the Shannon index curves.

Fig.6 Alpha diversity indices in each group.aSignificant differences were observed between the MOD group and CON group (P < 0.05).b Significant differences were observed between each dose group and the MOD group (P < 0.05).
3.1.4 Beta diversity analysis
3.1.4.1 Principal component analysis(PCA)
PCA is a technique for analyzing and simplifying data sets.By analyzing the feature composition of different samples,the differences and distances of samples can be determined.The closer the distance between two samples,the more similar their compositions.As shown in Fig.7,the contribution of the first principal component to the difference between the samples was 36.03%,and the contribution of the second principal component was 24.15%.The samples in each group could not be effectively separated.
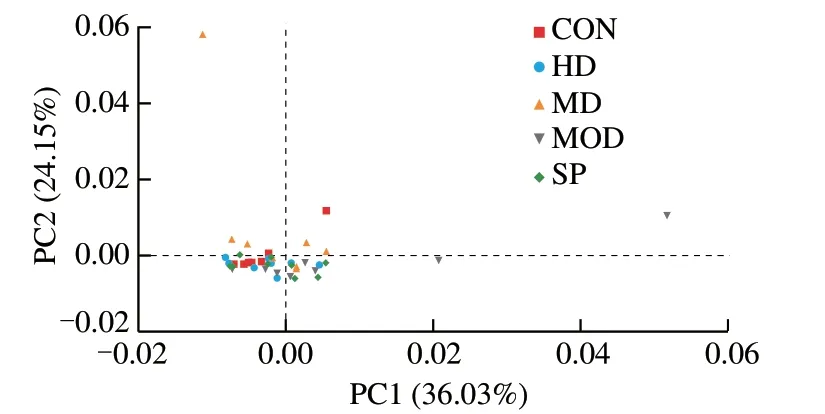
Fig.7 Weighted Unifrac algorithm PCA analysis.
3.1.4.2 Principal coordinate analysis(PCoA)
In this study,the weighted Unifrac algorithm was used to comprehensively consider species existence and species abundance,and the abundance was weighted to calculate the distance between samples,to observe the colony differences between different samples or groups.As shown in Fig.8,the contribution of the first principal component to the difference between samples was 38.87%,and that of the second principal component was 11.90%.The samples in each group could not be effectively separated.

Fig.8 Weighted Unifrac algorithm PCoA analysis.
3.1.4.3 UPGMA analysis
UPGMA was used to construct a cluster tree based on the weighted Unifrac distance.As shown in Fig.9,in addition to MOD 1,MOD 2,and MOD 4,the MOD group was located mainly below the phylogenetic tree,and the CON group was located mainly above the phylogenetic tree.The two groups were far apart,thus indicating differences in species composition between groups.Although the intervention groups were scattered,most of them were close to the CON group,thus indicating that the species composition of the intervention groups was close to that of CON group.
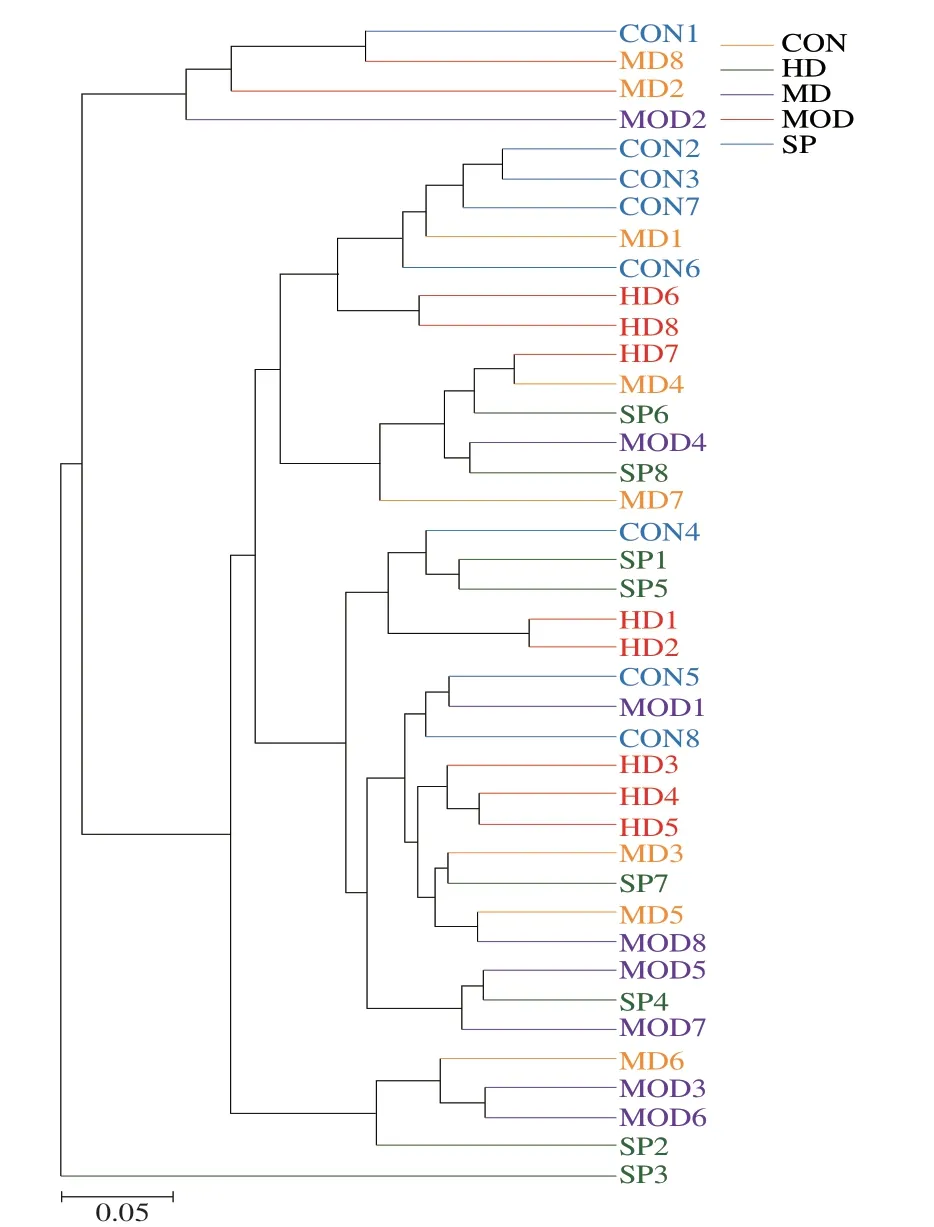
Fig.9 Weighted Unifrac algorithm UPGMA clustering tree.
3.1.4.4 Heatmap analysis
A heatmap was drawn according to the distance algorithm with R language tools (Fig.S1).The difference in color gradient represents the difference between samples.The color gradient from blue to red represents the distance between samples,from near to far.The analysis results were the same as above.
3.1.5 Significance analysis of differences between groups
3.1.5.1 Phylum level
As shown in Fig.10,the 10 bacterial phyla in the samples were Firmicutes,Bacteroidetes,Verrucomicrobia,Proteobacteria,Actinobacteria,Tenericutes,Patesci-bacteria,Cyanobacteria,Fusobacteria and Acidobacteria.Among them,Firmicutes,Bacteroidetes and Proteobacteria were the main bacteria.In the CON group,the average relative abundance of Firmicutes was highest (73.54%),followed by that of Bacteroidetes (19.67%) and Proteobacteria (1.56%).In the MON group,the average relative abundance of Firmicutes (72.14%),Bacteroidetes (17.16%) and Verrucomicrobia (7.63%) was highest,whereas the top three bacteria in the HD group were Firmicutes (79.41%),Bacteroidetes (17.89%)and Proteobacteria (1.57%).The composition of bacteria in the HD group was consistent with that in CON group.The average relative abundance of microbiota in the HD was also close to that in CON group,thus indicating that the intestinal microbiota in the HD group might return to normal levels after intervention.Compared with that in the MD group,the average relative abundance of Verrucomicrobia in the CON group and HD group was significantly lower(P< 0.05),whereas no significant difference was observed between the MD group and SP group (P> 0.05),thus suggesting that high-dose forsythin extract may elicit improvements in the intestinal microbiota in rats with obesity induced by a high-fat diet (Table 2).
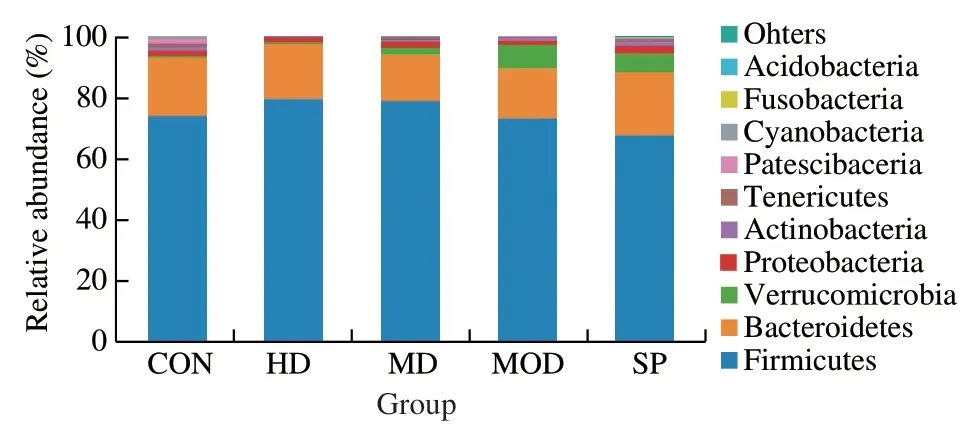
Fig.10 Histograms of phylum-level flora structure in each group.

Table 2 Percentage (%) of main bacteria in each group.
Among all phyla,the total abundance of the three dominant phyla exceeded 90%.The relative ratio of (Proteobacteria+Bacteroidetes)/Firmicutes is commonly used to determine the ratio of G-bacteria to G+bacteria in the intestinal microbiota.Compared with that in the CON group,the ratios in the MD and HD groups were not statistically different(P> 0.05),but the numerical values indicated a decreasing trend in the latter two groups (Fig.11),thus indicating that in the MD and HD groups,phillyrin extract may have the potential to decrease gut G-bacteria.

Fig.11 Ratios of G- bacteria to G+ bacteria in each group.
3.1.5.2 Genus level
Because many genera are present,but the relative abundance of most genera is relatively low,and their functional effects are relatively weak,this study described and analyzed only the main microbiota with inter-group differences at genus level.As shown in Fig.12 and Table 3,compared with that in the CON group,the average relative abundance ofLactobacillusin the MON group was higher,but the difference was not statistically significant (P> 0.05).Each dose group showed decreased abundance ofLactobacillus,thus indicating that forsythin extract may ameliorate the increase in intestinalLactobacillusabundance in rats fed a high-fat diet.Compared with that in the CON group,the abundance of Ruminococcaceae_UCG-014 andRomboutsiain the MOD group was lower,whereas that in the MD and HD groups was higher.The SP group showed increased abundance of Ruminococcaceae_UCG-014.For Ruminococcaceae_UCG-014,only the HD group showed a statistical difference (P< 0.05),and forRomboutsia,only the MD group showed a statistical difference(P< 0.05),thereby suggesting thatF.suspensaleaf extract may have the potential to ameliorate intestinal microbiota disorders caused by a high-fat diet.In addition,compared with that in the CON group,the abundance ofAkkermansiain the MOD group was significantly greater (P< 0.05),and the intervention groups showed lower abundance,but only the HD group showed a statistical difference with respect to the MOD group (P< 0.05).Thus,the HD group showed the greatest amelioration of intestinal microbiota disorder caused by a high-fat diet.
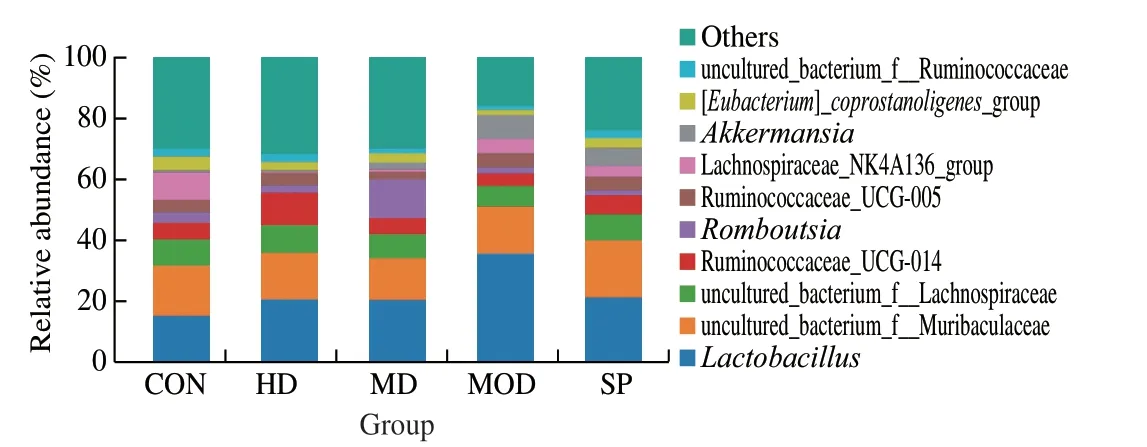
Fig.12 Histograms of genus level flora structure in each group.
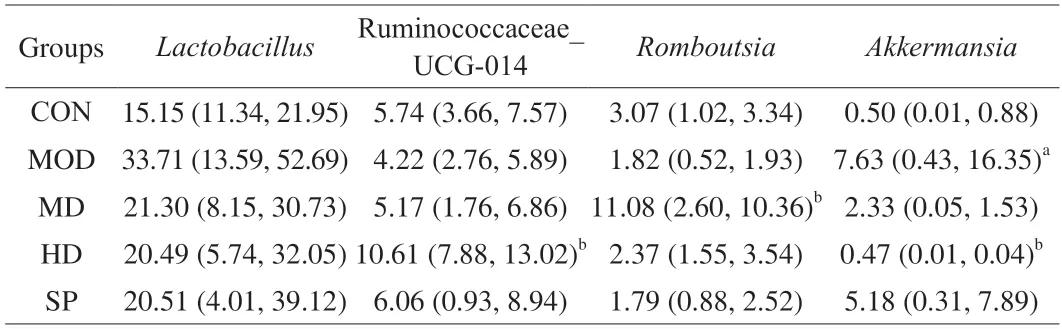
Table 3 Percentage (%) of main genera genus level.
3.2 SCFA assays
As shown in Table 4,compared with that in the CON group,the content of propionic acid,butyric acid,valeric acid and total SCFAs in the intestinal tract in the MOD group was significantly higher,and the content of caproic acid was significantly lower (P< 0.05).However,the content of acetic acid,isobutyric acid and isovaleric acid in the two groups did not significantly differ (P> 0.05).Compared with that in the MOD group,the content of propionic acid,butyric acid and valeric acid in each intervention group was significantly lower(P< 0.05),as was the total SCFA content (P< 0.05),in agreement with the trend in the CON group.In each intervention group,the SCFA content in the intestinal tracts in rats was highest in the HD group,whose levels were closest to those in the CON group,thus indicating that forsythin extract may ameliorate the increase in total SCFA content in the intestinal tracts of rats with obesity induced by a high-fat diet.Compared with that in the CON group,the total SCFA content in each intervention group was lower,thus indicating that forsythiaside extract may promote the metabolism of SCFAs by intestinal microorganisms.
4.Discussion
As a new food ingredient,F.suspensaleaves are gradually widely used in the food field,such as forsythia black tea,forsythia herbal tea,natural food preservatives and new antioxidants[22-23].This study analyzed the effects of forsythin extract fromForsythialeaves on intestinal microbiota and SCFA content in rats with obesity induced by a high-fat diet,to explore whether the purpose of weight loss can be achieved through intestinal microbiota and SCFAs,and to provide a scientific basis for the development of health function ofF.suspensaleaves.
The composition and stability of intestinal microbiota are affected by many host and environmental factors,among which dietary factors play crucial roles[24].Different dietary structures can have important effects on the composition and diversity of the intestinal microbiota.In particular,a Western high-fat diet can alter the structure of intestinal microbiota,thus resulting in chronic,non-infectious and immune-associated diseases[25].By exploring the effects of forsythin extract on the intestinal microbiota in obese rats,we observed that the abundance of intestinal microbiota in rats with obesity induced by a high-fat diet was significantly lower than that in normal rats;although the change in diversity was not significant,a decreasing trend was observed,possibly because of the influence of environmental and individual differences.UPGMA analysis indicated that the MOD group was located mainly below the phylogenetic tree,and the CON group was located mainly above the phylogenetic tree.The two groups were far apart,thus indicating differences in the intestinal microbiota between groups.Although the intervention groups were relatively dispersed,most of them were close to the CON group,thus indicating that forsythiaside extract ameliorates intestinal microbiota disorder in rats with obesity induced by a high-fat diet.
Diet is an important environmental factor affecting the composition of the intestinal microbiota.High-fat diet intake can cause intestinal microecological disorders in the early stages,characterized by an increase in the number of Gram-negative bacteria,followed by brain pathology,microglial hyperactivity and cognitive decline[26-28].In this study,the composition of the intestinal microbiota in rats fed a high-fat diet significantly differed from that in the normal group.Compared with the MOD group,the composition of intestinal microbiota in each intervention group was closer to that in the CON group,thus indicating that forsythin extract fromF.suspensaleaves improved the composition of intestinal flora,in agreement with findings from previous studies.At the phylum level,the proportions of Firmicutes (G+bacteria),Bacteroidetes(G-bacteria) and Proteobacteria (G-bacteria) reached more than 90%.The relative ratio of (Proteobacteria+Bacteroidetes)/Firmicutes is commonly used to determine the ratio of G-bacteria to G+bacteria in intestinal microbiota.In this study,the relative abundance of G-bacteria in the intestinal tract in rats with obesity induced by a high-fat diet increased as the ratio of (Proteobacteria+Bacteroidetes)/Firmicutes increased.After the forsythiaside extract intervention,the ratio showed a decreasing trend to varying degrees.These findings indicated thatF.suspensaleaf extract may slow the development of obesity induced by a high-fat diet.
SCFAs are produced by the intestinal microbiota through metabolism of complex carbohydrates and plant polysaccharides,mainly acetic acid,butyric acid and propionic acid.SCFAs,as an important substrate,provide energy for humans and microorganisms[29].In addition to serving as a direct energy source,SCFAs act as signaling molecules regulating the body’s metabolic function,andcan enhance intestinal mucosal barrier function,decrease levels of pro-inflammatory mediators and stimulate the production of immunosuppressive cytokines—functions very important for maintaining host health[30-31].The concentration of SCFAs depends on intestinal microbial composition,intestinal transit time,and fiber content in the host feed.The intestinal microbiota is divided mainly into four categories: Firmicutes,Bacteroidetes,Proteobacteria and Actinobacteria.Firmicutes and Bacteroidetes are the two dominant bacteria that produce SCFAs.In the colon,the content of acetate,propionate and butyrate accounts for approximately 90% of total SCFAs[32].Acetic acid increases energy consumption by activating AMPK in the liver and muscle[33],and also affects host energy metabolism through the secretion of intestinal hormones,thereby affecting appetite by decreasing systemic lipolysis and systemic inflammatory cytokines,and increasing energy consumption and fat oxidation[34].Propionic acid inhibits the formation of liver fat and increases insulin sensitivity[35].Supplementation with butyric acid increases the energy consumption of mice with obesity induced by a high-fat diet[36].After high-fat diet feeding,the total content of SCFAs in rat feces increased,and the content of caproic acid significantly decreased.Compared with that in the MOD group,the content of propionic acid,butyric acid and valeric acid in each intervention group was lower,as was the total SCFA content,thus indicating thatF.suspensaextract promoted the metabolism of SCFAs by intestinal microorganisms.Previous studies have shown that a high-fat diet decreases the content of SCFAs in the intestines,but a refined high-fat diet increases the diversity of intestinal microbiota and the content of SCFAs,thereby increasing energy metabolism[37].This finding may be due to an increase in intestinal acetate production after high-fat diet feeding,thereby increasing the acetate level in the brain and leading to the activation of the parasympathetic nervous system,and consequently increasing the secretion of auxin-releasing peptide and insulin,causing an excessive appetite,and ultimately leading to the accumulation of lipids in the liver and skeletal muscle[38].This result contrasts with findings in previous studies indicating that increased SCFA content leads to symptoms of metabolic syndrome,such as obesity.Rau et al.[39]have also found that the bacterial content and SCFA content in feces of patients with non-alcoholic fatty liver disease are high.Schwiertz et al.[40]have found that the total SCFA concentrations in the feces of obese patients are more than 20% higher than those in lean patients,whereas the content of acetic acid,propionic acid and butyric acid is elevated.These differences may also be affected by genetic factors,environmental factors and individual health status.Therefore,analysis of more samples and clinical studies are needed to explain the relationships among obesity,intestinal microbiota and SCFAs.
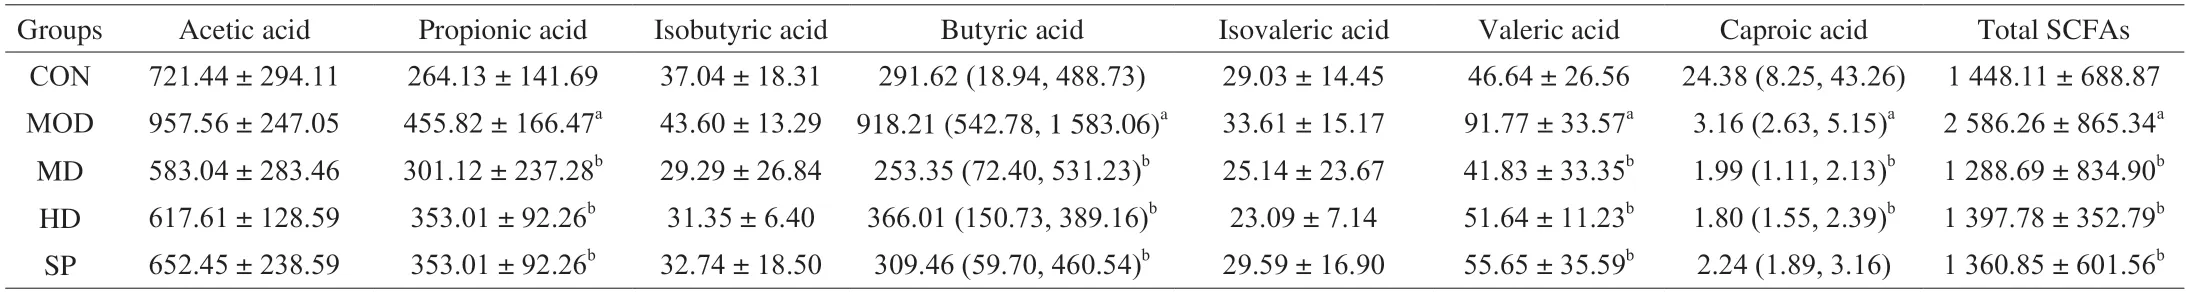
Table 4 SCFA content (mg/L) in each group.
5.Conclusions
Overall,our study showed that forsythin extract fromForsythialeaves increases the abundance of intestinal microbiota,and restores a normal intestinal microbiota structure in rats with obesity induced by a high-fat diet.Simultaneously,this treatment inhibits the increase in total SCFA content in the intestinal tract in rats fed a high-fat diet,and promotes the metabolism of SCFAs by intestinal microorganisms.Forsythialeaves are medicinal and edible plants whose active components and efficacy are worthy of further study.
Conflicts of interest
Shaokang Wang and Guiju Sun are editorial board members forFood Science and Human Wellnessand were not involved in the editorial review or the decision to publish this article.The authors declare no conflicts of interest.
Acknowledgments
This study was funded by grants from the National Key R&D Program of China (2016YFD0500604).
Appendix A.Supplementary data
Supplementary data associated with this article can be found,in the online version,at http://doi.org/10.26599/FSHW.2022.9250055.
- 食品科学与人类健康(英文)的其它文章
- Protective effects of oleic acid and polyphenols in extra virgin olive oil on cardiovascular diseases
- Diet and physical activity inf luence the composition of gut microbiota,benef it on Alzheimer’s disease
- Inf luence of nitrogen status on fermentation performances ofnon-Saccharomyces yeasts: a review
- Ganoderma lucidum: a comprehensive review of phytochemistry,eff icacy,safety and clinical study
- Resveratrol combats chronic diseases through enhancing mitochondrial quality
- Demonstration of safety characteristics and effects on gut microbiota of Lactobacillus gasseri HMV18