
A novel AgNPs/MOF substrate-based SERS sensor for high-sensitive on-site detection of wheat gluten
2024-02-15 07:58LinglinFuYnzhuoDuJinruZhouHunLiMinziWngYnboWng
食品科学与人类健康(英文) 2024年2期
Linglin Fu,Ynzhuo Du,Jinru Zhou,b,Hun Li,Minzi Wng,Ynbo Wng,
a Food Safety Key Laboratory of Zhejiang Province, School of Food Science and Biotechnology, Zhejiang Gongshang University, Hangzhou 310018, China
b Zhejiang Engineering Research Institute of Food &Drug Quality and Safety, School of Management and E-Business, Zhejiang Gongshang University, Hangzhou 310018, China
c Zhejiang Dien Biotech Co., Ltd., Hangzhou 310030, China
Keywords: Wheat allergy Gluten Surface-enhanced Raman scattering Metal-organic framework DNA recognition
ABSTRACT Gluten,known as the major allergen in wheat,has gained increasing concerns in industrialized countries,resulting in an urgent need for accurate,high-sensitive,and on-site detection of wheat gluten in complex food systems.Herein,we proposed a silver nanoparticles (AgNPs)/metal-organic framework (MOF) substrate-based surface-enhanced Raman scattering (SERS) sensor for the high-sensitive on-site detection of wheat gluten.The detection occurred on the newly in-situ synthesized AgNPs/MOF-modif ied SERS substrate,providing an enhancement factor (EF) of 1.89 × 10⁵.Benef itting from the signal amplif ication function of AgNPs/MOF and the superiority of SERS,this sensor represented high sensitivity performance and a wide detection range from 1 × 10-15 mol/L to 2 × 10⁻⁶ mol/L with a detection limit of 1.16 × 10⁻¹⁶ mol/L,which allowed monitoring the trace of wheat gluten in complex food system without matrix interference.This reliable sandwich SERS sensor may provide a promising platform for high-sensitive,accurate,and on-site detection of allergens in the f ield of food safety.
1.Introduction
Wheat (Triticum aestivumL.) plays a key role in grain consumption globally[1].Wheat is widely used in many deeply processed foods as the main source of many micronutrients and energy,such as bread,biscuits,and soy sauce[2-3].Unfortunately,wheat has been regarded as one of the “Big Eight” allergenic food ingredients by the FAO/WHO Codex Alimentary Commission[4].About 0.4% of people worldwide are affected by hypersensitivity reactions caused by wheat allergy,and this f igure is as high as 3.6%in Europe[5].According to epidemiological studies,3% of children[5]and 0.4% of adults[6]are allergic to wheat in the USA and no less than 3.6% of Northern China children suffer from wheat allergy[7].Until now,the World Health Organization and International Union of Immunological Societies have already registered 28 wheat allergens(WHO/IUIS,http://www.foodallergy.org).Among them,gluten is considered the major allergen in wheat[8].Wheat ingestion by susceptible people can induce allergic diseases mediated by IgE and following severe acute systemic anaphylaxis,such as wheat-dependent exercise-induced anaphylaxis (WDEIA),atopic dermatitis,and urticaria[9-10].Currently,several countries and organizations require food manufacturers to correctly label and highlight wheat allergens on the package,including U.S.Food and Drug Administration[11],European Union[12],China[13],New Zealand,and Australia[14].Therefore,there is a crying need for accurate,reliable,and high-sensitive methods to detect and label wheat allergens in deep-processed food products.
Currently,the most common methods for quantitative detection of wheat gluten,include the antibody-based immunoassay method (e.g.,enzyme-linked immunosorbent assay (ELISA)) and DNA-based method (e.g.,quantitative real-time polymerase chain reaction (qPCR)).García-García et al.[15]reported a sandwiched ELISA for gluten detection with a limit of detection (LOD) of 0.12 µg/mL.Martin-Fernandez et al.[16]established a qPCR to quantify gluten with a LOD of 20 mg/kg.However,ELISA is prone to negative-false results because of the partial or complete denaturation of allergenic proteins during processing and positive-false results because of antibodies cross-reactivity[17-18].Moreover,qPCR shows high sensitivity and specificity because the structure of DNA is difficult to change during such processing treatment[19].However,it is precise because the effects of PCR inhibitors (e.g.,sugars,fats) that are present during processing cause PCR amplification that cannot be obtained from food products.
As an emerging spectroscopic analysis technology,surface-enhanced Raman scattering (SERS) has become an important technology for food analysis[20-21],because of its portability,excellent sensitivity,and simple operation.Several studies have shown that SERS could be successfully applied in the detection of food allergens[22-23].Generally,various SERS substrates,such as gold nanoparticles(AuNPs),silver nanoparticles (AgNPs),and ZnO/Au,are applied in SERS technology to expand its research scope and application field.However,these traditional SERS substrates have certain limitations,such as unsatisfactory SERS activity,unsteadiness,and uncontrollable aggregation[24-25].Recently,metal-organic frameworks (MOFs),which were regarded as a type of organic-inorganic hybrid materials,are applied widely in catalysis[26],gas storage separation[27],and drug delivery[28]because of their unique properties,including ultrahigh surface area,high porosity,strong adsorption,good biocompatibility,and uniform nano-cavity structure.The porosity and ultrahigh surface area of MOFs indicate that they can connect more metal nanoparticles and Raman signal molecules,thereby enhancing Raman signal and detection sensitivity.The metal nanoparticles generated in situ on the MOF surface can form rich hot spots,thus generating stronger Raman signals.Jiang et al.[29]proposed an AgNPs/MOF-based SERS sensor that has excellent sensitivity for dopamine detection with a LOD of 0.32 pmol/L.Hence,MOF has provided new opportunities for the development of ultra-sensitive SERS sensors to detect allergenic ingredients in deeply processed food products.
Therefore,this study developed an AgNPs/MOF substrate-based SERS sensor for sensitive,specific,and on-site quantitation of wheat allergen gluten.Firstly,we designed a SERS substrate AgNPs/MOF.Based on AgNPs/MOF substrate,we developed a sandwich SERS sensor with two ssDNA,probe DNA (pDNA) and capture DNA(cDNA),which can recognize and capture target DNA (tDNA) through a hybridization reaction.The pDNA and 4-mercaptobenzoic acid (4-MBA) were bonded on AgNPs/MOF to construct a SERS-probe,while the cDNA was modified on the quartz plate.The SERS intensity of the SERS-probe was positively correlated with tDNA concentration.Finally,deeply processed food products were used to appraise the sensitivity,repeatability,and resolution of the developed SERS sensor.
2.Materials and methods
2.1 Materials and reagents
Silver nitrate (AgNO3,99.8%) was purchased from Sinopharm Chemical Reagent Ltd.(Shanghai,China).UIO-66 (C48H28O32Zr6) was obtained from Chemsoon Chemical Technology Co.,Ltd.(Shanghai,China).Tannic acid (TA,C76H52O46) was purchased from Macklin Reagent Co.,Ltd.4-MBA,(90%) was purchased from Shyuanye Biology Co.,Ltd.(3-Aminopropyl) triethoxysilane (APTES,C9H23NO3Si,98%),3-glycidoxypropyltrimethoxysilane (GPTMS,C9H20O5Si,97%),and Tetraethyl orthosilicate (TEOS,C8H20O4Si,99%) were purchased from Aladdin-Reagent Co.,Ltd.(Los Angeles,USA).The oligonucleotides used were synthesized by Sangon Biotech Co.,Ltd.(Shanghai,China),and oligonucleotide sequences are shown in Table S1.Wheat,peanut,soybean,nut,fish,biscuits,vinegar,soy sauce,curry,and meatball were bought from a local supermarket(Hangzhou,China).Purification of ultrapure water used in the study was performed with a Milli-Q system (Millipore,Massachusetts,USA).Other reagents not mentioned here are analytical grades.
2.2 Instrumentation
A Portable Raman spectrometer (RMS1000,Oceanhood,Co.,Ltd.,China) was used to obtain all the SERS spectra using 785 nm laser wavelength,power of 200 mW,and acquisition time of 1 000 ms.The TEM images were obtained by transmission electron microscope (TEM,JEOL Co.,Ltd.,Japan).Nano zeta-sizer (ZSE,Malvern Instruments Co.,Ltd.,UK) was used to measure the particle size distribution.UV-vis absorption spectra were measured using an ultraviolet visible spectrophotometer (UV-2600i,Shimadzu Co.,Ltd.,China) and the structure of materials was characterized with Fourier transform infrared (FT-IR) spectrometer (Nicolet iS5,Thermo Fisher Co.,Ltd.,USA).
2.3 Preparation of AgNPs/MOF
AgNPs/MOF was synthesized according to thein-situsynthesis method[29].The UIO-66 (15 mg) was dissolved in 9.5 mL of ultrapure water,and then 0.5 mL of TA (23.5 µmol/L) was rapidly injected into the solution under vigorous stirring.After being stirred for 20 s,the mixture was centrifugated at 9 000 r/min for 5 min three times to remove the excess TA.The precipitate was redispersed in 9.5 mL of ultrapure water.After adjusting pH to 7.5 with K2CO3(0.5 mol/L),0.5 mL of AgNO3(0.2 mol/L) was added dropwise into the solution at room temperature with stirring.After 1 h of stirring,the resultant product was centrifuged for 10 min at 9 000 r/min three times,and then the AgNPs/MOF obtained by centrifugation was dried in a vacuum drying oven at room temperature.
2.4 SERS activity of AgNPs/MOF composite as substrate
The Raman signals of 4-MBA were measured to evaluate the enhancement of the AgNPs/MOF.Typically,95 µL of AgNPs/MOF solution (1 mg/mL) was mixed with 5 µL of 4-MBA (1 mmol/L),followed by incubation for 12 h.After centrifugation,10 µL of the suspension was added onto a clean silicon wafer,then dried at room temperature and used for SERS detection.The bare MOF and AgNPs prepared by AgNO3(0.2 mol/L) were used as controls.
2.5 Preparation of SERS-probe
The SERS-Probe was prepared according to Li et al.[30]with some modifications.Briefly,AgNPs/MOF (10 mg) was suspended in 10 mL of APTES ethanol solution and 10 mL of 4-MBA solution(1 mmol/L),followed by incubation at 4 °C for 24 h.Next,the resultant product was centrifuged three times and washed with ethanol.The precipitate was dispersed in a mixture (40 mL of ethanol,1 mL of ammonia solution,and 9 mL of ultrapure water),and then sonicated for 10 min at 0 °C.Next,TEOS (0.1 g) was added to the mixture,followed by sonication at 0 °C for 1 h.During the sonication,GPTMS (0.05 g) was added to obtain AgNPs/MOF-SiO2(SERS-tag) functionalized by epoxy groups.The obtained product was successively washed with ethanol and ultrapure water,then,the sample was dried in a vacuum drying oven at room temperature.The SERS-tag (0.5 mg) was dispersed in 1 mL of pDNA solution(1 µmol/L) with stirring for 4 h.To get rid of excess epoxy groups,the centrifuged mixture was stirred in NaBH4(1 mg/mL).Finally,the SERS-probe was collected by centrifugation,dispersed in 1 mL of ultrapure water,and stored at 4 °C for further use.
2.6 Sample preparation
The total DNA of five deeply processed food products (biscuits,vinegar,soy sauce,curry,and meatball) was extracted by a GMO Food DNA Extraction Kit from Tiangen Biotech (Beijing,China).Genomic DNA of plant samples (wheat,peanut,soybean,nut) and animal sample (fish) were extracted using Rapid Plant Genomic DNA Isolation Kit and Rapid Animal Genomic DNA Isolation Kit respectively from Sangon Biotech (Shanghai,China).The concentration and quality of the DNA were assessed with a NanoDrop 2000 spectrophotometer (Thermo Fisher Scientific Co.,Ltd.,USA).Then,the total DNA was dissolved in 100 µL TE Buffer and stored at -20 °C.
2.7 Protocol for gluten determination
The quartz substrate was successively immersed in a piranha solution (70% sulfuric acid and 30% hydrogen peroxide) and a toluene solution of 1% GPTMS for 12 h to silanize the substrate surface.After that,to remove GPTMS adsorbed on the substrate,the quartz substrate was washed using ultrapure water and ethanol in sequence,and dried with nitrogen.All of the following hybridization reactions were performed at 37 °C.After that,10 µL of amino-functionalized cDNA(2 µmol/L) was added onto the quartz substrate,followed by standing for 4 h.After washing three times with ultrapure water,and the remaining active epoxy groups were reduced by NaBH4(1 mg/mL),the quartz substrate modified with cDNA was washed and stored at 4 °C for further use.Then,10 µL of tDNA was added to the cDNA-modified chip and incubated for 30 min.Finally,10 µL of SERS-probe was added onto the substrate,standing for 120 min.Afterward,to remove nonspecific bound SERS-probes,the chip was washed with ultrapure water three times.The constructed sandwich-type hybridization sensor was dried with nitrogen for SERS measurement.
2.8 qPCR assay
The qPCR assay was according to Garrido-Maestu et al.[31]with some modifications.The total volume of qPCR was 20 µL,including 2 µL of template DNA or sample DNA,10 µL of qPCR SYBR Green Master Mix (Yeasen Biotechnology (Shanghai) Co.,Ltd.,China),0.4 µL of each primer,and 7.2 µL of sterile ultrapure water.qPCR was performed in the real-time fluorescence system(Roche LightCycler480,Switzerland).The procedure of qPCR was 1 cycle of 2 min at 95 °C,40 cycles of 10 s at 95 °C,and 30 s at 60 °C.Fluorescent signals were collected for each cycle after the extension phase.The cycle threshold (Ct) value was used to reflect the initial content of the tDNA.
2.9 Statistical analysis
One-way analysis of variance was performed to determine the statistical significance of the data using SPSS software 19.0 (SPSS Inc.,Chicago,IL,USA).All experiments were performed at least three times.Origin 2018 (Origin Lab,Northampton,MA,USA) was used for data analysis.
3.Results and discussion
3.1 Principle of SERS sensor
In this study,we developed a SERS sensor based on AgNPs/MOF substrate for on-site detection of wheat allergen gluten.As shown in Fig.1,after pretreatment with piranha solution and GPTMS solution,epoxy groups were grafted onto the surface of the quartz substrate.Then,the amino group modified cDNA was covalently bound on the quartz substrate by the coupling reaction of the amino group and the epoxy group.In the presence of tDNA in samples,tDNA can be recognized and captured by its complementary sequence cDNA through a hybridization reaction.Subsequently,the tDNA could be complementary paired with pDNA on the SERS-probe,further forming a sandwich hybridization structure attached to the AgNPs/MOF substrate.With the increase of tDNA concentration,SERS-probe connected to the quartz substrate also increased,resulting in a stronger Raman signal.Thus,the SERS signal of the SERS sensor was positively correlated with tDNA concentration.It should be noted that the tDNA sequence is a specific DNA fragment of wheat gluten,and there was no found homology in yeast and environmental microorganisms[32].Hence,this developed SERS sensor provided a possibility for specific quantification of wheat gluten in food products.
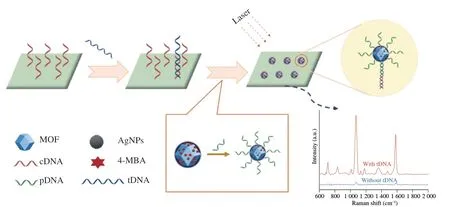
Fig.1 Schematic illustration of SERS sensor for on-site detection of wheat gluten.
3.2 Synthesis and characterization of AgNPs/MOF
To obtain an AgNPs/MOF substrate with a high Raman signal,the influences of different concentrations of AgNO3on the Raman intensity of AgNPs/MOF were studied.The digital image and TEM images of the prepared materials were shown in Fig.2A.It can be seen that the MOF with a smooth surface and octahedron crystal.Moreover,it exhibited that the surface of MOF had been successfully decorated with AgNPs and the morphology of MOF was not changed or broken.With the increasing concentration of AgNO3,the amount of AgNPs on the MOF was also increased.However,the particle size of the AgNPs was inhomogeneous when the concentration of AgNO3was more than 0.2 mol/L.The reason may be that the excessive Ag+concentration can lead to the rapid reaction rate of TA reduction,further resulting in uneven growth and aggregation of AgNPs.
Secondly,the SERS activity of the AgNPs/MOF substrate prepared using different concentrations of AgNO3was evaluated.There are three characteristic bands at 1 078,1 144,and 1 585 cm-1for 4-MBA,which can be assigned to the C-C stretching vibration-sensitive stretching vibration of benzene ring substituents,C-H deformation vibration,and C-C stretching vibration,respectively[33].Fig.2B showed that almost no clear SERS signals are associated with the 4-MBA on the bare MOF,while quite clear SERS signals can be observed on AgNPs and AgNPs/MOF.Besides,in Fig.2B,the SERS signals of all prepared AgNPs/MOF were much greater than AgNPs,especially AgNPs/MOF prepared by 0.2 mol/L AgNO3.The reason is that AgNPs/MOF demonstrated higher adsorption properties and rich hot spots compared with AgNPs,thus providing strong SERS signals[29].The enhancement factor (EF) at the peak of 1 078 cm-1of 4-MBA was calculated to be 1.89 × 10⁵for the AgNPs/MOF prepared with0.2 mol/L AgNO3.The EF was calculated by: EF=In this equation,ISERS is the intensities of the vibrational mode in the SERS spectra,whileI0represents the Raman spectra of solid 4-MBA.NSERSandN0stand for the number of 4-MBA molecules within the laser scattering volume under SERS and normal Raman conditions,respectively[34].Hence,0.2 mol/L was selected as the optimal concentration of AgNO3for the preparation of AgNPs/MOF.
Thirdly,the prepared AgNPs/MOF was described using UV-vis,FT-IR spectra,and DLS.The structure of AgNPs/MOF was characterized by UV-vis (Fig.S1).For the AgNPs/MOF,a new peak was evident at approximately 410 nm.This peak was a typical,characteristic peak for AgNPs displaying UV-vis absorption,indicating AgNPs werein-situbound to MOF.Five characteristic bands (666,745,1 399,1 579,and 3 447 cm-1) can be observed in the FT-IR spectra (Fig.S2) of MOF and AgNPs/MOF.The intense peaks at 666 and 745 cm-1correspond to the longitudinal and transverse vibration of Zr-O bonds[35].The peak at 1 579 cm-1was associated with the C-O-Zr bonding,while the peak at 1 399 cm-1belonged to the strong C-N stretching vibration[36].The characteristic peak at 3 447 cm-1corresponds to the N-H bond of 2-aminoterephthalic acid primary amine[37].These findings indicated that the modification of AgNPs on MOF cannot change the structure of MOF.The characterization of the particle size distribution of the AgNPs/MOF showed that the MOF had an average diameter of 329.3 nm,while the particle diameter of AgNPs/MOF increased to approximately 489.7 nm (Fig.S3).
3.3 Optimization of experimental conditions
To reach the optimal detection performance,we first optimized the concentration of cDNA and the incubation time of the tDNA.As shown in Fig.3A,the SERS intensity increased obviously with the increasing concentration of cDNA until 2 µmol/L.Afterward,the change of the SERS signals tends to be gentle because the surface of the AgNPs/MOF substrate was completely modified by cDNA.Hence,the optimal cDNA concentration of 2 µmol/L was selected.Next,we explored the incubation times of tDNA from 30 min to 240 min.Compared to the incubation time of tDNA at 30 min,the longer incubation time (240 min) leads to almost the same SERS intensity (Fig.3B).It was probably because the tDNA was completely bonded with cDNA at 30 min.Thus,we selected 30 min as the optimized incubation time of tDNA.

Fig.2 Characterization of AgNPs/MOF.(A) Digital image of the AgNPs/MOF (A1),and TEM images of the MOF (A2),and AgNPs/MOF with different concentrations of AgNO3 (A3-A8).(B) Raman spectra corresponding to the MOF (b),AgNPs (i),and AgNPs/MOF with different concentrations of AgNO3 (c-h).The concentrations of AgNPs: 0.05,0.1,0.15,0.2,0.25,and 0.3 mol/L in c-h,respectively.

Fig.3 Optimization of the SERS sensor detection conditions.(A) The concentration of cDNA.(B) The incubation time of tDNA.(C) The concentration of pDNA.(D) The incubation time of SERS-probe.
To develop a high-sensitive SERS sensor for quantifying wheat gluten,we optimized the concentration of pDNA and incubation time of the SERS-probe.As illustrated in Fig.3C,the SERS signal was strongly increased with the increasing pDNA concentration from 0.5 µmol/L to 4 µmol/L.The maximum SERS signal was obtained when the pDNA concentration was 1 μmol/L.However,when the pDNA concentration was more than 1 μmol/L,the change of the SERS signals tends to be gentle with a further increasing pDNA concentration,suggesting the tDNA was completely recognized by pDNA.Hence,1 μmol/L was chosen to be the optimal concentration of pDNA.The incubation time of the SERS-probe was a critical factor for the detection efficiency.Fig.3D illustrated that the SERS intensity was significantly enhanced with the extension of the incubation time of the SERS-probe from 90 min to 240 min.The SERS intensity was almost unchanged when the incubation time of the SERS-probe was more than 120 min.Therefore,the optimized incubation time of the SERS-probe was set as 120 min.
3.4 Method validation
Depending on these optimal experimental conditions,the sandwich SERS biosensor has been evaluated in terms of corresponding linearity,the LOD,the limit of quantification (LOQ),precision,accuracy (recovery),selectivity,and stability.
3.4.1 Linearity,LOD,and LOQ
Eleven different concentrations of tDNA standards (10-15,10-14,10-13,10-12,10-11,10-10,10-9,10-8,10-7,10-6,2 × 10⁻⁶mol/L)were applied to determine the linear range of the proposed SERS sensor.In Fig.4A,it could be founded that with the elevated tDNA concentration,the SERS intensity gradually increased.The SERS intensity and the logarithm of the tDNA concentration in a range of 1 × 10-15-2 × 10⁻⁶mol/L showed a linear positive correlation.The calculated linear regression equation wasY=745.57 lgX+12 475.86 with a correlation coefficient ofR2=0.995 9,whereYwas SERS intensity at 1 078 cm-1andXwas tDNA concentration (mol/L).The LOD and LOQ were calculated to be 1.16 × 10⁻¹⁶mol/L (S/N=3) and 1.56 × 10⁻¹⁶mol/L (S/N=10),respectively.Compared to the electrochemical sensor which determined a LOD of 3 × 10⁻¹⁰mol/L[32],the LOD of the proposed SERS sensor was lower,exhibiting a higher sensitivity for the quantification of wheat gluten.

Fig.4 Detection performance of the SERS sensor.(A) The standard curve of the SERS sensor for detecting wheat gluten.(B) The selectivity of the SERS sensor.***P < 0.001 in comparison to the wheat group.
3.4.2 Selectivity
To evaluate the selectivity of the proposed SERS sensor,SERS experiments were conducted with different total DNA,including wheat,peanut,soybean,nut,and fish.As displayed in Fig.4B,the SERS intensities of blank samples (peanut,soybean,nut,and fish)were close to that of the negative control,illustrating the non-specific binding of tDNA with cDNA or pDNA was negligible.These results implicated that the developed SERS sensor possessed excellent specificity for wheat detection.
3.4.3 Precision and accuracy
To evaluate the precision of the developed sensor,intra-batch and inter-batch coefficients of variation (CV) were obtained with different concentrations (10-9,10-10,10-11mol/L) of tDNA standards.The CV of the intra-batch was 1.80%-3.18% (Fig.5) and the inter-batch was 1.24%-4.29%,which indicated that the established SERS sensor here was quite reliable.
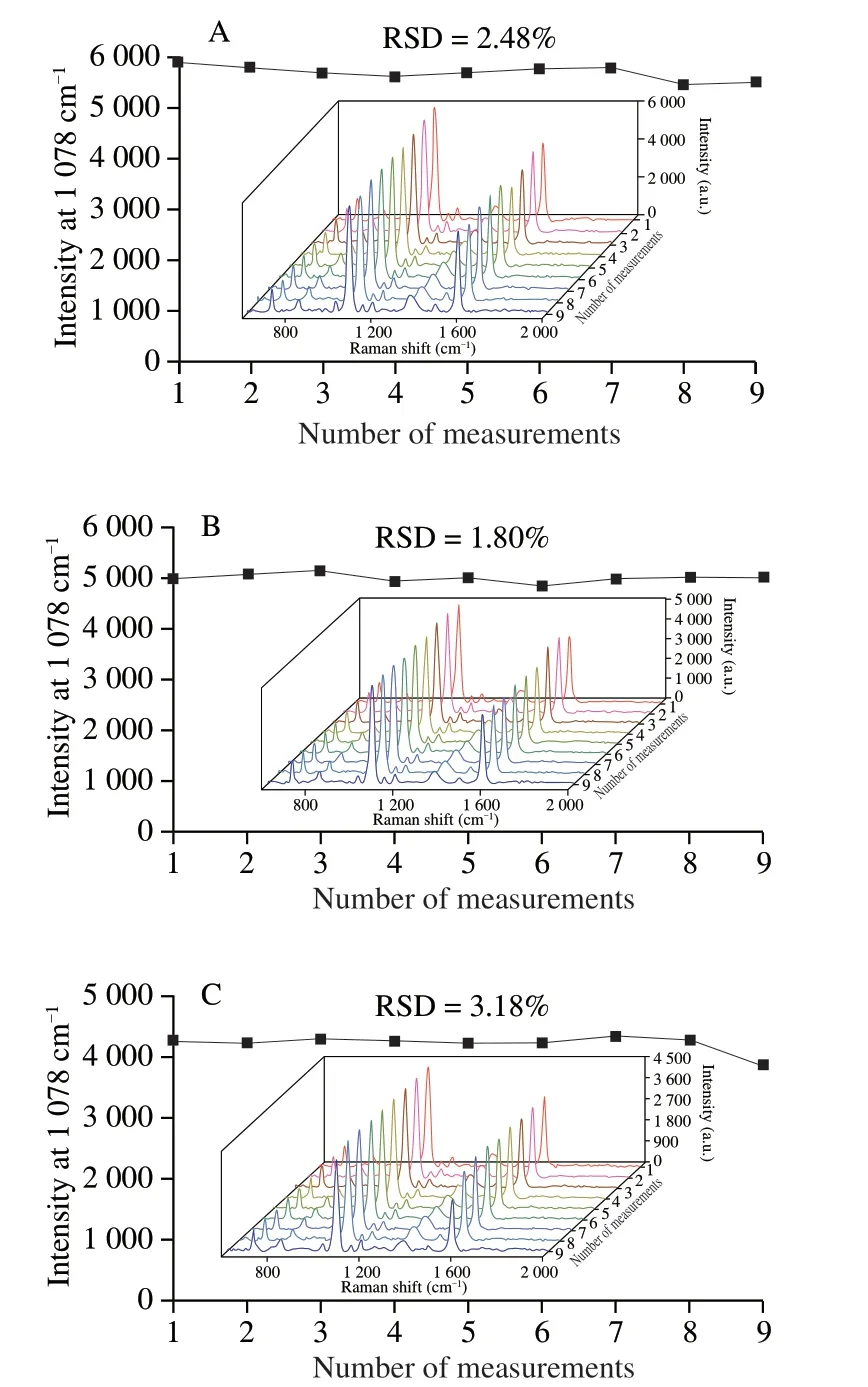
Fig.5 Intra-batch precision of the SERS sensor from 9 times measurement with different concentrations of tDNA.(A) 10-9 mol/L,(B) 10-10 mol/L,(C) 10-11 mol/L.
The accuracy of the developed SERS sensor was evaluated by the recovery test in spiked samples,which were obtained through the mixture of blank samples (peanut,soybean,and nut) and tDNA (1.0,2.0,and 4.0 μmol/L) at equal volume,respectively.As could be seen from Table S2,the recovery ranged from 96.34% to 104.44%.These results further suggested that this method exhibits good accuracy.
3.4.4 Stability
We further tested the stability of the SERS sensor under 4 °C storage conditions.The results showed that the SERS detection signals of wheat gluten still maintained 91.97% of the initial detection value within 15 days (Fig.S4),demonstrating the SERS sensor has good stability.
3.5 Real sample analysis
To study the practical applicability of the proposed SERS biosensor in quantifying gluten in wheat products,we analyzed five different total DNA of wheat products (biscuits,vinegar,soy sauce,curry,and meatball).The concentrations of the wheat allergen gluten in wheat products were back-calculated from the calibration curve.Table 1 illustrated that gluten could be detected in all of the wheat products with concentrations between 1.08 × 10⁻¹³and 1.69 × 10⁻¹¹mol/L.These results were similar to that obtained by a proposed qPCR method (Fig.S5),indicating that the established SERS sensor here can be applied as a rapid and reliable tool for high-sensitive on-site detection of wheat gluten in food products.
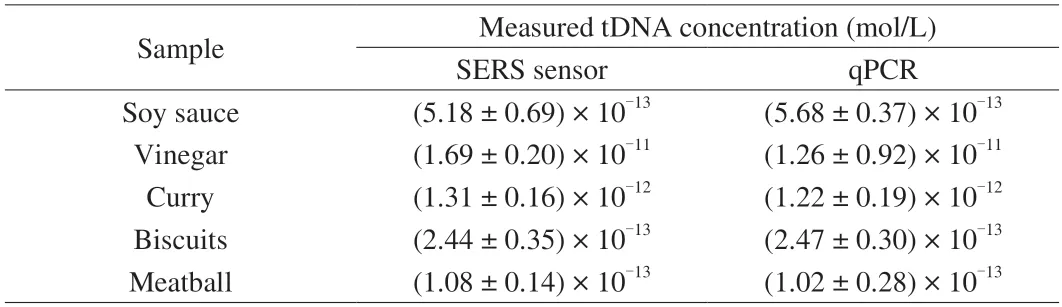
Table 1 Concentration of tDNA in wheat process samples was detected by SERS sensor and qPCR.
4.Conclusion
In summary,this work demonstrated a novel SERS sensor based on AgNPs/MOF substrate was developed for high-sensitive on-site detection of wheat gluten in deeply processed food products.The designed SERS sensor exhibited a linear detection range for wheat gluten over 1 × 10-15-2 × 10⁻⁶mol/L with the LOD of 1.16 × 10⁻¹⁶mol/L(S/N=3),showing excellent sensitivity.Encouragingly,this SERS sensor is an effective and applicable strategy for the accurate,high-sensitive,and on-site detection of wheat gluten in deeply processed products.Further work is underway to shorten the detection time to achieve rapid and accurate quantitation of wheat allergens.It was expected that the proposed SERS sensor would be widely applied in food safety control,as well as provide technical support for allergen label supervision.
Declaration of interest
Linglin Fu and Yanbo Wang are editorial board members forFood Science and Human Wellnessand were not involved in the editorial review or the decision to publish this article.The authors declare that they have no known competing financial interests or personal relationships that could have appeared to influence the work reported in this paper.
Acknowledgments
This study was financially supported by the Zhejiang Provincial Natural Science Foundation of China (LY21C200008).
Appendix A.Supplementary data
Supplementary data associated with this article can be found,in the online version,at http://doi.org/10.26599/FSHW.2022.9250057.

- 食品科学与人类健康(英文)的其它文章
- Protective effects of oleic acid and polyphenols in extra virgin olive oil on cardiovascular diseases
- Diet and physical activity inf luence the composition of gut microbiota,benef it on Alzheimer’s disease
- Inf luence of nitrogen status on fermentation performances ofnon-Saccharomyces yeasts: a review
- Ganoderma lucidum: a comprehensive review of phytochemistry,eff icacy,safety and clinical study
- Resveratrol combats chronic diseases through enhancing mitochondrial quality
- Demonstration of safety characteristics and effects on gut microbiota of Lactobacillus gasseri HMV18