
Hypoglycemic mechanism of Tegillarca granosa polysaccharides on type 2 diabetic mice by altering gut microbiota and regulating the PI3K-akt signaling pathwaye
2024-02-15 07:58QihongJiangLinChnRuiWangYinChnShangguiDngGuoxinShnShulaiLiuXingwiXiang
食品科学与人类健康(英文) 2024年2期
Qihong Jiang,Lin Chn,Rui Wang,Yin Chn,Shanggui Dng,Guoxin Shn,Shulai Liu,,Xingwi Xiang,
a College of Food Science and Technology, Zhejiang University of Technology, Hangzhou 310014, China
b Key Laboratory of Marine Fishery Resources Exploitment &Utilization of Zhejiang Province, Hangzhou 310014, China c National R&D Branch Center for Pelagic Aquatic Products Processing (Hangzhou), Hangzhou 310014, China
d Institute of Sericultural and Tea, Zhejiang Academy of Agricultural Sciences, Hangzhou 310021, China
e College of Food and Pharmacy, Zhejiang Ocean University, Zhoushan 316000, China
Keywords: Tegillarca granosa polysaccharide Type 2 diabetes mellitus Glycolipid metabolism PI3K/Akt signaling pathway
ABSTRACT Type 2 diabetes mellitus (T2DM) is a complex metabolic disease threatening human health.We investigated the effects of Tegillarca granosa polysaccharide (TGP) and determined its potential mechanisms in a mouse model of T2DM established through a high-fat diet and streptozotocin.TGP (5.1 × 10³ Da) was composed of mannose,glucosamine,rhamnose,glucuronic acid,galactosamine,glucose,galactose,xylose,and fucose.It could signif icantly alleviate weight loss,reduce fasting blood glucose levels,reverse dyslipidemia,reduce liver damage from oxidative stress,and improve insulin sensitivity.RT-PCR and Western blotting indicated that TGP could activate the phosphatidylinositol-3-kinase/protein kinase B signaling pathway to regulate disorders in glucolipid metabolism and improve insulin resistance.TGP increased the abundance of Allobaculum,Akkermansia,and Bifi dobacterium,restored the microbiota abundance in the intestinal tracts of mice with T2DM,and promoted short-chain fatty acid production.This study provides new insights into the antidiabetic effects of TGP and highlights its potential as a natural hypoglycemic nutraceutical.
1.Introduction
Tegillarca granosa,commonly known as the “blood clam,” is a marine invertebrate mainly found on the Indo-Pacific coast and belongs to theArcidaefamily in the phylumMollusca.In China,T.granosais widely distributed in the inshore provinces of Zhejiang,Shandong,and Fujian,and is farmed in captivity on a large scale.Its meat has been widely consumed as a delicacy and shows excellent potential as an antitumor,anemia-alleviating,and anti-inf lammatory agent[1].According to the Compendium of Materia Medica,its meat is commonly used to treat thirst,constipation,and f laccidity disease,benefitting the joints.Growth habitats and species differences confer upon shellf ish a diverse range of active functions and are an essential source of bioactive compounds[2].Shellfish products are abundant in acidic polysaccharides and are known for their biological activities,including hypolipidemic,hypoglycemic,hypotensive,anti-inflammatory,and antioxidant properties.Compared with traditional medicines,shellfish polysaccharides have fewer side effects,are more widely available,and are now widely exploited.However,as a crucial aquatic shellfish,only a few studies on the antihyperglycemic effect ofT.granosapolysaccharide (TGP) exist.The biological activity of TGP depends on its molecular weight (Mw),monosaccharide composition,glycosidic bonds,and other structural features.Currently,studies have focused on extraction optimization and determining the monosaccharide composition.TGP obtained by ultrasound-assisted extraction has been reported to be rich in sulfate groups,with a molecular weight of 109.65 × 10³Da,and has immunomodulatory properties[3].However,whether TGP has an antidiabetic effect and which particular hypoglycemic mechanism is related to this effect remains unclear.
Type 2 diabetes mellitus (T2DM) is a metabolic disease with an increasing annual prevalence due to the changing lifestyles of people.Based on the International Diabetes Federation (IDF),approximately 537 million adults worldwide had diabetes in 2021;these figures have been predicted to increase to 783 million by 2045.China is one of the countries with the highest number of individuals with diabetes;the numbers are expected to exceed 140 million by 2021 and 174 million by 2045[4].Interestingly,T2DM accounts for 90% of all diabetes cases and is characterized by insulin deficiency due to pancreatic β-cell dysfunction and insulin resistance[5].Additionally,patients with T2DM often suffer from severe complications due to hyperglycemia,including heart,kidney,and liver diseases[6],amplifying the disease effects.Insulin resistance and abnormal glucose and lipid metabolism are vital T2DM characteristics.Therefore,improving insulin sensitivity and glucolipid metabolism is the leading way to treat and prevent T2DM development.Currently,the available medications for treating T2DM include metformin (Met),glinide,pioglitazone,α-glucosidase inhibitors,and sulfonylureas[7].However,the longterm use of hypoglycemic drugs can cause many undesirable side effects,such as diarrhea,nausea,vomiting,and gastrointestinal dysfunction[8-9].Therefore,researchers are increasingly working to develop new drug alternatives with better hypoglycemic efficacy and fewer side effects.
In a previous study,we observed that TGPcontains fucose and sulphate groups,which have been reported to decrease hyperglycemia,protect renal function,and relieve the symptoms of T2DM[10].Therefore,in this study,we aimed to isolate and purify the polysaccharides fromT.granosaand investigate whether the purified polysaccharides could improve the symptoms in a mouse model of type 2 diabetes established using a high-fat diet (HFD) combined with streptozotocin (STZ) injection.In this study,we demonstrated the efficacy of TGP in T2DM mice.Our findings may contribute to the theoretical basis for using TGP as an antihyperglycemic functional food.
2.Materials and methods
2.1 Materials
T.granosawas obtained from the fresh live market in Daishan,Zhoushan City,Zhejiang Province.STZ,Met,mannose (Man),glucosamine (GlcN),rhamnose (Rha),glucuronic acid (GlcUA),galacturonic acid,galactosamine (GalN),glucose (Glc),galactose(Gal),xylose (Xyl),and fucose (Fuc) were obtained from Aladdin Reagent Int.(Shanghai,China).Other chemical reagents were of analytical grade.
Seven-week-old male C57BL/6J mice were purchased from Hangzhou Ziyuan Experimental Animal Science &Technology Co.,Ltd.(certificate number SCXK (zhe) 2019-0004,Hangzhou,China).The mice were housed at (23 ± 2) °C and subjected to a 12 h/12 h light/dark cycle and provided free access to food and water.Different experimental mice were fed regular and HFD,of which HFD consisted of approximately 60% of the kcal requirement(Suzhou Shuangsi Experimental Animal Feed Technology Co.,Suzhou,China).The animal experiments were conducted following the regulations of the Ethics Committee of Zhejiang University of Technology regarding the care and use of laboratory animals.
2.2 Extraction and purification of the crude polysaccharide
T.granosawas soaked in water for 24 h to remove the enriched sand,deshelled to obtain the meat,and then homogenized (5.0 kgT.granosayielded 800 g of meat).Subsequently,the homogenate was transferred to a reaction kettle with a 1:6 material:liquid (distilled water) ratio.The pH was adjusted to 6.5,1.5% papain was added,and the material was digested with the enzyme for 4.5 h at 60 °C,followed by incubation at 85 °C for 15 min to inactivate the enzyme.The mixture was centrifuged at 8 000 r/min for 15 min,and the supernatant was filtered using ceramic membranes.The clarified solution was concentrated under reduced pressure to 200 mL in a rotary evaporator at 50 °C,followed by the removal of the protein residue using the Sevag method[11](isoamyl alcohol and chloroform in a 1:5 ratio) by centrifuging for 10 min at 10 000 r/min.Anhydrous ethanol was added to the supernatant until the alcohol meter showed a reading of 75%.The crude polysaccharide was precipitated using 75% ethanol overnight and then subjected to centrifugation at 1 000 r/min for 10 min at 4 °C.Crude TGP was obtained by dissolving the precipitate in pure water,freezing at -20 °C,and freeze-drying in a vacuum.The crude polysaccharide was purified by chromatography using a DEAE-Sepharose (5 cm × 25 cm) column equilibrated with 0.01 mol/L HCl.After elution with twice the volume of 0.01 mol/L HCl,the column was washed using a NaCl gradient (0,0.5,1,1.5,2 mol/L).The eluate was collected,dialyzed,lyophilized,and named TGP.
2.3 Molecular weight measurement
The molecular weight and homogeneity of TGP were determined using high-performance gel-permeation chromatography (HPGPC).The HPGPC conditions were as follows: TSK-GELG3000SWxL gel chromatography column (300 mm × 7.8 mm);column temperature: 35 °C;mobile phase: 0.1 mol/L Na2SO4at a flow rate of 0.5 mL/min;injection volume: 20 µL;the analysis was performed using a refractive index detector.Six standard dextran solutions with different molecular weights were prepared (T series).Retention time(TR) was used as the horizontal coordinate and logarithm of molecular weight (lgMw) as the vertical coordinate to plot the standard molecular weight curve.
2.4 Monosaccharide composition analysis
Polysaccharide samples (5 mg) were subjected to total hydrolysis with 2 mol/L trifluoroacetic acid (TFA,4 mL) at 120 °C for 2 h.TFA was repeatedly removed using rotary evaporation with methanol until it was acid-free and washed out with an appropriate amount of distilled water[3].The samples and 10 monosaccharide standards were derivatized using 1-phenyl-3-methyl-5-pyrazolinone (PMP).Next,100 µL of the above standard solutions were added into 1.5 mL Eppendorf tubes with 100 µL of 0.3 mol/L NaOH and 120 µL of 0.5 mol/L PMP and derivatized at 70 °C for 1 h.Subsequently,the solution was neutralized by adding 100 µL of 0.3 mol/L HCl and extracted repeatedly with 500 µL chloroform while centrifuging.The supernatant was filtered using a 0.22 µm microporous membrane and analyzed using high-performance liquid chromatography (HPLC) using the following conditions: Column:Agilent XDB-C18(4.6 mm × 150 mm,5 µm);mobile phase: phosphate buffer (pH 6.7) and acetonitrile (82:18,V/V) at a flow rate of 1.0 mL/min;column temperature: 30 °C;injection volume: 20 µL.A diode array detector was used for analysis,and the detection wavelength was 245 nm.
2.5 Fourier-transform infrared (FT-IR) spectroscopy
The main structure of TGP was determined using an FT-IR spectrophotometer (Thermo Co.,USA) in the wavelength range of 400-4 000 nm.Wave peaks were identified,and their values were reported.
2.6 Establishment of the T2DM mouse model and TGP administration
After one week of acclimatization to laboratory conditions,mice were randomly divided into 2 groups;the group of 6 mice on a normal diet served as the control group (C).All other mice were fed HFD to establish a T2DM model.After three weeks of controlled feeding,HFD-fed mice were fasted for 8 h and intraperitoneally injected with STZ dissolved in citrate buffer (pH 4.5) at a dose corresponding to 100 mg/kg body weight (BW).Mice in group C were injected with the same volume of citrate buffer.Fasting blood glucose (FBG)levels were measured using the blood from the tail vein.FBG levels ≥ 11.1 mmol/L indicated the successful establishment of the T2DM mice model[12].Next,the diabetic mice were randomly divided into 4 groups (n=6): diabetic model group (S),positive control group (Met,200 mg/kg BW,B),TGP low-dose group (200 mg/kg BW,NL),and TGP high-dose group (400 mg/kg BW,NH).During the 4-week experimental period,mice in the drug administration and positive control groups were administered TGP or Met intragastrically once daily.In contrast,those in the normal and diabetic groups were administered distilled water.All mice were fed a normal diet of regular chow.
2.7 Measurement of FBG and insulin levels
During the 4 weeks of administration,changes in the BW and diet of mice were measured daily to determine their health status.Blood was drawn from the tail vein each week after regular 12 h fasting,and the FBG levels of different groups of mice were measured using a blood glucose meter (ONE TOUCH Ultra Easy,Johnson &Johnson Medical Devices Companies).After 4 weeks,mice were euthanized using isoflurane,and blood samples were quickly collected and centrifuged to obtain the serum.Lastly,the organs were isolated and immediately stored at -80 °C until used for subsequent assays and analyses.Fasting insulin levels (FINS) in mice serum were determined using an ELISA kit (Nanjing Jiancheng Bioengineering Institute,Nanjing,China) based on the manufacturer›s instructions.The homeostasis model assessment of insulin resistance (HOMA-IR)value was calculated with the following formula[13]:
2.8 Oral glucose tolerance test (OGTT)
After the 3 weeks of intervention,the mice were fasted overnight and administered glucose solution (2 mg/kg BW) by gavage.Subsequently,the blood glucose levels were measured using the blood from the tail vein at 0,30,60,90,and 120 min using a blood glucose meter.The area under the curve (AUC) was utilized to determine glucose tolerance.
2.9 Biochemical analysis
All the serum samples were obtained from mice that were fasted overnight.Serum total cholesterol (TC),triacylglycerol (TG),highdensity lipoprotein cholesterol (HDL-C),low-density lipoprotein cholesterol (LDL-C),superoxide dismutase (SOD),glutathione peroxidase (GSH-Px),aspartate aminotransferase (AST),and alanine aminotransferase (ALT) levels were determined using the manufacturers’ instructions in the respective assay kits (Jiancheng Bioengineering Institute,Nanjing,China).
2.10 Measurement of liver glycogen levels
Glycogen levels in the liver were measured following the manufacturer’s instructions in the kit (Jiancheng Bioengineering Institute,Nanjing,China).
2.11 Determination of the pathological effects of TGP on liver tissue
The livers were dehydrated in ethanol and xylene and preserved in 4% paraformaldehyde.The dehydrated samples were embedded in paraffin and sliced into appropriately sized sections.The sections were dewaxed,stained with hematoxylin-eosin (H&E),dehydrated,transparentized,and sealed.Liver tissue damage was observed using light microscopy.
2.12 qRT-PCR
qRT-PCR was performed as previously described.Briefly,total RNA was extracted from liver samples according to the instructions in the TRIzol reagent kit (Invitrogen Life Technologies,USA) and quantified using spectrophotometry (Quawell Technology,Sunnyvale,USA) with optical density measurements at 260 and 280 nm.cDNA was synthesized from RNA samples using a cDNA synthesis kit(TaKaRa,Dalian,China).The expression of different genes was determined using the 2-ΔΔCtequation withβ-actin as an internal reference gene[14].Primer sequences used for PCR were synthesized by Shanghai Sangon Biotech Co.,Ltd.,China.The primers used for qRT-PCR are shown in Table 1.

Table 1 Sequences of nucleotide primers used in qRT-PCR analysis.
2.13 Western blotting
Proteins were obtained from mice liver tissues,and the expression of phosphatidylinositol-3-kinase p85 (PI3K p85,1:1 000),protein kinase B (Akt,1:1 000),and glucose transporter-2 (GLUT-2,1:1 000)proteins were assayed using western blotting based on a previously published method[15].PI3K p85,Akt,and GLUT-2 were procured from Affinity Biosciences LTD (OH,USA).Briefly,mice liver tissues were homogenized in liquid nitrogen.The total proteins were extracted using T-PER (Thermo Pierce,Shanghai,China) and quantified using a bicinchoninic acid assay kit (Beyotime Biotechnology,Shanghai,China).Proteins were separated using 10% sodium dodecyl sulfatepolyacrylamide gel electrophoresis for 2 h at 80 V and transferred to a polyvinylidene fluoride membrane for 2 h at 100 V.The membranes were blocked in T-TBS (containing 5% bovine serum albumin) for 1 h at room temperature and incubated with the primary antibody overnight at 4 °C.After incubation with goat anti-Rabbit IgG (H+L)secondary antibody for 1 h at room temperature,the membrane was rinsed five times,and the protein bands were detected using an ultra-sensitive enhanced chemiluminescent reagent (Beyotime Biotechnology).The relative expression of the target protein was calculated using ImageJ software.
2.14 16S rRNA gene sequencing
Total genomic DNA of the intestinal microbiota was extracted from the cecal contents of mice using the MOBIO PowerSoil®DNA Isolation kit (MOBIO,USA).Gel electrophoresis (1%agarose) was used to assess the integrity and quality of the DNA.Primer sequences (F: 5’-ACTCCTACGGGAGGCAGCAG-3’ and R: 5’-GGACTACHVGGGTWTCTAAI) were used to amplify the V3-V4 hypervariable region of the bacterial 16S rRNA gene.According to the instructions,sequencing was performed on the Illumina Miseq PE300 platform (Shanghai Majorbio Bio-pharm Technology Co.,Ltd.,China).
Raw sequences were imported into fastp QC (0.19.6,https://github.com/OpenGene/fastp),and FLASH software (v1.2.11,https://ccb.jhu.edu/software/FLASH/index.shtml) was used for pair-end double-end sequence splicing and screening for sequence optimization.Sequence reads with > 97% similarity were grouped into multiple chimera-free operational taxonomic units (OTUs) using the Meijibio Bioconfidence Cloud (https://cloud.majorbio.com/).OTU analysis was performed using the Uparse software (v7.01090,http://www.drive5.com/uparse/).Alpha-diversity analysis was performed using the Mothur software (v1.30.2,https://www.mothur.org/wiki/Download_mothur).Principal coordinates analysis (PCoA),beta-diversity analysis,and microbial taxa distribution analyses were conducted using the Qiime software (v1.9.1,http://qiime.org/install/index.html) and the R software (v3.3.1).Correlation heatmap analysis was performed to determine the correlation between the gut microbiota,fecal metabolites,and biochemical parameters.
2.15 Determination of short-chain fatty acid (SCFA) levels in mice feces
SCFAs in the cecal contents of mice were determined using gas chromatography (GC;Agilent 7890A).The detection system was equipped using an Agilent J&W GC column (30 m × 320 µm ×0.25 µm) and a flame ionization detector.The experimental conditions were as follows: initial column temperature maintained at 100 °C for 1 min and then increased to 150 °C at a rate of 2 °C/min for 5 min;injector temperature maintained at 270 °C and detector temperature of 280 °C.Hydrogen,air,and nitrogen were used as supplementary gases at flow rates of 30,4,and 5 mL/min,respectively,and the constant column flow+tail blow flow rate was 31.5 mL/min.The sample volume was 1 µL,and the column flow rate was 2 mL/min.
2.16 Statistical analysis
Experimental data are expressed as mean ± standard deviation(SD).Differences between groups were analyzed using a one-way analysis of variance (ANOVA) followed by Duncan’s test or Tukey’s post hoc test.P< 0.05 orP< 0.01 was considered statistically significant.All statistical analyses were performed using SPSS 19.0(SPSS Inc.,Chicago,IL,USA).
3.Results
3.1 Isolation and purification of polysaccharides
The crude polysaccharides extracted from the meat ofT.granosausing hot water were purified by separation on a DEAE-Sepharose gel column to obtain the pure,water-soluble polysaccharide TGP.The samples were analyzed using HPGPC to determine homogeneity and the relative molecular mass.The standard curve equation was lgMw=-0.331 7x+9.840 4 (R2=0.990 8).The results indicated that the molecular weight of TGP was approximately 5.1 × 10³Da (Fig.1A).
3.2 Monosaccharide composition of TGP
TGP was hydrolyzed with TFA and derivatized using precolumn PMP to determine monosaccharide components using HPLC.As shown in Fig.1B,the monosaccharide composition of TGP is complex.TGP is a heteropolysaccharide containing neutral,acidic,and basic sugars.The neutral sugars included five-carbon and sixcarbon methyl sugars.The monosaccharides of TGP included Glc,GlcN,Man,Gal,Fuc,Xyl,Rha,GlcUA,and GalN.The Man:GlcN:Rha:GlcUA:GalN:Glc:Gal:Xyl:Fuc ratio was 1:1.38:0.87:0.53:0.52:5.37:1.38:1.05:2.40.
3.3 FT-IR spectroscopy
The FT-IR spectrum of TGP is shown in Fig.1C.The peaks near 3 428 cm-1represent O-H stretching vibrations,and the peak at 2 945 cm-1indicates C-H stretching vibrations.Overlapping peaks of acetyl C=O vibrations and crystalline water of GlcUA carboxylate and GlcN are present near 1 648 cm-1.The stretching vibrations of C-O in GlcUA carboxylate are present at 1 429 cm-1.The peaks at 1 130-1 170 cm-1indicate C-O-C stretching vibrations within the sugar ring.Additionally,the presence of stretching vibrations of the sulfate group S=O near the peak at 1 240 cm-1and a peak at about 850 cm-1are attributed to the axial stretching vibrations of C-O-S,which indicate the presence of sulfate substitution.A swinging vibration of the secondary terminal group of the pyran ring (Fuc) at 964 cm-1in the spectrum shows a significant amount of Fuc.

Fig.1 Explanation of TGP structure.(A) HPGPC of molecular weight determination.(B) PMP-HPLC method for the determination of the monosaccharide composition of polysaccharides.B1 is the complete hydrolysis product of TGP;B2 is the monosaccharide standard mixture.(C) FT-IR spectrogram.
3.4 Effect of TGP on the BW of diabetic mice
During the experimental period,the BWs of mice in each group were measured weekly.The BW of mice with T2DM decreased by 9.16% compared with that at the start of the study,whereas the BWs of mice in the C,B,NL,and NH groups increased by 7.83%,4.4%,0.86%,and 2.82%,respectively (shown in Fig.2A).Compared with that in the S group,the weight gain of mice was increasingly significant after Met and TGP interventions (P< 0.05),and the growth rate of mice in the NH group was higher than that in the NL group,which suggested that TGP alleviated weight loss in diabetic mice in a dose-dependent manner.
3.5 TGP ameliorates FBG levels and insulin resistance in diabetic mice
To better evaluate the effect of TGP in T2DM,we measured the changes in FBG,FINS,and HOMA-IR in diabetic mice after different interventions.Figs.2B,D,and E show that FBG levels in diabetic mice were significantly higher than in the control group (P< 0.05).After 4 weeks of continuous administration,the FBG levels of mice in the model group remained significantly higher than those in the control group (P< 0.05).In contrast,FBG levels were significantly lower (P< 0.05) after Met and TGP interventions.There were no significant differences between treatments with 400 mg/kg TGP and Met after 4 weeks of intervention,indicating that TGP significantly reduced FBG levels in hyperglycemic mice.As shown in Fig.2D,serum insulin levels of diabetic mice were significantly (P< 0.05)higher than mice in group C.After 4 weeks of intervention with Met,low-dose,and high-dose TGP,the serum insulin levels of mice in the B,NL,and NH groups were reduced by 52.40%,22.86%,and 38.93%,respectively (P< 0.05).The HOMA-IR value is an important indicator used to evaluate the efficiency of blood glucose reduction,and the values were calculated using the formula presented in the Methods section.The lower the HOMA-IR value,the weaker the insulin resistance.Compared with the control group,the HOMAIR values of diabetic mice increased by nearly 6-fold (P< 0.05),indicating severe insulin resistance (Fig.2E).However,after 4 weeks of TGP administration,the HOMA-IR values decreased significantly in the high-dose TGP group (P< 0.05).These findings suggested that TGP could significantly reduce insulin resistance in mice with type 2 diabetes.
3.6 Results of OGTT in mice with T2DM
In the OGTT,the blood glucose levels of mice in all groups increased sharply within 30 min after oral glucose administration and then decreased between 30 min and 120 min.A dose-dependent improvement in blood glucose levels was observed after TGP administration compared with that in the model group (Fig.2C).The blood glucose concentration AUC increased significantly in the diabetic group compared with that in the normal group(P< 0.05),suggesting that glucose tolerance in mice with T2DM had deteriorated significantly (Fig.2F).Notably,after high-dose TGP and Met interventions,the AUC decreased within 120 min by 26.10% and 38.14%,respectively,suggesting a significant (P< 0.05) improvement in glucose tolerance of mice with T2DM.

Fig.2 TGP treatment improves insulin resistance in T2DM mice.(A) Body weight,(B) FBG,(C) Time course of blood glucose levels during the OGTT,(D) FINS,(E) HOMA-IR,and (F) AUCs of OGTT.All data were expressed as mean ± SD (n=6).Different lowercase letters (a-e) are used to indicate significant differences between groups (P < 0.05).
3.7 TGP improves dyslipidemia in mice with T2DM
Dyslipidemia is a key characteristic of patients with T2DM.High TC and TG levels can lead to atherosclerosis,triggering cardiovascular disease[16].The levels of TC (Fig.3A),TG (Fig.3B),and LDL-C(Fig.3C) in serum were significantly higher in diabetic mice than in normal mice (P< 0.05).In contrast,HDL-C levels (Fig.3D)decreased significantly,indicating a severe lipid metabolism disorder in mice with T2DM.Moreover,TC and TG levels of mice in the NH group decreased significantly (P< 0.05) after intervention with TGP and reduced slightly in mice in the NL group.In addition,LDL-C levels decreased significantly in the B,NL,and NH groups of mice(P< 0.05),whereas HDL-C levels increased slightly.These results indicated that TC,TG,and LDL-C levels were effectively decreased in diabetic mice by TGP,whereas HDL-C levels were increased,thereby reducing the risk of cardiovascular disease.
3.8 TGP improves oxidative stress and liver tissue damage in diabetic mice
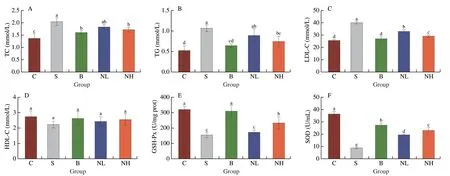
Fig.3 Effects of TGP on serum lipid levels in STZ-induced type 2 diabetic mice.(A)TC,(B)TG,(C)LDL-C,(D)HDL-C,(E) GSH-Px,(F) SOD,(G) Hepatic glycogen content,(H) ALT and (I) AST.All data were expressed as mean ± SD (n=6).Different lowercase letters (a-d) are used to indicate significant differences between groups (P < 0.05).
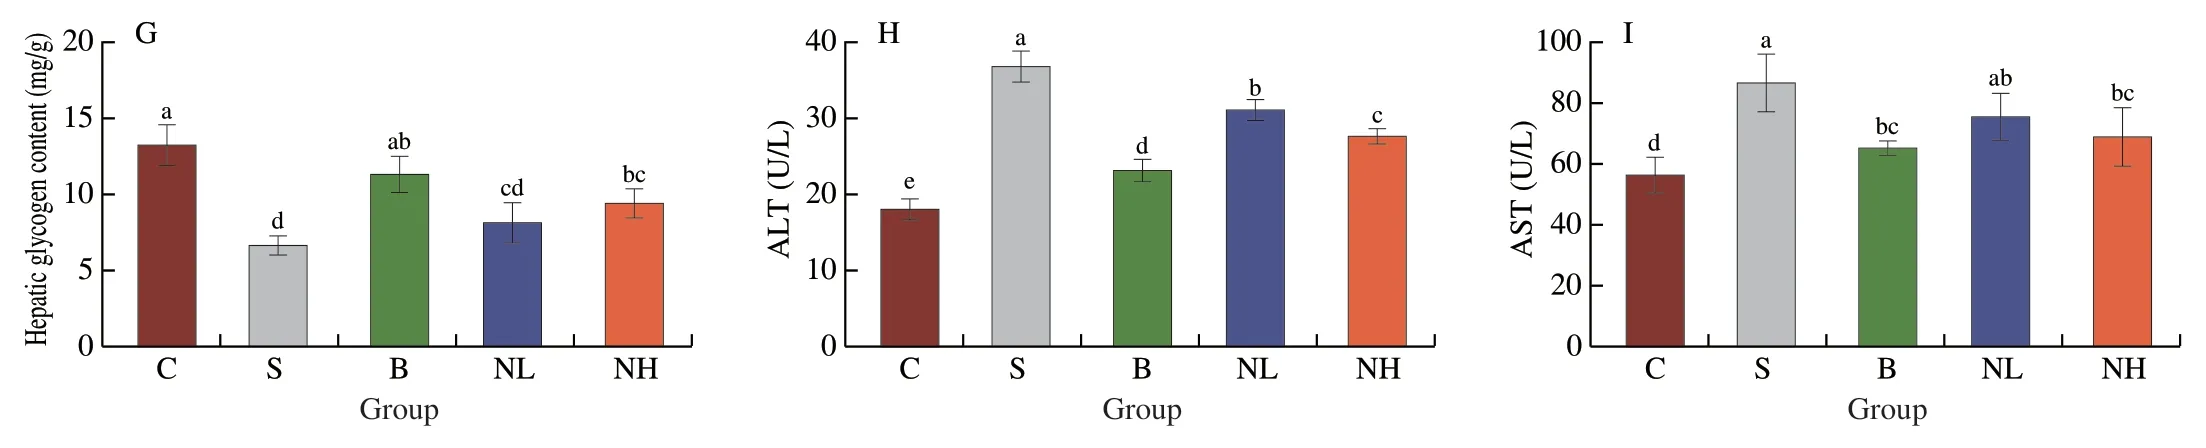
Fig.3 (Continued)
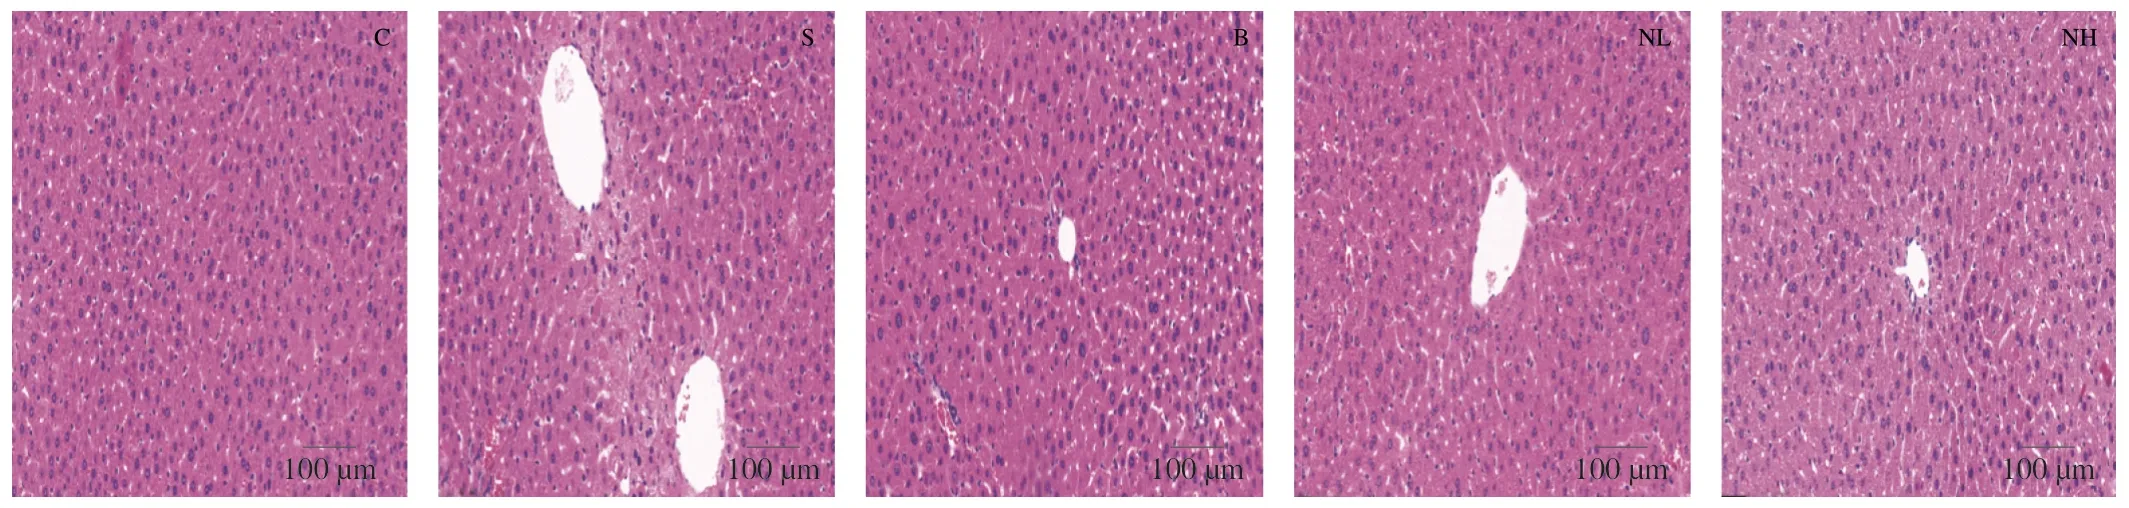
Fig.4 Histopathological features of liver in the experiments.Liver tissues were stained with H&E.Scale bar=100 µm.
An increasing number of studies demonstrate that the antioxidant enzymes GSH-Px and SOD play an essential role in human health[17].In this study,the antioxidant effect of TGP in diabetic mice was evaluated by measuring serum GSH-Px and SOD levels.The activities of GSH-Px (Fig.3E) and SOD (Fig.3F) were significantly reduced in the diabetic group compared with that in the control group (P< 0.05).In contrast,TGP gavage significantly improved GSH-Px and SOD activities and enhanced oxidative stress in a dose-dependent manner compared with rats in the model group (P< 0.05).TGP can restore the antioxidant defense system in HFD/STZ-induced mice model of diabetes.In recent years,T2DM has been frequently associated with metabolic-associated fatty liver disease[18].Therefore,H&E staining of mouse livers was performed after different treatments (Fig.4).The livers of normal mice showed neatly arranged hepatocytes with normal morphology and visible nuclei,whereas those of diabetic mice had disordered hepatocytes with lipid vacuolation,steatosis,and cell enlargement.After 4 weeks of intervention,TGP could alleviate these pathological features and result in a morphology similar to that of hepatocytes obtained from healthy mice.The uptake and utilization of glucose by the liver were investigated further to investigate the effect of TGP on glucose metabolism.As shown in Fig.3G,glycogen concentration was significantly reduced in mice with T2DM(P< 0.05),and glycogen levels were significantly restored by TGP administration (P< 0.05).Moreover,the release of liver enzymes such as ALT and AST indicates damage to the hepatocyte membrane due to oxidative stress[19].It can be seen in Figs.3H and I that the administration of TGP to diabetic mice reduced ALT and AST levels and decreased the extent of lipid peroxidation in the liver.These findings indicated that TGP could inhibit oxidative stress and enhance hepatic metabolism,thereby regulating blood glucose homeostasis.
3.9 TGP enhanced the expression of glucose metabolism and antioxidant enzyme-related genes
In this experiment,the mRNA expression levels ofIRS-2,PI3K,Akt,GLUT-2,GSK3β,PPAR-γ,SOD,andGSH-Pxwere determined using RT-PCR (Fig.5).The expression ofIRS-2,PI3K,Akt,GLUT-2,PPAR-γ,SOD,andGSH-Pxwas significantly decreased,and that ofGSK3βwas remarkably increased in diabetic mice compared with those in group C (P< 0.05).In the NL group,IRS-2,Akt,GLUT-2,PPAR-γ,andGSH-Pxexpression were significantly higher than in diabetic mice (P< 0.05).Similarly,in the NH group,elevations in the expression ofIRS-2,Akt,GLUT-2,PPAR-γ,SOD,andGSH-Pxwere observed,but theGSK3βlevel decreased significantly(P< 0.05).These results suggested that the administration of TGP to mice with T2DM could activate the expression of the PI3K/Akt signaling pathway-related genes,affecting glucose transport and glycogen synthesis to regulate glucose metabolism.Furthermore,SODandGSH-Pxexpression was significantly increased,improving the antioxidant capacity of mice with T2DM.
3.10 TGP activated PI3K/Akt/GLUT-2 protein signaling pathway
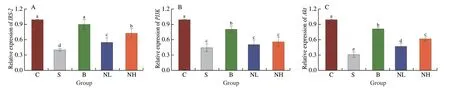
Fig.5 Effect of TGP on (A) IRS-2,(B) PI3K,(C) Akt,(D) GLUT-2,(E) GSK3β,(F) PPAR-γ,(G) SOD and (H) GSH-Px mRNA expression in the liver.Different lowercase letters (a-d) are used to indicate significant differences between groups (P < 0.05).
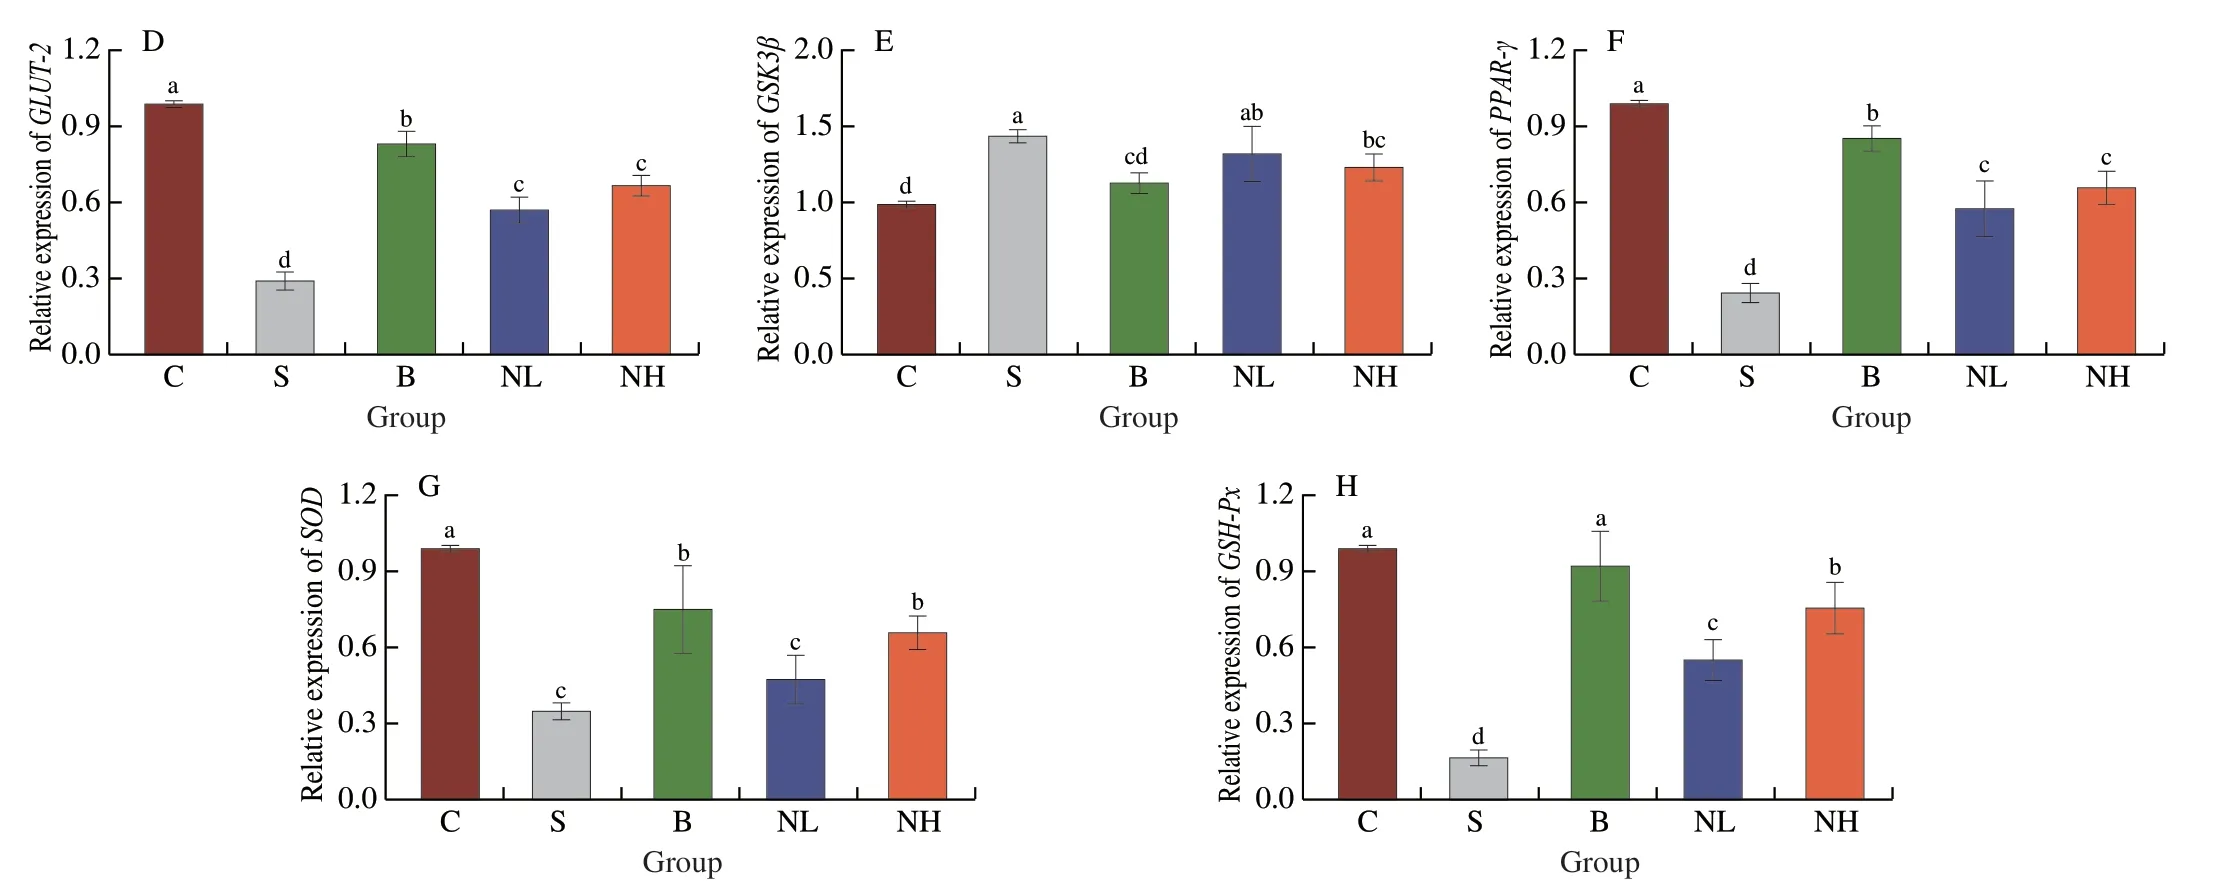
Fig.5 (Continued)
To further elucidate the potential mechanisms of alleviating hyperglycemia,insulin resistance,and dyslipidemia by TGP,we used western blotting to determine the protein expression of the PI3K/Akt/GLUT-2 pathway in mice livers.Results from Western blotting for p-PI3K,PI3K,p-Akt,Akt,and GLUT-2 expression are shown in Fig.6.p-Akt/Akt,p-PI3K/PI3K,and GLUT-2 protein expression were significantly decreased in diabetic mice compared with mice in group C (P< 0.01).Met or TGP intervention led to a significant upregulation (P< 0.05).Combined with the results from RT-PCR(Fig.5),we could infer that TGP could regulate glucose balance by activating the expression of GLUT-2,a gene downstream of IRS/PI3K that affects glucose transport and hepatic glycogen synthesis.
3.11 Effect of TGP on the structural composition of gut flora
The impact of TGP intervention on the microbiota in mice cecal samples was investigated using 16S rRNA high-throughput sequencing technology.In total,864 888 sequences and 563 different OTUs from 24 samples (n=6/group) were provided.The Pan/Core and rarefaction curves (Figs.S1A-C) show clear asymptotes.These results confirm that the amount of sequencing data is sufficient.
The abundance of microbiota diversity in mice with T2DM was analyzed based on the alpha and beta diversities.Compared with those in diabetic mice,the Chao1,Shannon,and Ace indices were significantly higher in mice in the C,B,and NH groups,with the increase in Chao1 and Ace indices being significant (P< 0.01) and the increase in Shannon index was not significant (Figs.7A-C).The Venn diagram (Fig.7D) shows that the number of OTUs in the C,S,B,and NH groups was 730,629,673,and 730,respectively.The number of mutual OTUs for all samples was 503,with a similarity of 97%.In the normal and model groups,there were 166,65 unique OTUs and 564 shared OTUs,respectively,indicating differences in the microbial composition between normal and diabetic mice.In contrast,the Met-and TGP-treated groups shared 621 and 662 OTUs,respectively,with the normal group.In addition,similarities between bacterial communities at the genus level were analyzed using PCoA and nonmetric multidimensional scaling (Figs.7E,F).The distance rank calculated at the genus level (Bray-Curtis) (Fig.S1D) shows that the differences between the experimental groups are more significant than the differences between groups.These results indicated that the structural composition of the microbial community was completely separated between the diabetic and normal groups of mice.As expected,TGP could reverse the abundance of the disrupted gut flora and bring it closer to that in the normal group.
3.12 Composition and abundance analysis at the phylum level
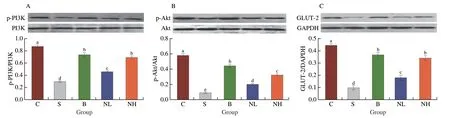
Fig.6 Effect of TGP on protein expression in liver.The relative expression of (A) p-PI3K/PI3K,(B) p-Akt/Akt and (C) GLUT-2 were calculated and were shown,respectively.All data were expressed as mean ± SD (n=6).Different lowercase letters (a-e) are used to indicate significant differences between groups (P < 0.05).
To further assess the impact of TGP on the gut flora,we analyzed the community abundance at the phylum and genus levels.At the phylum level (Fig.7G),Firmicutes,Bacteroidota,Desulfobacterota,Actinobacteriota,Verrucomicrobiota,Patescibacteria,and Proteobacteria were the dominant members,with their abundance accounting for more than 98% of the microbial community.The relative abundance of Firmicutes decreased,and that of Bacteroidota increased in diabetic mice,and Firmicutes/Bacteroidota (F/B) ratio(1.54) was significantly lower compared with that of group C (1.785).After 400 mg/kg TGP treatment,the F/B ratio was 2.44,higher than the S group.In addition,the relative abundance of Verrucomicrobiota and Proteobacteria in the gut flora of mice in the NH group increased,and that of Actinobacteriota decreased compared with the relative abundance of gut flora in group S.Verrucomicrobiota is usually negatively correlated with body weight.These findings confirmed that HFD/STZ induction altered the microbiota composition,whereas TGP intervention could reverse and normalize this trend.
3.13 Composition and abundance analysis at the genus level
Gut microbiota composition (> 0.1% abundance) at the genus level is summarized in Fig.8A.Norank-f-Muribaculaceae,Allobaculum,Lachnospiraceae-NK4A136-group,Desulfovibrio,Lactobacillus,unclassified-f-Lachnospiraceae,andAkkermansiawere the most dominant genera in the four experimental groups(Fig.8C).The extended error bar plot shows significant differences between the mean proportions of bacterial taxa in samples from the C,S,and NH groups.Fig.8B shows norank-f-Muribaculaceae,Allobaculum,Lachnospiraceae-NK4A136-group,Akkermansia,Dubosiella,Faecalibaculum,andParasutterellaabundance were significantly reduced in the diabetic group.In contrast,the abundance of norank_f__Clostridium_methylpentosum_group,norank_f__Lachnospiraceae,Candidatus_Saccharimonas,Alistipes,Bacteroides,Desulfovibrio,and unclassified-f Lachnospiraceae increased significantly compared with group C.After treatment with TGP,the abundance ofAllobaculum,Akkermansia,Dubosiella,andBifidobacteriumincreased significantly (P=0.005,P=0.020,P=0.008,andP=0.031,respectively).In contrast,the abundance of norank_f_Lachnospiraceae andDesulfovibriodecreased (Fig.8D).Overall,these results suggested that 400 mg/kg TGP could positively affect the dysbiosis of the gut microbiome induced by the HFD/STZ combination.
3.14 Effect of TGP on SCFAs
SCFAs are essential products of fermentation synthesized by the main microorganisms in the gut.As shown in Fig.9A,the fecal levels of acetic,propionic,butyric,and valeric acids were significantly reduced in mice in group S compared with those in group C(P< 0.05).TGP treatment significantly reversed the decrease in fecal SCFAs in diabetic mice (P< 0.05) in a dose-dependent manner and increased the concentrations of acetic,propionic,and butyric acids.The concentrations of acetic,propionic,butyric,and valeric acids in feces were 1.24,1.31,1.47,and 1.25 times higher in the NH group compared with group S.
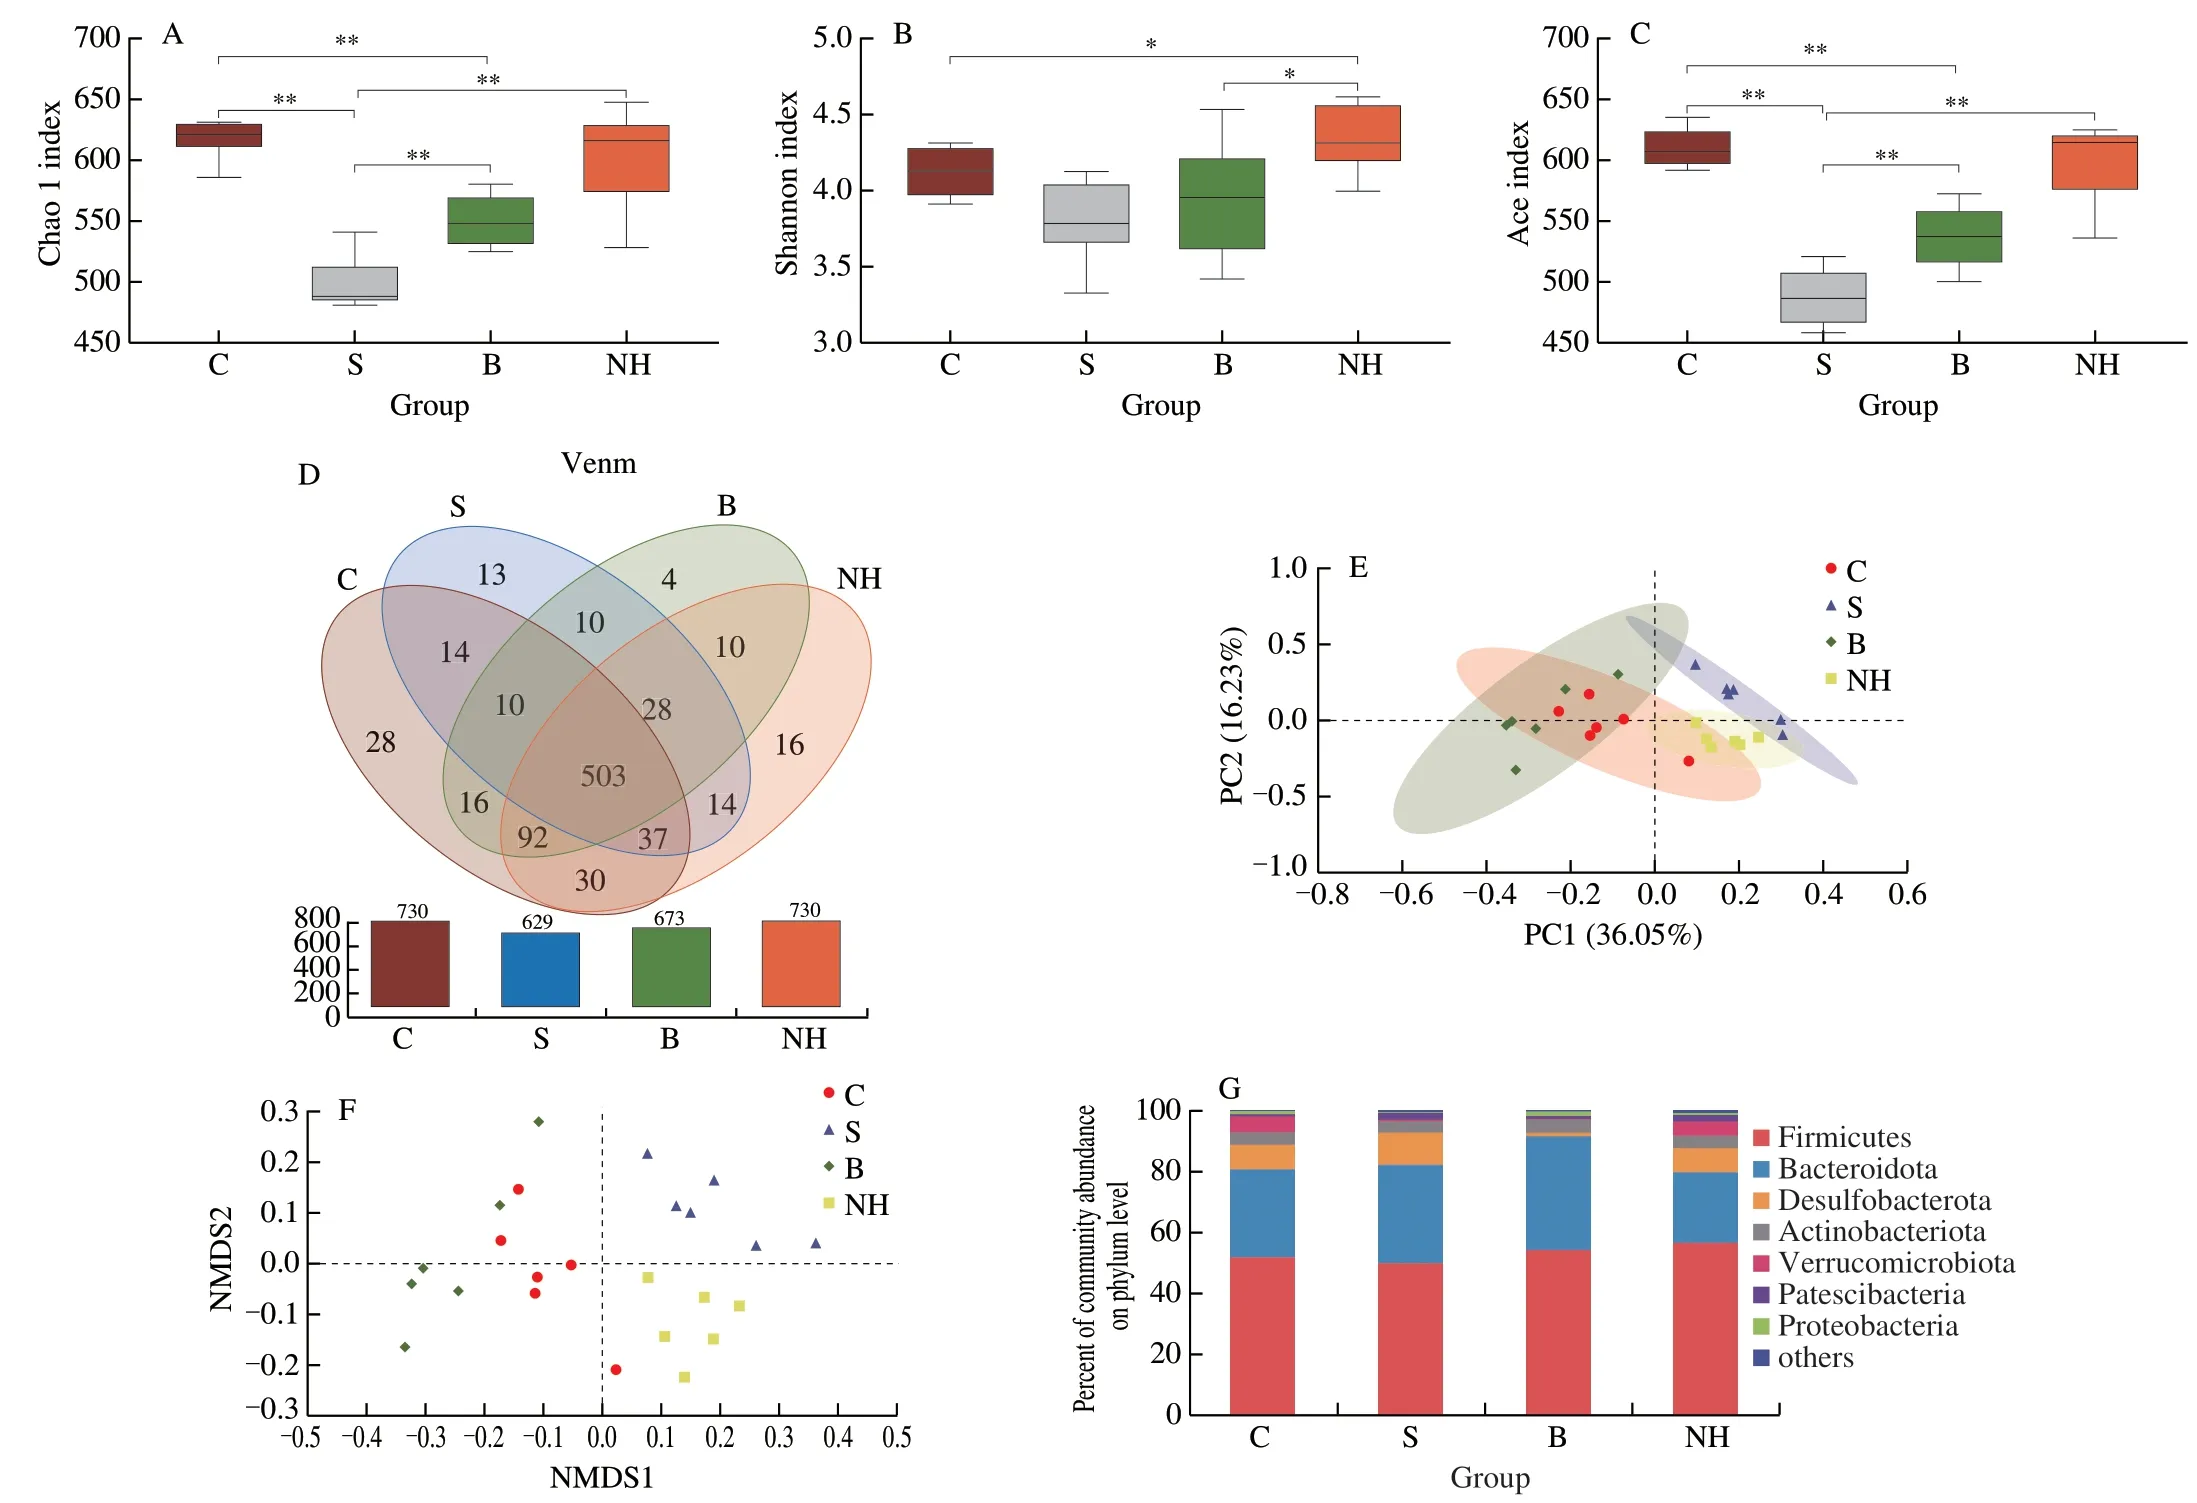
Fig.7 Effect of TGP on intestinal flora structure and diversity in mice.(A) Chao1 index,(B) Shannon index,(C) Ace index,(D) Venn diagram,(E) PCoA analysis diagram,(F) NMDS analysis diagram,(G) Percent community abundance diagram on phylum level.All data were expressed as mean ± SD (n =6).*P < 0.05,and **P < 0.01.

Fig.8 (A) Percent community abundance diagram on genus level.(C) The left semicircle represents the genera composition,and the right semicircle indicated the distribution of each genus in the experimental groups.Phylotypes were significantly different between C and S groups (B),S and NH groups (D) at the genus level.In each group,n=6.*P < 0.05,**P < 0.01 among C or NH vs.S group.
3.15 Correlations between diabetes-related indices, intestinal flora, and SCFAs
Correlations between diabetes-related indices and intestinal flora and SCFAs were investigated with Spearman correlation analysis.As indicated in Fig.9B,Allobaculum,Akkermansia,Dubosiella,and norank-f-Muribaculaceae were positively correlated with SCFAs,especially acetic acid,propionic acid,and butyric acid;and negatively associated with insulin resistance and glycogen,and AST,ALT,TC,TG,and LDL-C levels.These findings indicated that the increased relative abundance of bacteria such asAllobaculumandAkkermansiacould promote SCFA production,reduce insulin resistance,and improve disorders in glucolipid metabolism.In contrast,Desulfovibrio Lactobacillus,norank_f_Lachnospiraceae,norank-f-Clostridiummethylpentosum-group,Candidatus-Saccharimonas,andAlistipeswere negatively correlated with acetic acid,propionic acid,and butyric acid,but positively correlated with T2DM.Therefore,the increased abundance ofDesulfovibrio,Lactobacillus,norank_f_Lachnospiraceae,andAlistipesmay be associated with the induction of hyperglycemia and hyperlipidemia.In summary,our findings suggested that hyperglycemia-induced intestinal flora could be modulated by TGP administration and lead to a healthy intestinalflora composition similar to that in the normal group.
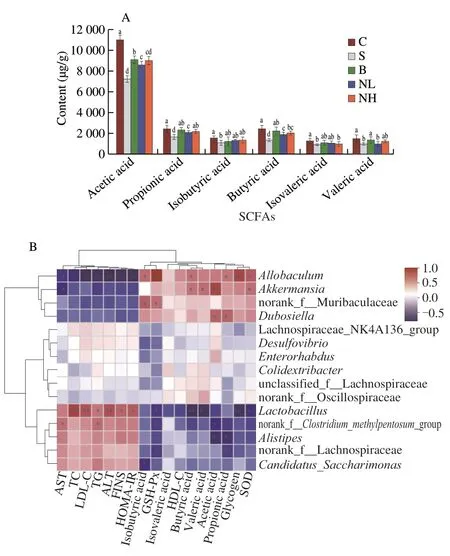
Fig.9 (A) Effect of TGP on intestinal flora structure and SCFA in mice.Different lowercase letters (a-e) are used to indicate significant differences between groups (P < 0.05).(B) Pearson correlation analysis between the top 15 microbial genera in the intestinal flora and related parameters of hyperglycemic and insulin-resistant mice.All data were expressed as mean ± SD (n=6).*0.01 < P ≤ 0.05,**0.001 < P ≤ 0.01,***P ≤ 0.001.
4.Discussion
T2DM is a complex metabolic disease primarily characterized by insulin resistance and hyperemia and accounting for over 90%of cases of diabetes.There has been a substantial increase in the number of cases of T2DM[4].Disturbances in lipid metabolism and dysregulation of glucose homeostasis mechanisms are vital triggers of insulin resistance[20].Compared with conventional drugs,naturally occurring compounds are known for their safety and versatile biological activities in treating insulin resistance and T2DM[21].T.granosahas diverse biological activities;however,the mechanism of its hypoglycemic activity is unclear.Coastal marine clams are rich in saccharides,but their soft tissues contain less glycosaminoglycan content[22].TGP is the main active component withinT.granosa,which can be procured through aqueous extraction combined with alcoholic sedimentation extraction.In this study,HFD and an injection of STZ were used to induce diabetes in mice.During the test period,diabetic untreated mice did not have any remission in blood glucose levels or show alleviation of the related symptoms of diabetes,indicating the successful establishment of the rodent model of diabetes and adherence to the requirements of our study.
In this study,TGP was isolated and purified from the meat ofT.granosa.The polysaccharide comprised mannose,glucosamine,rhamnose,glucuronic acid,galactosamine,glucose,galactose,xylose,and fucose,with a molecular weight of approximately 5.1 × 10³Da.FT-IR spectroscopy data indicated that the TGP also had sulfate groups.Research showed that fucoidan,which has a core structure of fucose and sulphate groups,showed various biological activities,including antioxidant,antitumor,hypoglycemic,and antiviral[23].Furthermore,compared to other non-sulfated polysaccharides,sulfated polysaccharides have lower flexibility,greater polarity,and electronegativity.These unique physicochemical properties confer specific bioactivities associated with anti-hyperlipidemia[24]and anti-hyperglycemia[25].Many sulfated polysaccharides have been successfully isolated from shellfish and applied to restore metabolic disorders due to obesity[26].Theoretically,TGP should have significantly ameliorated lipid metabolism disorders and hypoglycemic activity.In our research,we tested and verified this hypothesis.The studies show that the BWs of mice with T2DM decreased by(9.16 ± 2.66)% after 4 weeks of feeding,which was a significant decrease compared with the weight trend in the normal group (Fig.2A).This decrease may be due to reduced insulin sensitivity,poor blood glucose control,and excessive catabolism of proteins to amino acids for gluconeogenesis[27].What’s more,we found that the oral administration of Met and TGP could significantly reduce FBG levels in diabetic mice (Fig.2B),decrease serum fasting insulin levels(Fig.2D),improve insulin resistance (Fig.2E) and glucose tolerance(Fig.2F),and reverse weight loss.The data fully confirm that TGP has the same ameliorating and stabilizing effect on disorders of glucolipid metabolism as other sulphated polysaccharides.
Clinical studies have reported that T2DM could lead to atherosclerotic dyslipidemia[28],with increased TC,TG,and LDL-C and decreased HDL-C levels.The development of ischemic heart disease is positively associated with increased TC and TG levels and negatively associated with decreased HDL-C levels[12].The current study revealed that the TC,TG,and LDL-C levels in diabetic mice decreased significantly,and HDL-C levels increased significantly after treatment with TGP,leading to the alleviation of hyperlipidemia caused by metabolic disorders in diabetes (Figs.3A-D).Oxidative stress may result from the production of reactive oxygen species and their unbalanced neutralization through various antioxidant (enzymatic and nonenzymatic)-mediated pathways[29].Previous reports have demonstrated that oxidative stress may lead to β-cell dysfunction and dyslipidemia,which is an important mechanism inducing insulin resistance[30].In this work,we found that GSH-Px and SOD levels were significantly reduced in mice with T2DM (Figs.3E and F) and could be reversed after TGP treatment,suggesting its role in reversing oxidative stress and insulin resistance in alleviating the symptoms of T2DM.Additionally,the high dose intervention of TGP resulted that serum ALT and AST levels decreased significantly,repairing liver damage and promoting the conversion of glucose to glycogen and thereby reducing blood glucose levels (Figs.3H and I).Bhatt et al.[31]found that the interaction between diabetes and liver injury was mainly regulated by oxidative stress.Therefore,it is possible that TGP may improve insulin resistance,dyslipidemia,and oxidative stress and also restore liver damage.
The liver is an essential endocrine organ in the body that controls glucose and lipid metabolism and plays a vital role in regulating blood glucose homeostasis.Activation of PI3K regulates glucose uptake,and Akt is the primary signaling substance produced upon PI3K activation.The PI3K/Akt signaling pathway regulates insulin signaling and glucose metabolism[32].A recent study found that Liubao brick tea improved hepatic metabolic disorders,oxidative stress,and inflammation in T2DM mice by activating the PI3K/Akt signaling pathway[21].He et al.[33]discovered thatVeratrilla bailloniiFranch could regulate blood glucose by upregulating IRS-1/PI3K/Akt signaling to inhibit gluconeogenesis.The main feature of diabetes mellitus is the complex malfunction in regulating glucose homeostatic mechanisms.Impairment in glucose transport facilitated by GLUT leads to reduced insulin sensitivity,impaired glucose utilization and storage,and hyperglycemia[34].In this study,we examined the expression of the PI3K/Akt pathway proteins in the liver.We found that p-PI3K/PI3K,p-AKT/Akt,and GLUT-2 protein expression were downregulated in the livers of diabetic mice compared with those in the normal group.In contrast,TGP could activate the PI3K/Akt pathway and significantly upregulate p-PI3K,p-Akt,and GLUT-2 protein expression,thereby regulating the disruption of glucolipid metabolism (Fig.6).In addition,RT-PCR findings indicated that TGP intervention could activate GSK3β,PPAR-γ,and GLUT-2,genes downstream of the PI3K/Akt pathway,compared with that in diabetic mice (Fig.5).GLUT-2 is a major glucose transporter,and the inactivation of its gene inhibits glucose uptake and glucose-stimulated insulin secretion[35].In addition,glycogen synthase (GS) kinase-3β (GSK3β) and GS were regulated by p-Akt.Studies have depicted that the high expression of GSK3β is related to reduced insulin sensitivity and is one of the crucial factors contributing to insulin deficiency and insulin resistance[36].Meanwhile,Peroxisome proliferator-activated receptor-γ (PPAR-γ)promotes fatty acid metabolism,enhances insulin sensitivity,and regulates glucolipid metabolism[37].Abnormal lipid metabolism and insulin resistance in HFD-induced diabetic mice can be alleviated by reducing PPAR-γ expression and activity[38].Our findings suggested that TGP had a significant hypoglycemic effect in HFD/STZ-induced diabetic mice.The hypoglycemic property of TGP may be related to the regulation of glucolipid metabolism and oxidative stress through activation of the PI3K/Akt signaling pathway to improve insulin resistance.
Remarkably,the results indicated that the improvement of complications due to metabolic disorders and hyperglycemia with TGP showed a dose-dependent relationship,especially on blood glucose.The outcomes of Zhao et al.[39]are consistent with ours and depicted a dose-dependent hypoglycemic effect ofCrassostrea gigaspolysaccharides.However,some inconsistencies are there in some studies.The crude polysaccharides from Abalone Viscera could improve glucose tolerance and insulin resistance but did not show a dose-dependent effect[40].These inconsistent dose results could be related to the type and source of shellfish and the structural composition of shellfish polysaccharides.The fucose and sulfate groups in TGP could be a key active substance in the antidiabetic effect and can regulate signaling pathways and insulin resistance to reduce blood glucose levels[10].Therefore,high doses of TGP are more efficient in improving insulin resistance.
Increasing evidence shows that gut microbiota plays a role in the development and occurrence of diabetes[41].Abnormal intestinal metabolites and disruption of the intestinal barrier due to dysbiosis of the intestinal microbiota in T2DM patients promote the entry of intestinal bacteria and their harmful metabolites within the circulatory system.The abnormal entry could damage multiple organs by affecting insulin sensitivity and glucose metabolism[42].The F/B ratio is significantly decreased in the T2DM group compared with the normal group[41].This study showed an increase in the F/B ratio and alpha diversity in TGP-treated diabetic mice (Fig.7).During the process,the abundance ofAllobaculum,Lachnospiraceae_NK4A136_group,Akkermansia,Dubosiella,andBifidobacteriumincreased significantly,while that of norank_f_Lachnospiraceae andDesulfovibriodecreased (Fig.8).Allobaculumhas been identified as the bacterial genus associated with butyric acid levels in the body.It alleviates diabetes and obesity by reducing the migration of endotoxins into the bloodstream[43].Studies have demonstrated thatAkkermansiasignificantly inhibits the development of obesity and its complications and is effective in treating T2DM[44].Moreover,Bifidobacteriumis a beneficial bacterium that produces several glycosidases,which hydrolyze high-molecular-weight carbohydrates to acetate and lactate and regulate the intestinal environment[45].Lachnospiraceae_NK4A136_group belongs to the Firmicutes phylum,which regulates host health through butyric acid production.Compared with group C[46],the abundance of the Lachnospiraceae_NK4A136_group in diabetic mice decreased significantly and increased after TGP treatment.However,the relative abundance ofDesulfovibrioand norank_f_Lachnospiraceae were higher in diabetic mice than in mice in the C,B,and NH groups.Previous studies have demonstrated that persistent hyperglycemia leads to a significant increase in the abundance of norank_f_Lachnospiraceae[21].Meanwhile,the metabolite lipopolysaccharide synthesized byDesulfovibrioof the Proteobacteria phylum is a potential causative factor for inflammatory diseases of the gastrointestinal tract[47].It could be speculated that Met and TGP improve insulin resistance and reduce FBG levels in diabetic mice by reducing the relative abundance of norank_f_Lachnospiraceae andDesulfovibrio.Interestingly,the genus Prevotellaceae-NK3B31-group was not detected in the feces of diabetic mice and was significantly elevated in the NH group,consistent with the results that theabrownin improved the gut microbiology of high-sugar diet-induced obese mice[48].The bacteria that differ significantly between the TGP and diabetes groups may alleviate diabetes through several pathways and mechanisms,and the associated metabolites of these gut flora may be one of the ways to explore their role in treating diabetes.These findings indicated that TGP could modulate the microbial composition in the intestinal tracts of diabetic mice and promote the multiplication of beneficial bacteria that produce SCFAs to regulate lipid metabolism disorders and reduce insulin resistance and inflammation.
5.Conclusions
TGP was extracted and purified fromT.granosaand includes mannose,glucosamine,rhamnose,glucuronic acid,galactosamine,glucose,galactose,xylose,and fucose,having a molecular weight of 5.1 × 10³Da.In vivostudies indicated that TGP significantly decreased blood glucose levels,improved dyslipidemia,and prevented weight loss in mice with HFD/STZ-induced T2DM.TGP may regulate glycogen synthesis and gluconeogenic enzyme activity,improve disorders in glucolipid metabolism,reduce oxidative stress and liver damage,and enhance insulin sensitivity by activating the PI3K/Akt signaling pathway.Furthermore,the relative abundance of SCFAproducing bacteria such asAllobaculum,Lachnospiraceae_NK4A136_group,Akkermansia,andBifidobacteriumin the intestines of diabetic mice was gradually restored after TGP intervention.The abundance ofVerrucomicrobiotaandProteobacteriaincreased significantly,whereas that ofBacteroidesdecreased.Overall,our findings suggest that the polysaccharides fromT.granosacould considerably alleviate the presentation and symptoms of T2DM,thereby highlighting its potential for developing an effective antidiabetic nutraceutical.
Conflict of interests
The authors declare that there is no conflict of interests.
Acknowledgments
This research was funded by the National Key Research and Development Program of China (2020YFD0900902),Zhejiang Province Public Welfare Technology Application Research Project(LGJ21C20001),and Zhejiang Provincial Key Research and Development Project of China (2019C02076 and 2019C02075).
Ethics statement
The experiment was received approval by ethics committee of Zhejiang University of Technology,with the approval number 20201222153.
Appendix A.Supplementary data
Supplementary data associated with this article can be found,in the online version,at http://doi.org/10.26599/FSHW.2022.9250072.
- 食品科学与人类健康(英文)的其它文章
- Protective effects of oleic acid and polyphenols in extra virgin olive oil on cardiovascular diseases
- Diet and physical activity inf luence the composition of gut microbiota,benef it on Alzheimer’s disease
- Inf luence of nitrogen status on fermentation performances ofnon-Saccharomyces yeasts: a review
- Ganoderma lucidum: a comprehensive review of phytochemistry,eff icacy,safety and clinical study
- Resveratrol combats chronic diseases through enhancing mitochondrial quality
- Demonstration of safety characteristics and effects on gut microbiota of Lactobacillus gasseri HMV18