
Sodium butyrate alleviates fructose-induced non-alcoholic fatty liver disease by remodeling gut microbiota to promote γ-amino butyric acid production
2024-02-15 07:59QuChenLeiWuAijiZhngChenWuLiupingCiYingpingXioYingdongNi
食品科学与人类健康(英文) 2024年2期
Qu Chen,Lei Wu,Aiji Zhng,Chen Wu,Liuping Ci,Yingping Xio,Yingdong Ni,
a Key Laboratory of Animal Physiology and Biochemistry, Ministry of Agriculture and Rural Affairs, Nanjing Agricultural University, Nanjing 210095, China
b State Key Laboratory for Managing Biotic and Chemical Threats to the Quality and Safety of Agro-products, Institute of Agro-product Safety and Nutrition,Zhejiang Academy of Agricultural Sciences, Hangzhou 310022, China
Keywords: Butyrate Fructose Gut microbiota Hepatic steatosis
ABSTRACT Sodium butyrate (NaB) can regulate lipid metabolism and inhibit hepatic steatosis.This study aimed to investigate whether NaB can alleviate fructose-induced hepat ic steatosis via remodeling the gut microbiota and evaluate the anti-fatty liver mechanisms.The results showed that NaB and NaB-remodeled gut microbiota signif icantly alleviated fructose-induced hepatic steatosis and increased plasma uric acid and fructose levels.Furthermore,both NaB and NaB-remodeled gut microbiota increased the abundance of Lactobacillus and altered the levels of plasma amino acids (upregulating gamma-amino butyric acid (GABA) and downregulating L-glutamic acid and L-arginine) in fructose-exposed mice.The correlation analysis showed that GABA levels positively correlated with Lactobacillus abundance,and increased GABA levels might promote the reduction of the hepatic triglyceride content.Further studies conf irmed that GABA signif icantly reduced lipid deposition in mouse hepatocytes induced via fructose pretreatment in vitro.These f indings suggested that NaB could ameliorate fructose-induced hepatic steatosis by regulating gut microbiota.
1.Introduction
Non-alcoholic fatty liver disease (NAFLD) is a common hepatic manifestation ofmetabolic syndrome.NAFLD is widely prevalent in developed countries,and is becoming increasingly more common in developing countries[1].The steady rise in the consumption of dietary fructose derived from sucrose and high-fructose corn syrup constitutes a signif icant but underappreciated dietary change that has tremendous implications for the development of metabolic syndrome,leading to NAFLD[2].
Butyrate,one of the most common short-chain fatty acids,is mainly derived from the fermentation of cellulose and resistant starch by specific gut microbiota[3].Numerous studies have demonstrated that gut microbiota has diverse benef icial effects on mammals health via regulating hormones secretion[4],inflammatory response[5]and intestinal homeostasis[6].Many studies have reported that sodium butyrate (NaB) may help alleviate hepatic steatosis[7-9].Zhou et al.reported that dietary supplementation of NaB could decrease fat absorption and hepatic lipid deposition,which is related to improving gut microbiota composition[10].
It is well known that the gut liver axis is anatomically linked through the hepatic portal system.Thousands of bacterial species host in the gut participating in host immunity,nutrient metabolism,and energy harvesting process[11].Interesting evidence has shown that gut microbiota play an important role in the development and progression of NAFLD,but the underlying mechanisms remain largely unclear[12-14].Although some studies have suggested that NaB may reduce hepatic lipid deposition by regulating gut microbiota[10,15],many contradictory results also illustrate the complexity of butyrate in the interplay between gut microbiota and host lipid metabolism[16].Therefore,verifying the role of NaB-remodeled microbiota in NAFLD and clarifying the specific metabolites acting as a critical link between butyrate and gut microbiota are necessary.
In this study,an NAFLD model was developed in mice via the consumption of drinking water supplemented with fructose,after which NaB was administered to the mice for evaluating the effects of NaB on hepatic lipid metabolism and gut microbiota composition.We performed fecal microbiota transplantation (FMT) for the first time to determine whether NaB-remodeled gut microbiota could independently alleviate fructose-induced NAFLD.Moreover,microbiome metabolome analysis was used to examine the specific bacterial metabolites involved in the underlying mechanism of the dietary NaB in alleviating NAFLD.
2.Materials and methods
2.1 Mice
Six-week-old specific-pathogen-free male C57BL/6 mice were purchased from Yangzhou University (Yangzhou,China).All mice were housed in steel microisolator cages (4 mice per cage) at (22 ± 2) °C with a 12/12-h light/dark cycle.Mice had free access to water and food throughout the experiment.The diet composition is presented in Table S1.The body weight,food and water intake of the mice were recorded weekly.Animals were access to tap water in the control group or 30% fructose (BioReagent,Sigma,MO,USA) in drinking water as the fructose group for 8 weeksad libitum.Then,mice in the control group were treated daily with saline (C),while mice in the fructose group were treated daily with either saline (F) or 200 mg/kg NaB (B) (≥ 98.5%,Sigma,MO,USA) for 6 weeks through intragastric gavage.NaB gavage dosage was determined on the basis of a previous study[9].At the time indicated,8 mice per group were anaesthetised after 12 h fasting.After collecting whole blood through portal vein,all mice were sacrificed.Tissue samples were immersed in liquid nitrogen and stored at -80 °C for further analysis.The remaining mice were used as fecal microbiota donors for FMT experiment.The changes of food intake,fructose water intake and calorie intake of mice are shown in Fig.S1.
2.2 Fecal microbiota transplantation (FMT).
FMT was performed referring to an established protocol[17].Briefly,stools from donor mice were collected daily for the subsequent 6 weeks under a laminar flow hood in sterile conditions.Stools from donor mice of each diet group were pooled and 400 mg was resuspended in 1 mL of sterile saline.The solution was vigorously mixed for 30 s before centrifugation at 800 ×gfor 3 min.The supernatant was collected and used as transplant material (FM group inoculated material was inactivated by heat).The supernatant was collected and administered by oral gavage immediately to minimize changes in microbial contents.Recipient mice were gavaged daily with fresh transplant material (200 μL for each mouse) for 6 weeks,before being sacrificed for subsequent analysis.
2.3 Oral glucose tolerance test (OGTT), plasma and liver parameters detection
OGTT was performed 3 days before mice sacrificed.All mice were fasted for 12 h before measuring fasting blood glucose levels.Blood glucose levels were measured from the tail vein at 0 min.Then 2.0 g/kg body weight ofD-glucose (≥ 99.5%,SCR,Shanghai,China)by intragastric administration for oral glucose tolerance test.Blood samples were collected at regular intervals (15,30,60,and 120 min) after gavage,and glucose meter was employed to test glucose levels.The data of the OGTT was visualized by the area under the curve (AUC).
Plasma glucose,triglyceride (TG),total cholesterol (TC),and uric acid were measured using 7020 automatic biochemical analyzer(HITACHI,Tokyo,Japan).Plasma fructose (BioAssay Systems,CA,USA),plasma insulin (North institute of biotechnology,Beijing,China),and hepatic TG (Applygen,Beijing,China) were measured using commercial assay kits,strictly following the instructions of the manufacturers.
2.4 Staining for histopathology
The liver and intestinal tissues were cut and fixed with 4%paraformaldehyde and were embedded in paraffin.Sections were stained with hematoxylin-eosin (H&E) or Oil Red O to investigate architecture.AML12 hepatocytes were stained with Oil Red O using a commercial kit dedicated to the cells (Solarbio,Beijing,China).Stained slides were scanned with the Pannoramic SCAN II,and images were captured with 3DHISTECH software (3DHISTECH,Ltd.,Budapest,Hungary).
2.5 RNA isolation, cDNA synthesis and real-time PCR
Total RNA was extracted from liver samples with TRIzol reagent(Tsingke,Beijing,China).The concentration and quality of the RNA were measured with a NanoDropND-1000 Spectrophotometer(Thermo Fisher Scientific,WI,USA).Then 1 μg of total RNA was treated with ABScript III RT Master Mix (ABclonal,Wuhan,China) according to manufacturer’s instructions.Quantitative real-time PCR was performed using 1 μL first-strand cDNA with the Genious 2X®SYBR Green Fast qPCR Mix (ABclonal,Wuhan,China) in a final volume of 10 μL.All samples were run in triplicate and underwent 45 amplification cycles in an Mx3000P (Stratagene,CA,USA).Peptidylprolyl isomerase A (PPIA),which is not affected by the experimental factors,was chosen as the reference gene.All the primers were listed in Table S2,were synthesized by Tsingke Company (Nanjing,China).The method of 2-ΔΔCTwas used to analyze the real-time PCR results,and gene mRNA levels were expressed as the fold change relative to the mean value of the control group.
2.6 Western blotting analysis
Proteins were harvested from cells,liver and intestinal tissues with 1 mL of ice-cold RIPA buffer (ABclonal,Wuhan,China) containing the protease inhibitor cocktail complete EDTA-free (Roche,Basel,Switzerland).The homogenates were centrifuged at 12 000 ×gfor 20 min at 4 °C and then the supernatant fraction was collected.The protein concentration was determined using a BCA Protein Assay kit(Thermo,MA,USA).80 mg of protein extract from each sample was then loaded into 10% SDS-PAGE gels,and the separated proteins were transferred onto nitrocellulose membranes (Pall Corp.,NY,USA).After transfer,membranes were blocked for 2 h at room temperature in blocking buffer and then incubated with the following primary antibodies: rabbit-anti-peroxisome proliferator activated receptor α (PPARα) (Proteintech,Wuhan,China),rabbit-anti-carnitine palmitoyltransferase α (CPT1α) (Proteintech,Wuhan,China),Actin beta (ACTB)-HRP (ABclonal,Wuhan,China) in dilution buffer overnight at 4 °C.After several washes in Tris-buffered-saline with Tween,membranes were incubated with goat anti-rabbit secondary antibodies (Bioworld,Nanjing,China) in dilution buffer for 2 h at room temperature.Protein bands detected by ECL enhanced kit (ABclonal,Wuhan,China) and the signals were recorded by chemiluminescence gel imaging system (Tanon,Shanghai,China).Protein bands were analyzed by Image J software (National Institutes of Health,Md,USA).ACTB was chosen as the reference protein due to the stable expression level in all samples.Finally,the relative abundance of proteins expression in liver was expressed as the fold change relative to the mean value of the control group.
2.7 Analysis of 16S rRNA sequencing and metabolomics
Caecal microbial samples collected from donors and recipients were immediately frozen in liquid nitrogen.Total genome DNA from samples was extracted using CTAB/SDS method.DNA concentration and purity was monitored on 1% agarose gels.According to the concentration,DNA was diluted to 1 ng/µL using sterile water.16S rRNA genes of distinct regions V3 and V4 were amplified used specific primer pairs pairs (338F/806R).The library was sequenced on an Illumina NovaSeq platform (Illumina,CA,USA) and 250 bp paired-end reads were generated.Paired-end reads were merged using FLASH (V1.2.7).Quality filtering on the raw tags were performed under specific filtering conditions to obtain the high-quality clean tags according to the QIIME (V1.9.1).The tags were compared with the reference database using UCHIME algorithm.All the data were on the basis of sequenced reads and operationa taxonomic units (OTUs).The effective tags were clustered into OTUs with 97% similarity cutoff by the UPARSE pipeline.Species classification was performed on the representative sequences using SILVA database (https://www.arb-silva.de/).The non-metric multidimensional scaling (NMDS) and similarity percentage (SIMPER) analysis were analyzed and plotted using R project.The microbiome data were analyzed by Kruskal-Wallis with a Turkey-Kramer post hoc test.Suzhou Bionovogene provided the service for 16s rRNA sequencing.
2.8 Untargeted metabolic profiling of plasma
Untargeted metabolic profiling was performed by liquid chromatography-mass spectrometry (LC-MS).Plasma samples were collected from the hepatic portal vein.Sample pre-processing referred to previous studies[18-19].Chromatographic separation was accomplished in an Thermo Ultimate 3000 system equipped with an ACQUITY UPLC®HSS T3 (150 mm × 2.1 mm,1.8 µm,Waters)column maintained at 40 °C.The temperature of the autosampler was 8 °C.The ESI-MSn experiments were executed on the Thermo Q Exactive mass spectrometer with the spray voltage of 3.8 and -2.5 kV in positive and negative modes,respectively.The experimental process was carried out according to the previous studies[20-21].The metabolomics data were normalized using unit variance scaling (UV)method.Different metabolites were screened combining through variable importance in the projection (VIP) andP-value (VIP ≥ 1,P-value ≤ 0.05).The different metabolites were uploaded to MetaboAnalyst (https://www.metaboanalyst.ca/) to identify perturbed pathways according to the KEGG pathway database (https://www.genome.jp/kegg/).Suzhou Bionovogene provided the service for LC-MS measurement.
2.9 Cell culture in vitro
The AML12 cells (mouse normal hepatocyte) were grown in DMEM/F-12 medium (Gibco,NY,USA) containing ITS Liquid Media Supplement (R&D Systems,MND,USA),10% (V/V) fetal bovine serum (Auxgenex,Brisbane,Australia),100 U/mL penicillin,and 100 µg/mL streptomycin (Sigma,MO,USA) for 3 days at 37 °C with 5% CO2.AML12 cells were pretreated with fructose (≥ 99%,Sigma,MO,USA) for 12 h,followed gamma-amino butyric acid(GABA) (≥ 99%,Sigma,MO,USA) for 12 h.Cell Counting Kit-8(CCK-8) (Cellcook,Guangzhou,China) was used to determine the effects of fructose and GABA on cell viability at different doses,strictly following the manufacturer’s instructions.
2.10 Statistical analysis
The data are presented as means ± SEM,and analyzed using one-way ANOVA followed by Bonferroni post hoc test (SPSS version 20.0 for Windows).The Spearman correlation coefficient of the plasma metabolites,hepatic TG content and the gut microbiota were evaluated using the R package.P-values < 0.05 were considered to be statistically significant.
3.Results
3.1 Effects of NaB on fructose-induced NAFLD mice
Staining of the liver tissue of the fructose-exposed mice with Oil Red O showed obvious lipid droplet deposition in the liver,more than half the hepatocytes demonstrated macrovesicular steatosis (Fig.S2A).Compared to the control group,the frucotse group of mice exposed to water containing 30% fructose for 8 weeks had significantly higher hepatic TG and plasma glucose levels,indicating mouse NAFLD model was established successfully (Fig.S2B).Following the 8 weeks,the control group mice were treated with saline(C group),while the fructose group mice were treated with either saline (F group) or NaB (B group) by oral gavage daily for a period of 6 weeks.The exposure of the mice to fructose noticeably induced macrosteatosis,hepatocyte ballooning,and lipid deposition in the livers,as indicated by the H&E and Oil Red O staining of the hepatic tissue,while NaB administration dramatically reversed these changes (Fig.1A).In liver,fructose-induced increase of the TG concentrations was significantly alleviated by NaB treatment(Fig.1B).Compared to the C group,real-time qPCR analysis indicated that genes involved in fatty acid synthesis and transport were significantly upregulated in the F and B groups;however,after exposure of the mice to NaB,there was a significant increase in the expression ofβ-oxidation-related genes (PPARαandCPT1α) relative to the F group (Fig.1C).At the protein level,the change in the hepatic concentration of CPT1α was consistent with that at the gene transcription level (Fig.1D).Throughout the experiments,there were no obvious changes in body weight of the mice (Fig.1E).Compared to the F group,oral glucose tolerance tests (OGTTs) demonstrated that NaB improved the glucose tolerance in the B group (Fig.1F).In addition,NaB treatment significantly reduced plasma glucose,uric acid and fructose levels,as well as mildly reduced plasma TC levels compared to the F group (Figs.1G,H,J,K).On the other hand,there were no obvious differences in the levels of TG and insulin between each of the groups (Figs.1I,L).
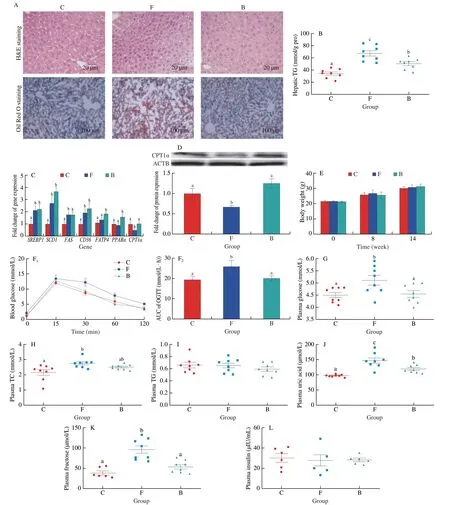
Fig.1 Effect of NaB on fructose-induced hepatic steatosis and metabolic disorders.(A) Representative images of H&E and Oil Red O staining of the liver.(B) Hepatic TG content.(C) The mRNA expression of SREBP1,SCD1,FAS,CD36,FATP4,PPARα and CPT1α.(D) The protein expression of CPT1α in liver tissues,ACTB was used as a loading control.(E) Body weight.(F) Time-dependent profiles of blood glucose levels in OGTT.(G-L) Plasma glucose,TC,TG,uric acid,fructose and insulin levels.Data are presented as the mean ± SEM.Data with different letters are significantly different (P < 0.05).
3.2 FMT from the NaB-treated donor mice alleviated hepatic steatosis and metabolic disorders in the recipient fructoseexposed mice
In order to investigate whether NaB inhibited fructose-induced fatty liver through gut microbiota,we performed FMT experiment for further study (Fig.2A).H&E and Oil Red O staining of liver sections indicated that macrosteatosis,hepatocyte ballooning,and lipid deposition were significantly more prominent in the FF (fructoseexposed mice received FMT from F donor mice) and FM (fructoseexposed mice received heat-killed FMT from B donor mice) groups compared to the CC (control mice received FMT from C donor mice),FC (fructose-exposed mice received FMT from C donor mice) and FB(fructose-exposed mice received FMT from B donor mice) groups;FMT from the C and B donor mice alleviated hepatic steatosis in FC and FB groups (Fig.2B).Heptic TG levels were signficantly lower in the FC and FB groups compared to the FF and FM groups (Fig.2C).Similar to the donor mice,the body weights of the recipient mice were not significantly affected by the FMT (Fig.2D).Compared to the other groups,the expression of PPARα and CPT1α at the gene and protein level was significantly higher in the FB group,which was consistent with the corresponding expression levels in the donor mice(Figs.2E,F).The result of OGTT test demonstrated that compared to CC group,glucose telorance significantly decreased in FC,FF and FM groups,and mildly decreased in FB group (Fig.2G).Compared to the FF and FM groups,plasma levels of TC,uric acid,and fructose were significantly lower in the FC and FB groups (Figs.2I,K,L),while the glucose levels mildly decreased in the FC and FB groups after FMT (Fig.2H).There were no obvious changes in the plasma insulin and TG levels between all groups (Figs.2J,M).Thses data suggest that NaB-remodeled microbiota can improve hepatic steatosis and lower plasma fructose and uric acid in fructose-exposed mice.
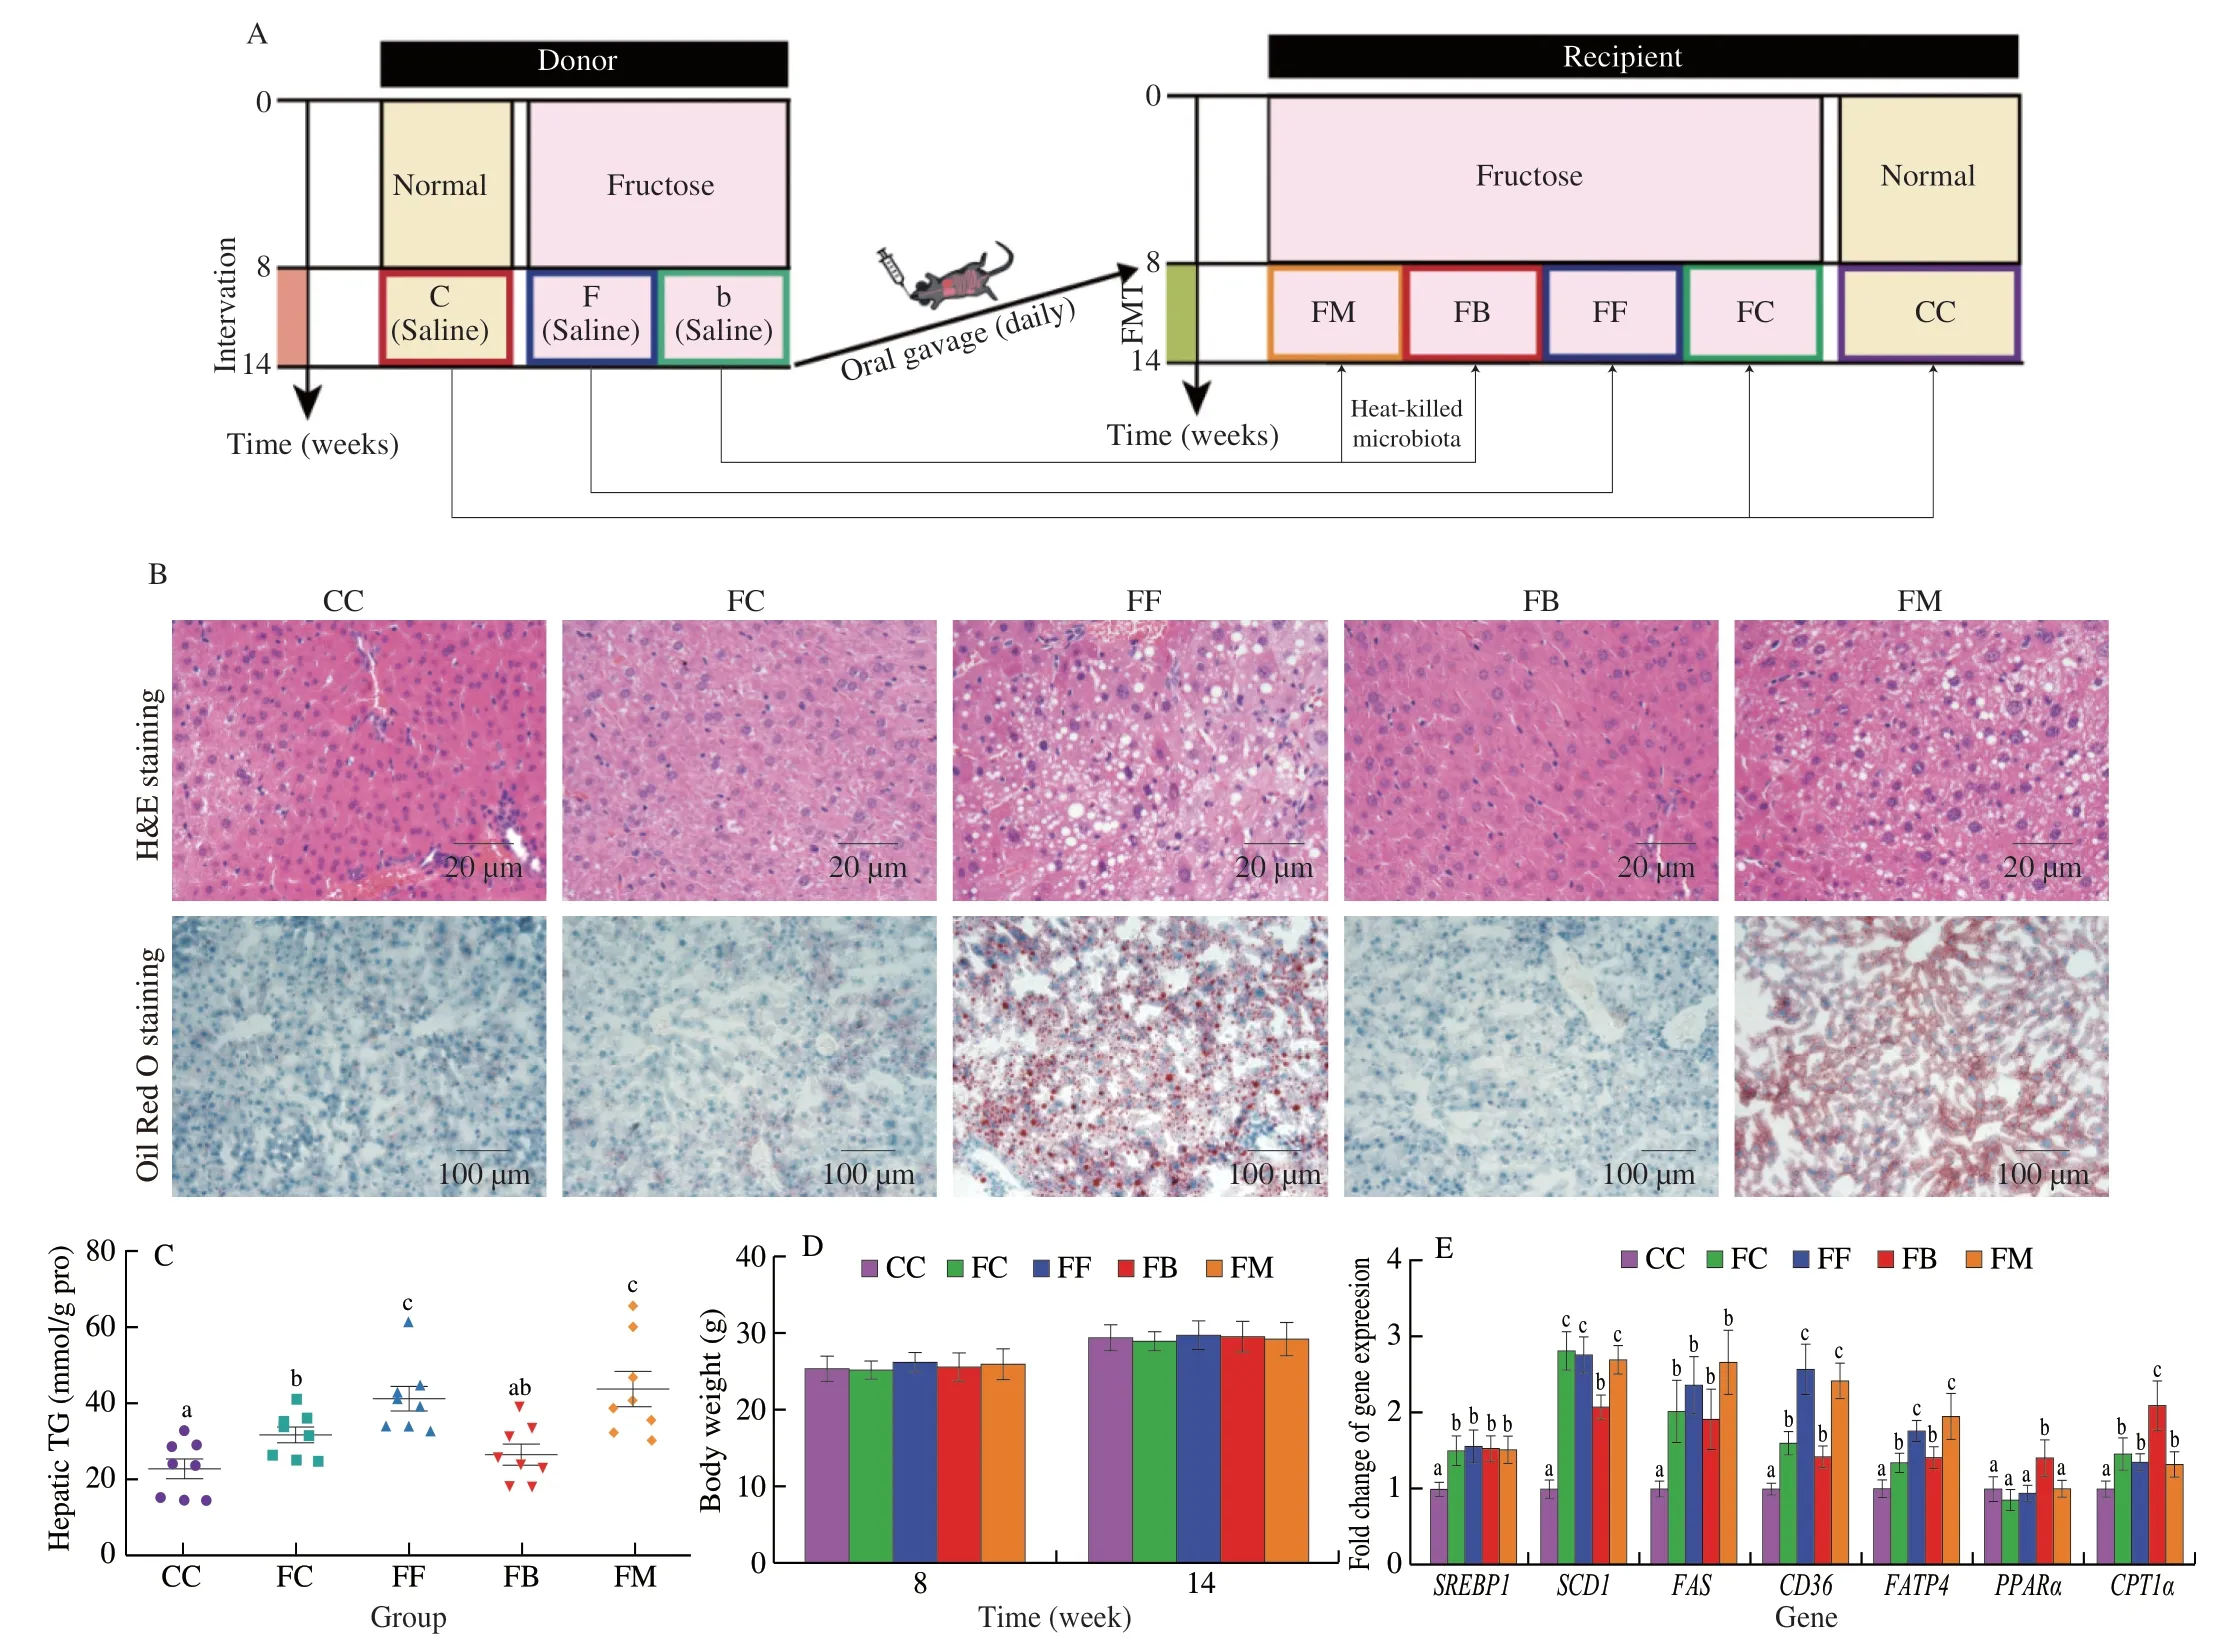
Fig.2 Effect of FMT on fructose-induced hepatic steatosis and metabolic disorders.(A) Diagram of experimental process.(B) Representative images of H&E and Oil Red O staining of the liver.(C) Hepatic TG content.(D) Body weight.(E) The mRNA expression of SREBP1,SCD1,FAS,CD36,FATP4, PPARα and CPT1α.(F)The protein expression of CPT1α in liver tissues.ACTB was used as a loading control.(G) Time-dependent profiles of blood glucose levels in OGTT.(H-M) Plasma glucose,TC,TG,uric acid,fructose and insulin levels.Data are presented as the mean ± SEM.Data with different letters are significantly different (P < 0.05).
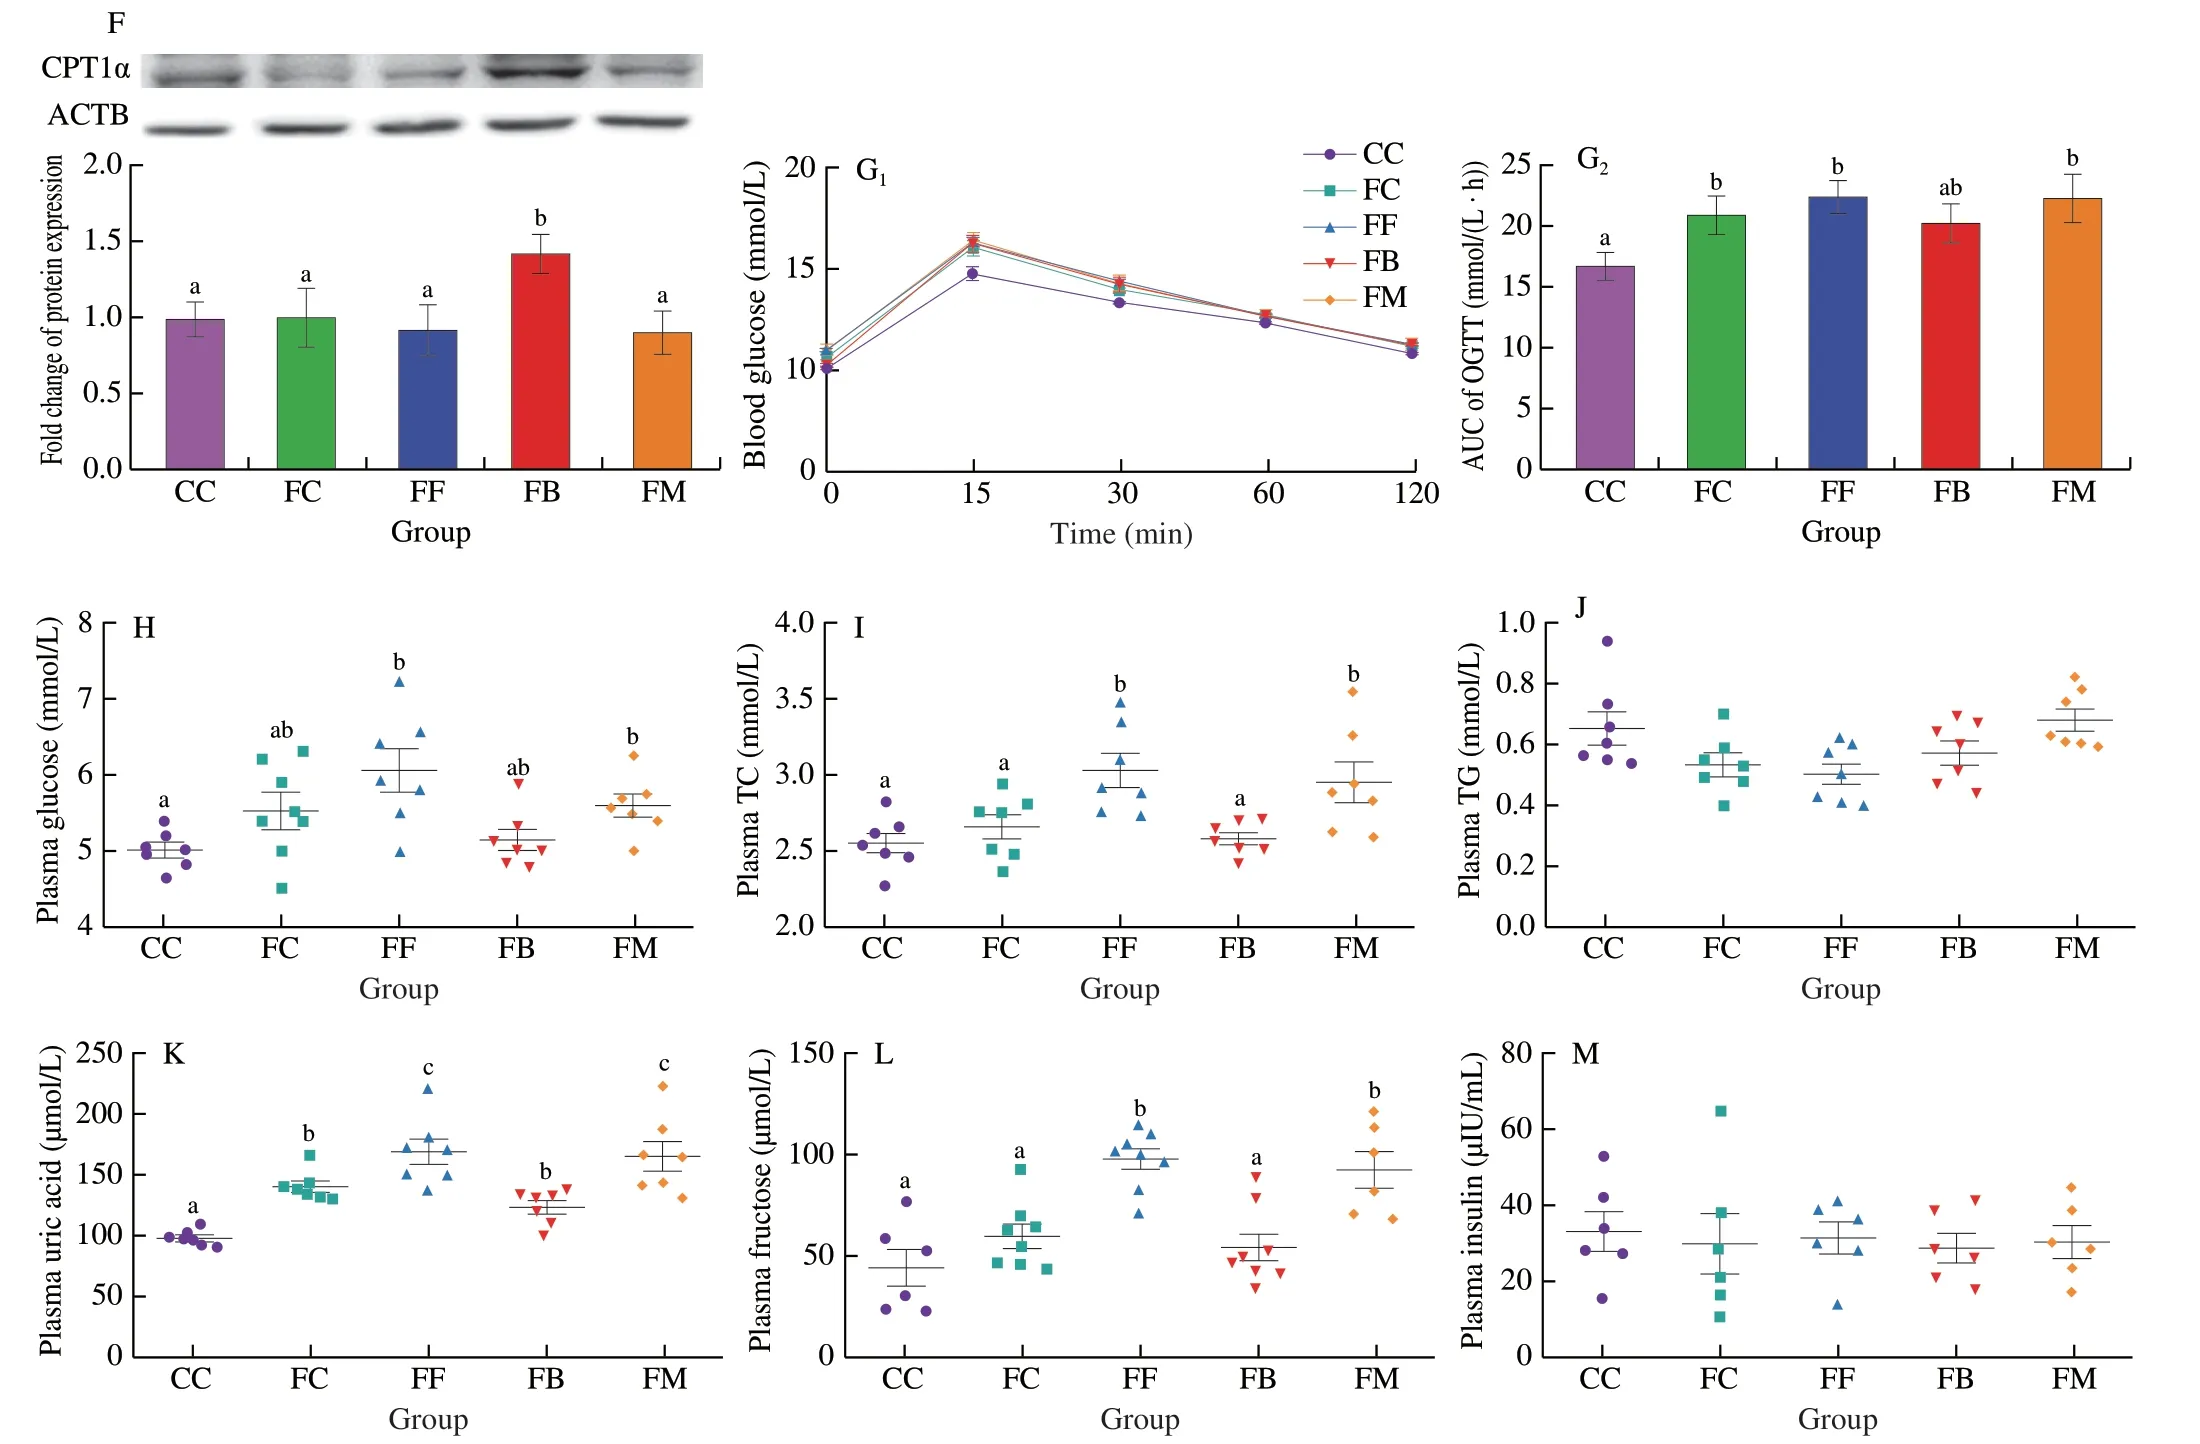
Fig.2 (Continued)
3.3 Alterations of cecal microbiota in FMT donor and recipient mice
The representive microbiota at the genus level in donor mice are shown in Fig.3A.Compared to the C and F groups,NaB increased the abundance ofRoseburia,while reversing the reduction inLactobacillus,Desulfovibrio,andBifidobacteriuminduced by fructose.SIMPER analysis showed that the main contribution to the variation of intestinal bacterial genera between F and B groups is attributed toLactobacillus,Parasutterella,Akkermansia,DubosiellaandAlloprevotella(Fig.3B).The representative bacterial genera in the CC,FF and FB groups are shown in Fig.3C.We found that FMT from NaB-treated donor mice increased the abundance ofParabacteroides,RoseburiaandParasutterella,while reversing the reduction inLactobacillusinduced by fructose.SIMPER analysis showed that the main contribution to the variation of intestinal bacterial genera between FF and FB groups is attributed toIleibacterium,Lactobacillus,Dubosiella,AkkermansiaandHelicobacter(Fig.3D).These findings imply that the increased abundance ofLactobacillusis an important reason for NaB to improve gut microbiome in fructose-exposed mice.
3.4 Alterations of metabolites in portal vein plasma of FMT donor and recipient mice
The hepatic portal vein is a vital channel that connects the gut to the liver.An untargeted metabolomics approach was used to investigate the changes in plasma metabolomics after treatment of the fructose-exposed mice with NaB,the results of which were used to generate a heatmap of the different metabolites analyzed.Between the F and B groups,many of the differential metabolites identified were involved in amino acids metabolism (e.g.L-glutamic acid,L-arginine,L-serine,L-cystine,andN-acetyglutamic acid) (Fig.4A).Pathway impact analysis by mapping all the diferential annotated metabolites into biochemical pathways showed that the most perturbed metabolic pathways were related to amino acid metabolism,including “arginine and proline metabolism”,“glutamine and glutamate metabolism”,“valine,leucine and isoleucine biosynthesis”,“phenylalanine metabolism”,and “alanine,aspartate and glutamate metabolism”(Fig.4B).The heatmap revealed 24 differential metabolites between FF and FB groups (Fig.4C).We noted thatL-arginine,L-glutamic acid,and uric acid were markedly decreased while GABA was increased in FB group,which was in accordance with the changes in F and B groups (Fig.4E).Pathway impact analysis showed that the pathways related to “phenylalanine metabolism”,“phenylalanine,tyrosine and tryptophan biosynthesis”,“alanine,aspartate and glutamate metabolism”,and “arginine and proline metabolism” were also perturbed by FMT treatment (Fig.4D).
3.5 Correlation analysis of gut microbiota, plasma metabolites and hepatic TG

Fig.3 Effect of NaB and FMT on the gut microbiota.(A) Box-and-whisker plots of the bacteria at genus level in donor mice.(B) SIMPER analysis of the bacteria at genus level in donor mice.(C) Box-and-whisker plots of the bacteria at genus level in recipient mice.(D) SIMPER analysis of the bacteria at genus level in recipient mice.*Significant different (P < 0.05);**extremely significant different (P < 0.01).The same below.

Fig.4 Effect of NaB and FMT on the metabolites in portal vein plasma.(A) Heatmap of the differential metabolites between F and B groups (VIP ≥ 1,P value ≤ 0.05).(B) Pathway impact resulting from the differential metabolites between F and B groups using MetaboAnalyst.(C) Heatmap of the differential metabolites between FF and FB groups (VIP ≥ 1, P-value ≤ 0.05).(D) Pathway impact resulting from the differential metabolites between FF and FB groups using MetaboAnalyst.(E) Fold change of L-arginine (E1),L-glutamic acid (E2),uric acid (E3) and GABA (E4) in donor and recipient mice.*P < 0.05,**P < 0.01.

Fig.4 (Continued)

Fig.5 Correlation analysis of gut microbiota,plasma metabolites and hepatic TG content.(A) Spearman correlation analysis of plasma metabolites.Positive correlations are shown in red and negative correlations in blue.Color intensity and the size of the dots are proportional to the correlation values (P < 0.05).(B) Spearman correlation analysis between microbial genera and plasma metabolite.Positive correlations are shown in red and negative correlations in blue(*P < 0.05,**P < 0.01).(C) Spearman correlation analysis of hepatic TG,plasma metabolites and Lactobacillus abundance.
Spearman correlation analysis of the identified different metabolites in the FF and FB groups showed that the levels of GABA negatively correlated withL-glutamic acid andL-arginine(Fig.5A).Spearman correlation analysis was conducted to investigate the relationship between the microbial genera and portal plasma metabolites,from which a heatmap was generated.The abundance ofLactobacillusexhibited a positive correlation with GABA levels and a negative correlation withL-glutamic acid and uric acid levels(Fig.5B).Furthermore,hepatic TG content positively correlated with plasma fructose and uric acid levels,and negatively correlated withLactobacillusand GABA levels (Fig.5C).These results indicate that the abundance ofLactobacillusis closely related to the levels of plasma amino acids,and the increase of GABA levels caused by the increased abundance ofLactobacillusmay promote the reduction of hepatic TG content in fructose-exposed mice.
3.6 Effects of GABA on TG metabolism of hepatocytes in vitro
To investigate whether GABA can inhibit lipid deposition in hepatocytes,in vitro,acellular hepatic steatosis model was developed using the AML12 mouse hepatocyte cell line.The culture medium containing the AML12 cells was supplemented with fructose at concentrations of 5,10,25,and 50 mmol/L,the addition of fructose did not affect cell viability after incubation of the cells for 12 and 24 h (Fig.6A).Incubation of the cells with GABA at concentrations of 62.5,125,and 250 μmol/L did not affect cell viability (Fig.6B).Supplementation of fructose to the cells at concentrations of 5,10,and 25 mmol/L for 12 h led to significant increases in the concentration of TG in the cells (Fig.6C).Because of the effects on increasing TG levels without afftcting cell viability,10 mmol/L fructose was selected as the treatment concentration for further experiments.After pretreatment of the cells with fructose (10 mmol/L) for 12 h,incubation of the cells with GABA (62.5,125,and 250 μmol/L)significantly alleviated the increased TG levels induced by fructose(Fig.6D).These results were confirmed by Oil Red O staining,which showed that 125 μmol/L GABA significantly reduced lipid droplets accumulation in the AML12 cells (Fig.6E).The gene and protein expression profiles of the AML12 cells showed that 10 mmol/L fructose treatment significantly reduced the expression of CPT1α and PPARα relative to the control,supplementation of the fructoseexposed cells with 125 μmol/L GABA led to significant increases in the expression of CPT1α and PPARα relative to the fructose-exposed cells (Figs.6F,G).
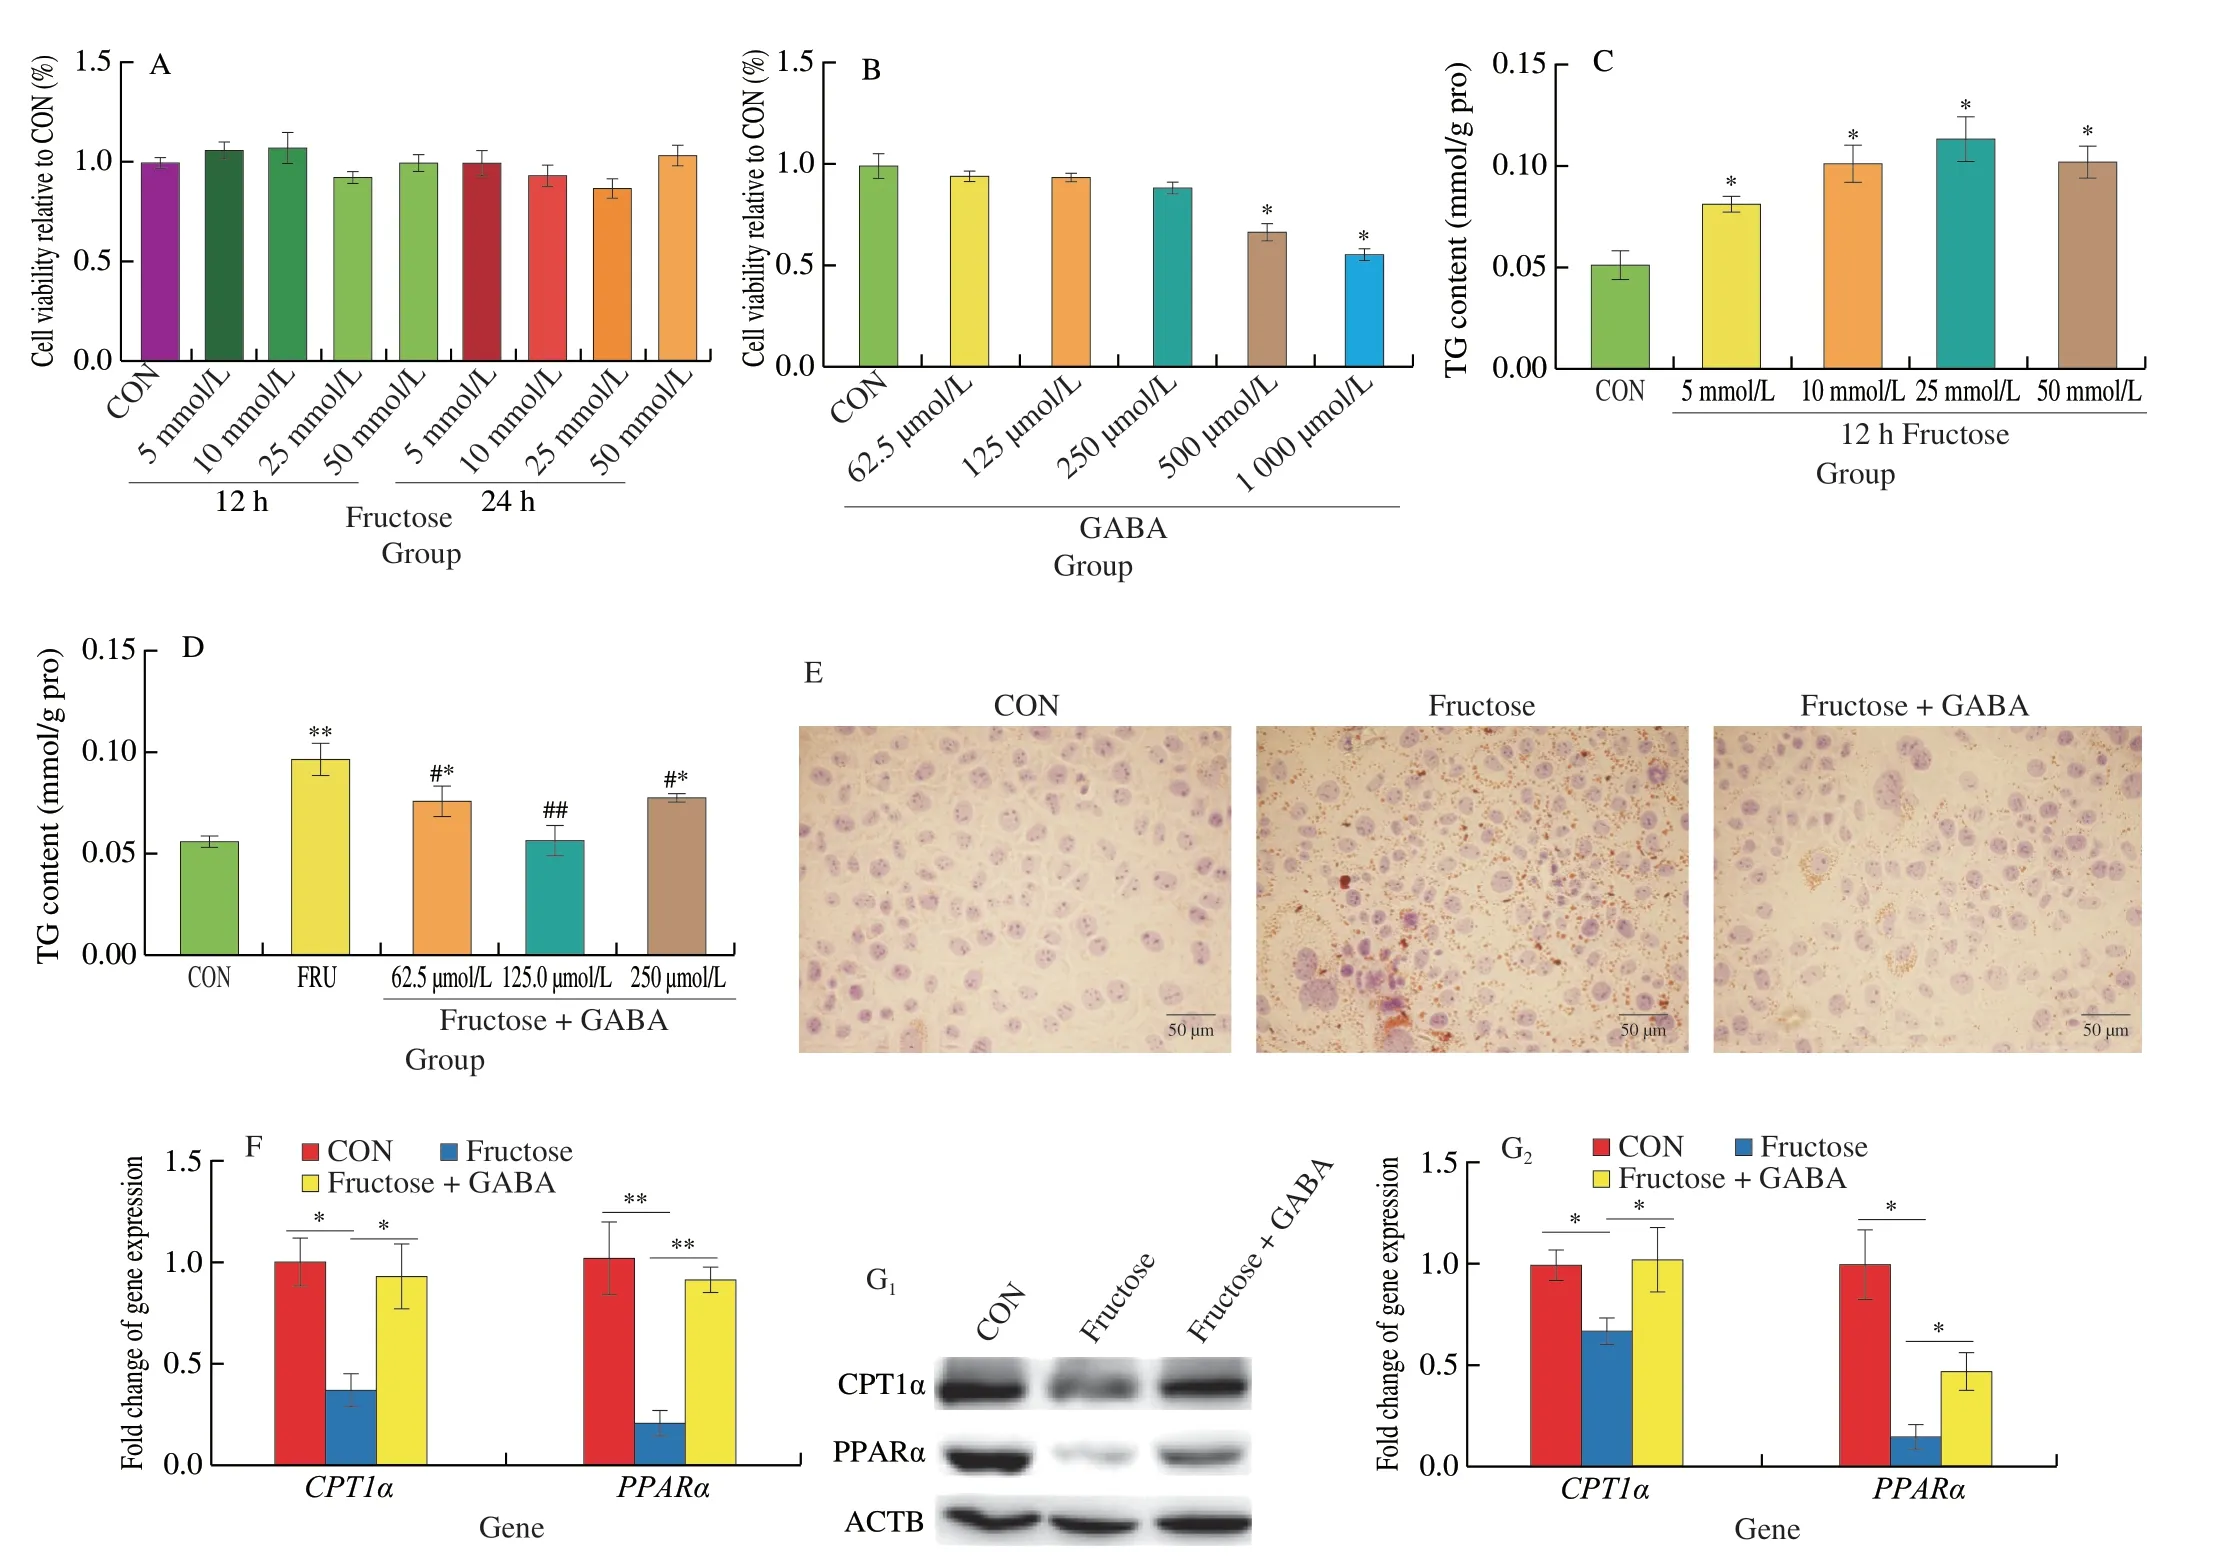
Fig.6 Effects of NaB on fructose-pretreated AML12 cells in vitro.(A) Cell viability treated with different time and doses of fructose.(B) Cell viability treated with different doses of GABA.(C) Effects of 12 h fructose treatment on the TG content.(D) Effects of 12 h GABA (62.5,125 and 250 μmol/L) treatment on the TG content in 10 mmol/L fructose-pretreated AML12 cells.(E) Representative images of Oil Red O staining of the hepatocytes (CON: control,FRU: 10 mmol/L fructose,FRU+GABA: 10 mmol/L fructose+125 μmol/L GABA).(F) The mRNA expression of PPARα and CPT1α.(H) The protein expression of CPT1α and PPARα,ACTB was used as a loading control.*P < 0.05,**P < 0.01 (vs.CON),#P < 0.05,##P < 0.01 (vs.FRU).Data are presented as the mean ± SEM.
4.Discussion
In recent years,the consumption of foods rich in fructose has gradually increased worldwide,leading to increased metabolic syndromes like NAFLD[22-24].This study demonstrated that excessive fructose intake did not affect the body weight of mice,which can be attributed to no change in the total calorie intake of mice in each group (Fig.S1).However,the risk of overweight caused by fructose cannot be ignored,while only taking in slightly more calories than mice fed a high-fructose diet,mice fed the combination of fructose and fat gained significantly more weight[25].Fructose is a dietary component that stimulatesde novolipid synthesis in the liver.It upregulates the expression of upstream factors like sterol regulatory element-binding protein 1 (SREBP1) to stimulate the expression of key enzymes involved in lipid synthesis,increasing endogenous TG levels[26].PPARα plays an important role in lipid metabolism.It regulates the expression of the acyl-CoA oxidase gene that catalyzes the rate-limiting step of lipidβ-oxidation[27].CPT1α is another important factor that upregulates hepatic fatty acidβ-oxidation via transcription factor PPARα[28],and its activity in the liver has been identified to be protecting obese mice against hepatic steatosis[29-30].In this study,our data showed that NaB alleviated fructose-induced hepatic steatosis without affecting the expression of genes involved in the fatty acid synthesis and transport.However,it significantly upregulated the expression ofβ-oxidation-related genes (PPARαandCPT1α).Our results indicated that the activation of hepatic fatty acidβ-oxidation might lead to a decrease in lipid accumulation in NaB-treated mice compared with their control counterparts.
Increasing evidence suggests that the alternation of gut microbial composition is one of the key factors in the development of NAFLD[13,31].However,the pathogenesis and the causal relationship between the gut microbiota and NAFLD have not been elucidated to date.Excessive fructose consumption results in gut microbial dysbiosis in the mammalian gut[32].In this study,after treatment with NaB or NaB-remodeled microbiota transplantation,the intestinal microbiota composition in mice exposed to fructose was closer to that of control mice (Figs.S3A,C).Moreover,FMT further confirmed that gut microbiota improved by NaB alleviated the deleterious effects caused by prolonged fructose consumption,including reducing hepatic steatosis and the levels of plasma uric acid and fructose.Various gut microbiota species exist that encode genes responsible for fructose uptake and metabolism[33].Our data suggested that NaB-remodeled gut microbiota might have a stronger ability to consume fructose,and then reduce the entry of fructose into the liver through the portal vein.
Many studies suggest that focusing on the genus or species level to investigate connections between gut microbiota and diseases is important[34].Our 16S rRNA sequencing and correlation analysis suggested that a decrease in the plasma fructose level was related to an increase in the number ofLactobacillus,which can consume fructose via the Embden-Meyerhof pathway[35-36].Lactobacillusis important for maintaining intestinal microbiota homeostasis,which can inhibit the growth of harmful bacteria by producing organic acids[37-38].Some researchers reported that diet-induced steatohepatitis attenuated by NaB treatment in mice was associated with increased abundance ofLactobacillusspecies[10].At the species level,we found that both NaB and FMT treatments alleviated the decreased abundance ofLactobacillusreutericaused by fructose (Fig.S3E).The protective role ofL.reuteriin fructose-induced hepatic steatosis was previously investigated,and supplemented drinking water withL.reuterisignificantly improved lipid profiles,liver function and inflammation in rats[39].
Studies have revealed that bacterial metabolites are important for regulating the body’s life activities and metabolism[40].A previous study showed that dietary fructose in excess of intestinal metabolic capacity spilled over to the gut microbiota where it could be used by intestinal bacteria to generate amino acids[41].Our metabolomic data showed that NaB-remodeled microbiota significantly altered the profiles of amino acids,decreasingL-glutamic acid and increasing GABA concentrations.The correlation analysis suggested that the increasedLactobacilluscount might promote the conversion ofL-glutamic acid to GABA.Glutamate is one of the metabolites of fructose[42],which can be catalyzed by glutamate decarboxylase to GABA inL.reuteri[43].In fact,Lactobacillusas an efficient and safe GABA producer,has been applied to GABA biosynthesis[44].GABA and GABA-rich foods have shown anti-hypertensive and anti-depressant activities as the major functions in humans and animals[45].A recent study showed a positive effect of GABA on lipid metabolism: supplemented obese rats with GABA-enriched rice bran resulted in the attenuation of the metabolic syndrome by enhancing hepaticβ-oxidation[46].Similarly,ourin vitroexperiments further confirmed that GABA alleviated fructose-induced lipid deposition in hepatocytes by increasing the expression of PPARα and CPT1α.These results suggest that GABA can promote hepatic fatty acidβ-oxidation,which provides an emerging therapeutic strategy to treat NAFLD.
5.Conclusions
The main findings of this study indicated that NaB could alleviate fructose-induced NAFLD via remodeling the gut microbiota.The increase inLactobacillusabundance contributes to the synthesis of GABA,which is the key metabolite to alleviate hepatic steatosis by facilitatingβ-oxidation of fatty acids.Moreover,our study confirmed that GABA could promote the oxidation of fatty acids and reduce lipid deposition in hepatocytesin vitro.Our findings might help elucidate the pivotal role of gut microbiota and their metabolites involved in the process of NaB alleviating NAFLD,thus contributing to develop the synergy of NaB and provide new therapeutic targets,drugs and strategies for NAFLD treatment.
Conflict of interest statement
We declare that we do not have any commercial or associative interest that represents a conflict of interest in connection with the work submitted.
Acknowledgement
This work was funded by the National Key R&D Program of China (2017YFE0114400) and Priority Academic Program Development of Jiangsu Higher Education Institutions (PAPD).
Appendix A.Supplementary data
Supplementary data associated with this article can be found,in the online version,at http://doi.org/10.26599/FSHW.2022.9250082.
- 食品科学与人类健康(英文)的其它文章
- Protective effects of oleic acid and polyphenols in extra virgin olive oil on cardiovascular diseases
- Diet and physical activity inf luence the composition of gut microbiota,benef it on Alzheimer’s disease
- Inf luence of nitrogen status on fermentation performances ofnon-Saccharomyces yeasts: a review
- Ganoderma lucidum: a comprehensive review of phytochemistry,eff icacy,safety and clinical study
- Resveratrol combats chronic diseases through enhancing mitochondrial quality
- Demonstration of safety characteristics and effects on gut microbiota of Lactobacillus gasseri HMV18