
Selecting Suitable Heat Source in Refinery for Multi-effect Distillation Based on Grey System Theory
2013-07-25 10:07XueJianliangZhaoDongfengLiShiLiuWeiShenChanchanChenLu
中国炼油与石油化工 2013年1期
Xue Jianliang; Zhao Dongfeng; Li Shi; Liu Wei; Shen Chanchan; Chen Lu
(College of Chemical Engineering, China University of Petroleum (East China), Qingdao 266555)
Selecting Suitable Heat Source in Refinery for Multi-effect Distillation Based on Grey System Theory
Xue Jianliang; Zhao Dongfeng; Li Shi; Liu Wei; Shen Chanchan; Chen Lu
(College of Chemical Engineering, China University of Petroleum (East China), Qingdao 266555)
For dealing with high-salinity wastewater in the refinery, the high cost of driving heat source is the disadvantage of multi-effect distillation (MED) so it is of great importance to evaluate the performance of low-temperature heat source for conducting MED and select the optimal temperature for it. Both the MED and the low-temperature heat sources studied in this paper were from a typical refinery located in northwestern China. Besides, a new methodology to evaluate heat sources as the optimal candidate was proposed for MED based on the grey system theory. Five process units, which included 18 fluids of the refinery, were named as the evaluation projects. Three factors, which included safety effects, total costs and characteristics of low-temperature heat sources were determined as the evaluation indexes, the values of which were established through the analyses. The results obtained through the grey correlation analyses have revealed that the grey correlation degrees of these units were 0.661(AVDU), 0.732 (#1 FCCU), 0.618 (#2 FCCU), 0.535 (#1 DCU), and 0.572 (#2 DCU), respectively. Thus, the optimal heat source was provided from #1 FCCU. Through further analyses of the fluids from #1 FCCU, the grey correlation degrees of the fluids were 0.597 (oil and gas at top of tower), 0.714 (recycle oil and gas), and 0.512 (diesel), respectively. Thus, the optimal heat source was the oil and gas recycle stream.
multi-effect distillation; grey system theory; heat recovery; high-salinity wastewater; refinery
1 Introduction
It is well known that the multi-effect distillation (MED) is an important technique to treat high-salinity wastewater[1-2]and has been successfully applied to seawater desalination. In the field of wastewater desalination, the MED process dealing with high-salinity wastewater from the refinery has been garnering attention of some researchers[3]. However, the high cost of driving heat source is the main disadvantage of MED when dealing with high-salinity wastewater. Many kinds of renewable energy, such as the solar energy, are emerging as a new type of energy source for the MED process[4]. The further research of other suitable heat sources for conducting MED is being broadly undertaken now.
By now, many low-temperature heat sources (i.e., the heat source with a temperature of around 150 ℃) exist elsewhere at the re finery, which contain a signi ficant amount of heat energy. A large variety of energy-saving technologies are used at the re fineries to reduce energy consumption and wasting[5-7], including the low-temperature recovered heat[8-10]. However, so far as the author is concerned, there is hardly any related evaluation researches on lowtemperature heat used as the driving force of MED process. The purpose of this work is to discuss the characteristics of different low-temperature heat sources available at the refinery, and utilize appropriate analysis methods to select optimal low-temperature heat for conducting MED. In this paper, the grey system theory, one of the methods that are adopted to study the uncertainty, was used to analyze and evaluate the low-temperature heat sources at a typical refinery.
The grey system theory, with emphasis on investigating the inherent law, was launched at the beginning of the 1980s in China[11]. The theory is a truly multidisciplinary and generic theory that specializes in quantitative analysis of complex systems with poor information and/or the related information is lacking[12-13]. Compared with other mathematics theory, the advantage of grey system theory is that this theory can deal with systems, objectsor concepts with well-defined external boundaries or with internal uncertainty. The theory is based on exploring the relationship between independent and interrelating data series, so it can investigate all internal factors which could affect this system. Thus, grey system theory has been extensively used in many applications[11,13-14], such as the selection of heat/cold sources for air conditioning and evaluating energy performance of office buildings[15]. Considering the fact that there are few researches about the characteristics of different low-temperature heat sources and that other mathematics theories are not so effective in evaluating the performance of the low-temperature heat sources, it is necessary to apply the grey system theory to evaluate the performance of low-temperature heat sources.
In this paper, some key evaluation projects were mentioned (including safety effects, total costs, characteristics of low temperature heat sources), and relevant evaluation indexes were discussed too. Through the grey system theory, the low-temperature heat in the refinery is comprehensively analyzed in order to provide a reference for the optimization of the heat source when running the MED process.
2 Grey System Theory
Grey system related analysis is a technique that can be applied to either fuzzy or crisp data. The steps of the calculation process of grey correlation analysis are as follows. Firstly, the evaluation standard or reference sequence is determined; secondly, the relationships among factors (i.e., between the comparison sequence and the reference sequence) are calculated; and thirdly, the grade of comparison sequence is judged according to the correlation degree[14,16]. In the research process, the low-temperature heat resources in the refinery vary between each other, so which one of the heat sources is optimal for running the MED process should be decided by many factors. There are n evaluation indexes in the heat sources, then each index can be seen as a point in an n-dimensional space and the coordinates of the measured values of indexes in the space area1,a2,…,an, respectively. The optimal values of the indexes can be determined by the actual conditions existing during the evaluation. By calculating the differences between the measured and the optimal values of the indexes, the optimal heat source can be identified. The theory must have the following properties[4]:
2.1 Establishment of index eigenvalue matrix
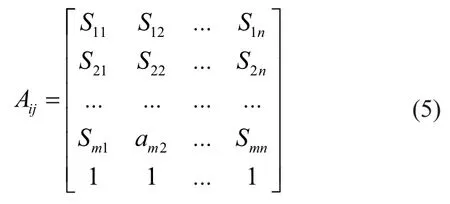
Suppose that there are m evaluation projects, which are composed of n evaluation indexes. In the eigenvalue matrix, evaluation projects are arranged in the rows of the matrix, and the evaluation indexes - in the columns. The eigenvalue matrix of the original indexes is as follows. When m is either the number of cities in the evaluation or the number of years of the evaluation in one city, the eigenvalue matrix of the original indexes is as follows:
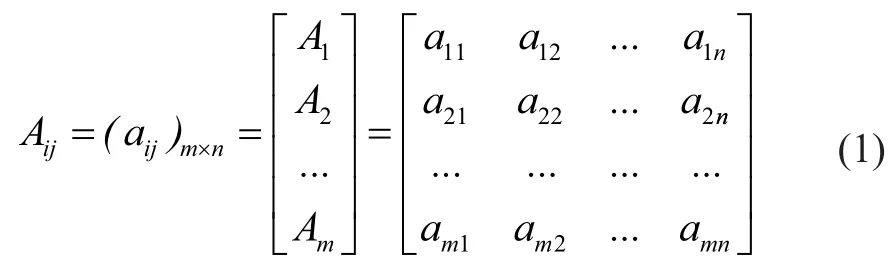
in whichaijis the measured value of theith evaluation project against thejth evaluation index,i=1, 2…m; andj=1, 2…n.
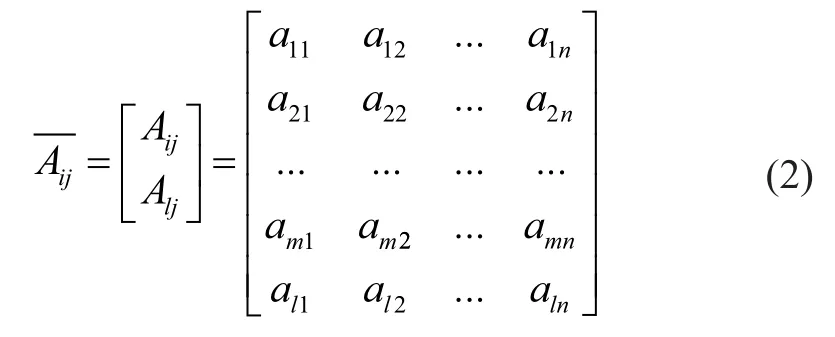
2.2 Selection of reference project
In the grey-system related analysis, in order to evaluate every project, the reference project must be determined. Reference project is a set of optimal values of indexes and is defined as:Al(al1,al2…aln), so the eigenvalue matrix is extended to
2.3 Unification of indexes
Dimensions of evaluation indexes usually vary from each other. In order to reduce the influence of stochastic factors, indexes must be unified. All indexes can be divided into positive indexes and negative ones. Suppose thatSijis the index value ofaijafter unification, and thenSijcan be calculated according to the following equations:
With regard to positive index, the equation for calculatingSijis:
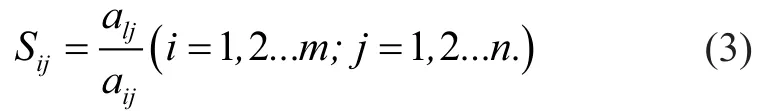
With regard to negative index, the equation for calculat-ingSijis:
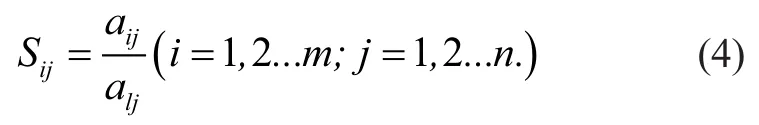
Evidently, the values ofSijin the evaluation projects are [0, 1], and the values ofSijin the reference project are 1. After the unification of indexes, the new index eigenvalue matrix is:
2.4 Calculation of grey correlation coefficient
In the eigenvalue matrix, the grey correlation coefficient of everySijis calculated by the following equation:
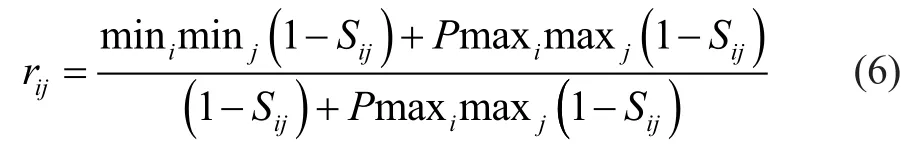
in whichPis the index for distinguishability, and the value is (0, 1). Generally speaking, the value of 0.5 is used[17]; withi=1, 2…m; andj=1, 2…n.
Then the grey correlation matrix is defined as:

2.5 Calculation of index weights
The calculation of index weights is an important part in the evaluation, which can influence the accuracy of calculation results. Many methods can calculate the index weights. In this paper, the said method was to take advantage of the comparison matrix. The steps are as follows. At first, the comparison matrix is defined as:

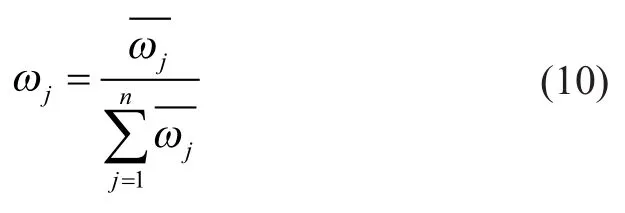
in whichbjkis the measured value of the jth evaluation index against the kth index; withj=1, 2…n; andk=1, 2…n. Then, the columns of comparison matrixbjkshould be unified toand the index weightωjis calculated as follows:

So, the set of index weightsωis:
2.6 Calculation of grey correlation degree
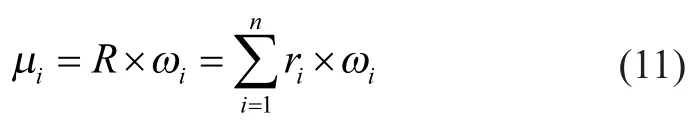
According to the grey correlation matrix and index weights, grey correlation degrees can be calculated by the following equation:
3 Case Implementation
In this paper, the objective of evaluation was to find the optimal heat source for MED which was designed for desalination of high-salinity wastewater at a typical refinery located in northwestern China. Zhao, et al.[3]have studied the heat source of MED from 4.65 t/h of steam with a temperature of 100 ℃. The evaluation projects included five refinery units (one atmospheric and vacuum distillation unit (AVDU), two fluid catalytic cracking units (FCCU), and two delayed coking units(DCU)). All lowtemperature heat sources could provide the heat necessary for converting water into steam. The parameters of lowtemperature heat are shown in Table 1.
Table 1 covers five refining units with 18 fluids, which were used as evaluation projects. Therefore, the analysis was divided into three separate tasks as shown below:
(1) Selecting the optimal indexes to evaluate the projects.
(2) Based on the grey system theory, the optimal units were defined.
(3) Based on the grey system theory, the optimal fluids in the optimal units were determined.
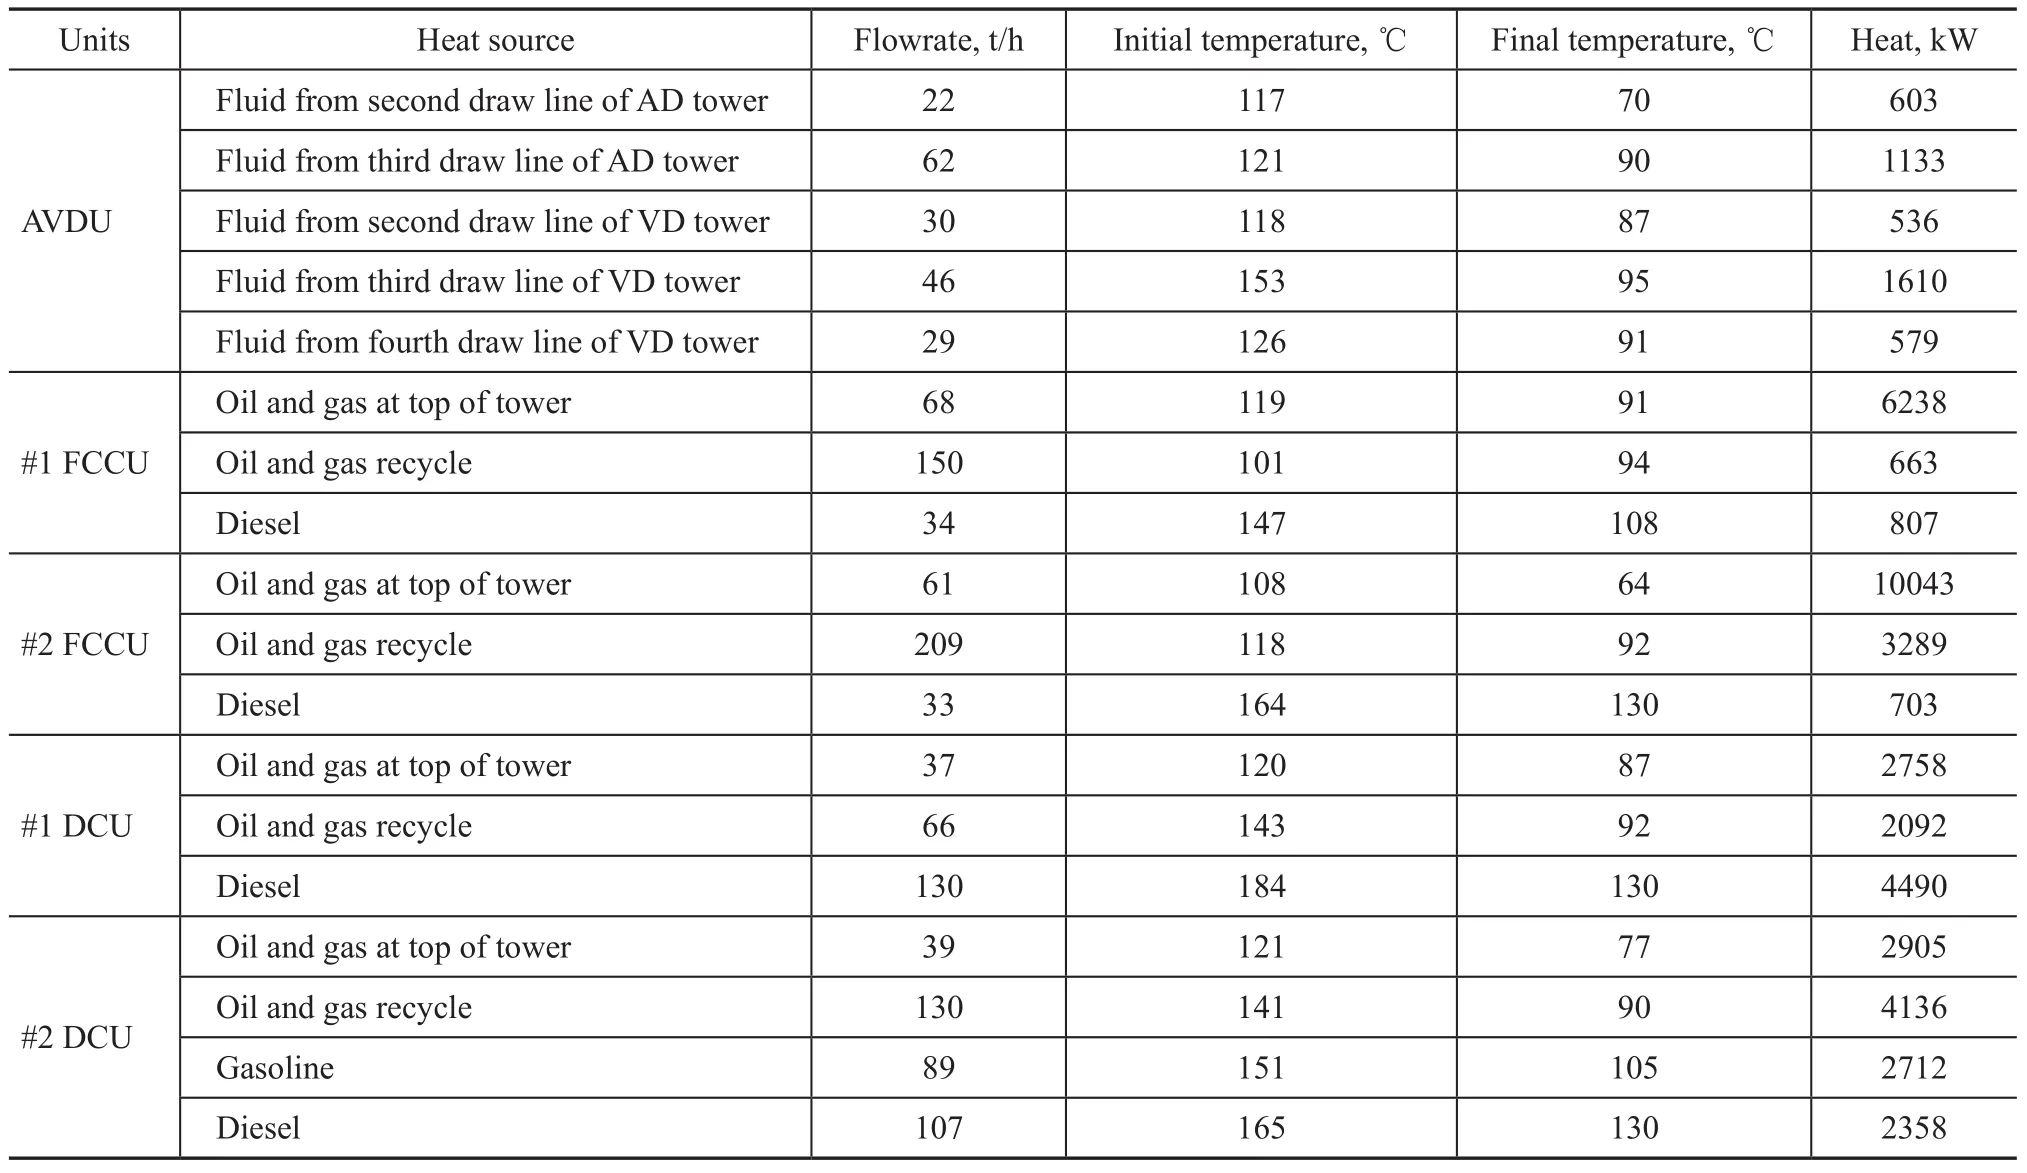
Table 1 Parameters of low-temperature heat sources
3.1 Establishment of evaluation index
All fluids transferred the heat to the water which was then converted into steam. And the steam was used to operate the MED. Therefore, the evaluation indexes should be selected from the heat-exchange process. During the heatexchange process, many factors could affect the result. For example, the fluid phase and pressure could affect the corrosion process, and thus affect the safety of the heat exchanging process; different heat-transfer coefficients would bring about different heat transfer areas; the heat and initial temperature of fluids could also affect the efficiency of this process.
Therefore, the evaluation indexes should include the safety effect, the total cost and the characteristics of lowtemperature heat sources.
3.1.1 Safety effects
The signi ficance of safety effect factor could be emphasized by the needs for controlling the equipment corrosion caused by heat sources. In the heat exchanging process, fluids could induce corrosion of the equipment, so that equipment could be damaged by an accident. However, many factors could affect the corrosion, such as the fluid phase, the fluid pressure, and the concentration of impurities, etc.[17]By means of this analysis, all the factors could be expressed by some properties of low-temperature heat sources. Some researchers indicated the equipment corrosion caused by heavy oil is higher than that of light oil. Thus, the value of different fluids’ safety effect is defined by the five-level method of fuzzy mathematics. The value is shown in Table 2.
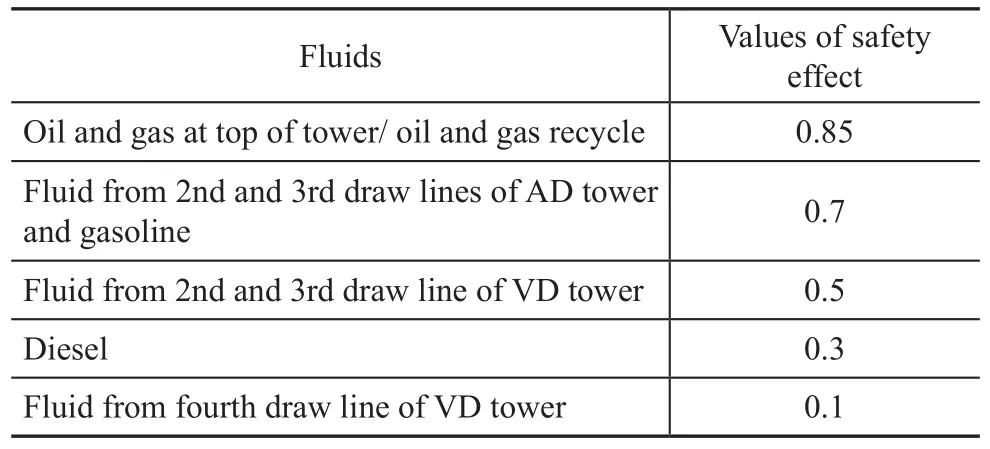
Table 2 Values of safety effect of different fluids
The safety effects vary because the fluids are different. The values of safety effect of different process units are the weighted average values, which are calculated according to the mass of every fluid. These values are presented in Table 3.
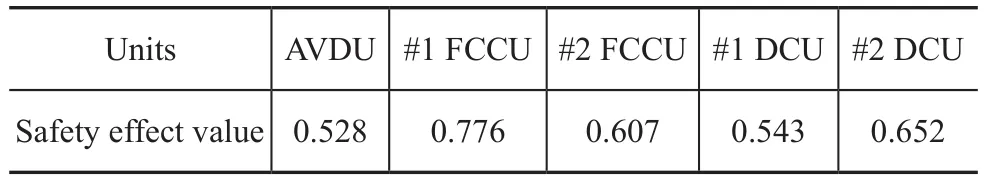
Table 3 Safety effect values of different unit
3.1.2 Total cost
The cost in the heat exchanging process includes the initial investment cost, the operating cost, and so on.
(1) Initial investment
When recovering the low-temperature heat to run the MED system, the initial investment is composed of the investment in heat-exchange facilities, pipelines, etc.
① Cost of heat-exchange facilities.
Heat-exchange facilities are used to transfer heat from the low-temperature heat source to the cold working fluid (i. e., water). The mass of the fluid can affect the cost. Meanwhile, the heat transfer coefficient of different fluids can affect the type and the heat transfer area of the heat exchanger.
As it is well-known to us, theK0can be calculated as follows:
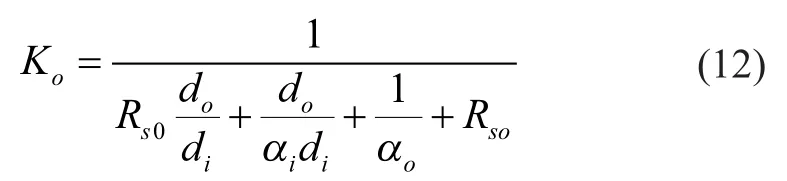
in whichαis convective heat transfer coefficient;Rsis fouling thermal resistance;dis the diameter.
Kodepends mainly on fluid properties, operating conditions, and the type of the heat-exchanger, etc. In this paper, the operating conditions and the fluid properties play an important role onKo. The values ofKofor typical fluids are shown in Table 4.
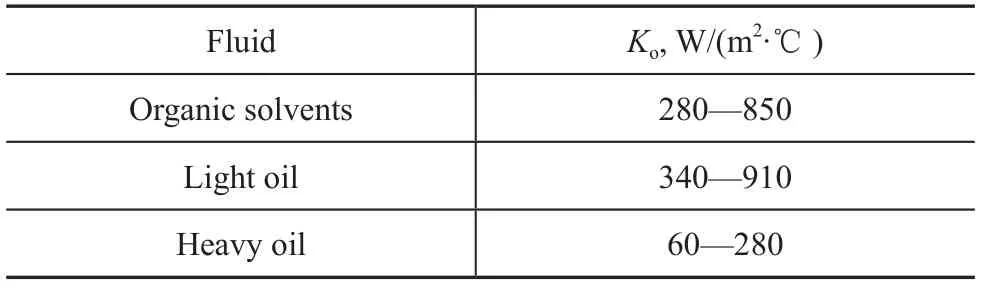
Table 4 Koof different fluids
It can be seen from Table 4 that the values ofKoare different from each other. When Ko was lower, the heat transfer area was higher.
Thus, upon determining the cost of the heat-exchange facilities, these factors should all be taken into consideration.
② Cost of pipelines
The function of the pipelines is related with heat integration in this process. The cost of the pipelines depends on the distance between the hot and cold fluids.
Therefore, the cost of initial investment is calculated to cover all the factors.
(2) Operating cost
All fluids transfer heat to water, so the operating cost isconsidered as the cost of water consumed thereby.
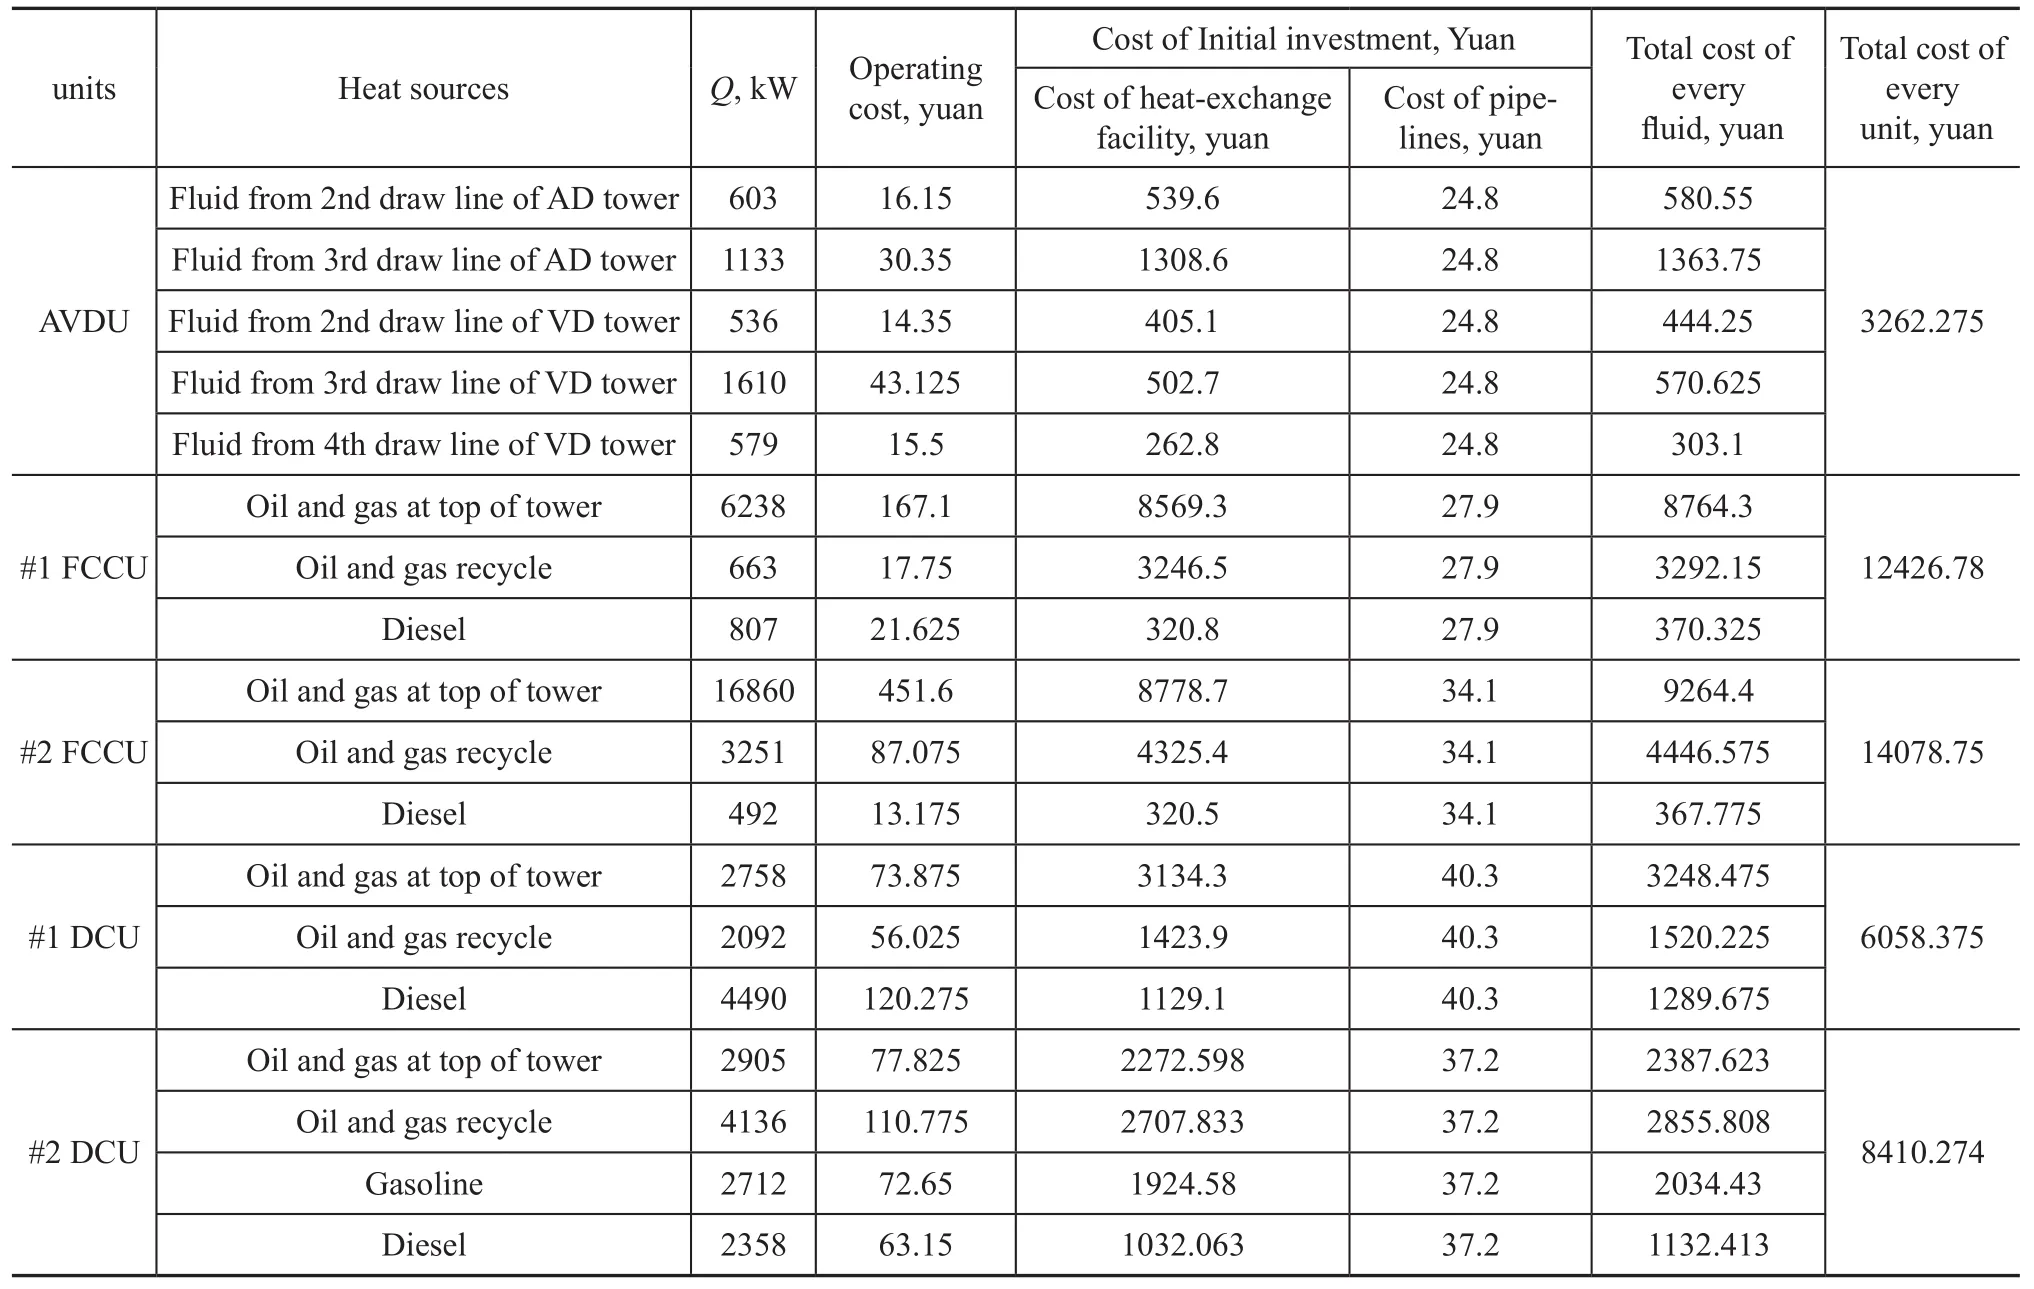
Table 5 Values of different unit’s total cost
The operating cost is calculated and shown in Table 5.
3.1.3 Characteristics of low-temperature heat source
Characteristics of fluids are factors of great importance. Characteristics of fluids can influence the efficiency of the heat transfer process. In this paper, the characteristics of the fluids included the heat, the phase, and the initial temperature of the low-temperature heat sources. The values of the fluids could be determined by the five-level method of fuzzy mathematics, and were specified as 0.9, 0.7, 0.5, 0.3, and 0.1, respectively. For example, the value could be determined higher, when the heat quantity and initial temperature of the low-temperature heat source was higher. Through this analysis, the values of different fluids are showed in Table 6.
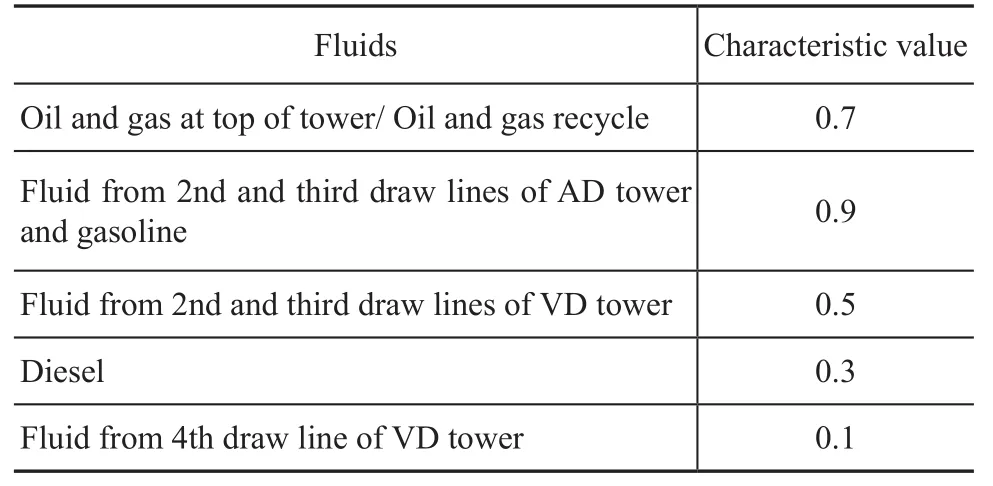
Table 6 Characteristic values of different fluids
The value of different units is the weighted average value, which was calculated on the mass of each fluid. The values are presented in Table 7.
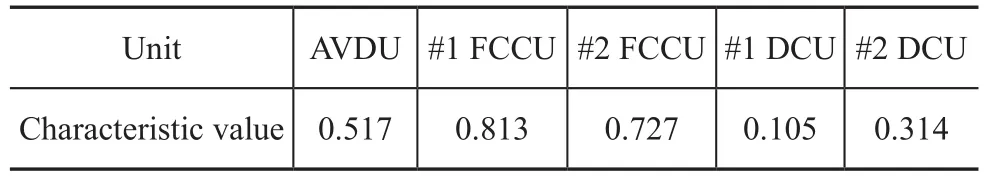
Table 7 Characteristic values of different units
3.2 Evaluation units
Through this analysis, five units were designated as the evaluation projects, and three factors (including safety effects, total costs, and characteristics of the low-temperature heat source) were set as the evaluating indexes. All values of factors for the related units have been established. However, the referential project was steam with a flow rate of 4.65 t/h at a temperature of 100 ℃, so the value of the evaluating indexes of the referential projects could also be measured, which were 0.9, 11.25, and 0.9, respectively. Thus, the eigenvalue matrix was:
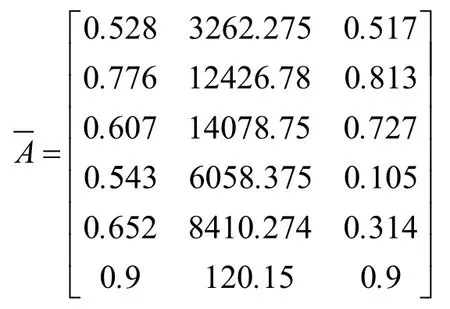
Then, the grey correlation degree of these units could be calculated (as shown in Table 8).
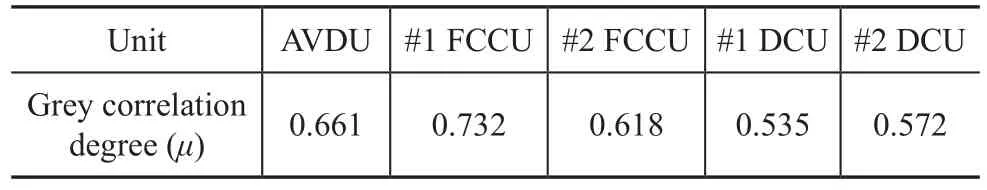
Table 8 Values of grey correlation degrees of the units
According to Table 8, the grey correlation degree of the process units decreased in the following order:μ(#1 FCCU)>μ(#2 DCU)>μ(#2 FCCU)>μ(#2 AVDU)>μ(#1 DCU). Thus, the results showed that the #1 FCCU could be the optimal unit.
3.3 Evaluating the fluids from the optimal unit
The #1 FCCU possessed three fluids, which also could run the MED independently. In order to select the optimal fluid from the #1 FCCU, the three fluids (including oil and gas at top of tower, oil and gas recycle, and diesel) were designated as the evaluation projects, and three factors were set as the evaluating indexes. The values of the evaluating indexes of the referential project were also equal to 0.9, 11.25, and 0.9, respectively. Thus, the eigenvalue matrix was:
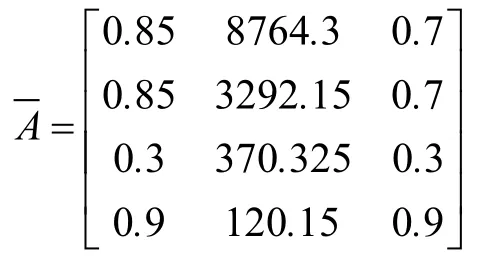
Therefore, the grey correlation degree of the fluids could be calculated (as shown in Table. 9).
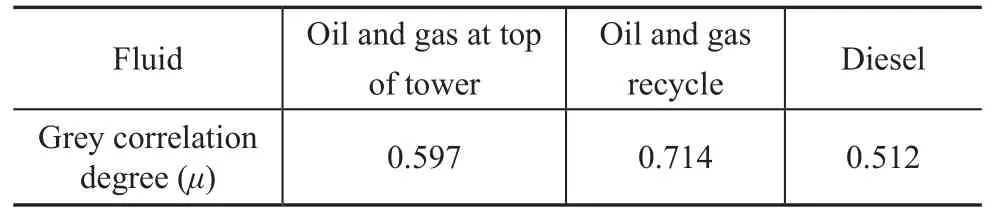
Table 9 Values of grey correlation degrees of the fluids from #1 FCCU
According to the data listed in Table 8, the grey correlation degrees decreased in the following order:μ(oil and gas recycle)>μ(oil and gas at top of tower)>μ(diesel). Thus,the result could show that the optimal heat from oil and gas recycle could be the optimal heat source that could be used to drive MED for desalting the high-salinity wastewater.
4 Conclusions
This paper used grey correlation analyses to evaluate the heat sources in the refinery in order to select the optimal heat source to drive the MED for desalting the high-salinity wastewater. The results are as follows:
(1) The refinery was located in northwestern China and there were five units including 18 fluids. These heat sources could be designated as the evaluation projects; and the evaluation indexes covered the safety effects, the total cost, and the characteristics of low-temperature heat source. Through the analyses, the values of evaluation indexes of all the fluids were determined.
(2) Through this evaluation, the grey correlation degrees of the units were equal to 0.661 (AVDU), 0.732 (#1 FCCU), 0.618 (#2 FCCU), 0.535 (#1 DCU), and 0.572 (#2 DCU), respectively. Thus, the optimal heat source was emanated from the #1 FCCU.
(3) Upon analyzing the fluids from the #1 FCCU, the results showed that the grey correlation degrees of the fluids were 0.597 (for oil and gas at top of tower), 0.714 (for oil and gas recycle), and 0.512 (for diesel), respectively. Thus, the optimal heat source was emanated from the oil and gas recycle stream.
Acknowledgements:The authors sincerely thank the Natural Science Foundation (Grant No. 51178463), the Fundamental Research Funds for the Central Universities (10CX04018A) of China for financial support of this study, and the Environment and Safety Technology Center of China University of Petroleum for its technical and logistical assistance.
[1] Kazemian M E, Behzadmehr A, Sarvari S M H. Thermodynamic optimization of multi-effect desalination plant using the DOE method [J]. Desalination, 2010, 257: 195-205
[2] Kamali R K, Abbassi A, Sadough Vanini S A, et al. Thermodynamic design and parametric study of MED-TVC[J]. Desalination, 2008, 222: 596-604
[3] Zhao Dongfeng, Xue Jianliang, Li Shi, et al. Theoretical analyses of thermal and economical aspects of multi-effect distillation desalination dealing with high-salinity wastewater [J]. Desalination, 2011, 273(2/3): 292-298
[4] Collares Pereira M, Mendesa J F, Horta P, et al. Final design of an advanced solar dryer for salt recovery from brine effluent of an MED desalination plant[J]. Desalination, 2007, 211(1/2/3): 222-231
[5] Smaili F, Vassiliadis V S, Wilson D I. Mitigation of fouling in re finery heat exchanger networks by optimal management of cleaning [J]. Energy & Fuels, 2001, 15(5): 1038-1056
[6] Szklo A, Schaeffer R. Fuel speci fication, energy consumption and CO2emission in oil refineries [J]. Energy, 2007, 32(7): 1075-1092
[7] Gadalla M, Olujic Z, Jansens P J, et al. Reducing CO2emissions and energy consumption of heat-integrated distillation systems[J]. Environ Sci Technol, 2005, 39(17): 6860-6870
[8] Milani R. Low-temperature heat-recovery in an oil re finery [J]. Applied Energy, 1990, 36(1/2): 43-45
[9] Oda S D, Hashem H H. Proposals for utilizing the waste heat from an oil refinery [J]. Heat Recovery Systems and CHP, 1990, 10(1): 71-77
[10] Jana A K, Santosh V M. Analysis and control of a partially heat integrated refinery debutanizer [J]. Computers & Chemical Engineering, 2010, 34(8/9): 1296-1305
[11] Deng Julong. Theory and method of social economic grey systems[J]. Social Science of China. 1986, 6: 47-60 (in Chinese)
[12] Hsu C C, Chen C Y. A modi fied grey forecasting model for long-term prediction [J]. Journal of the Chinese Institute of Engineers, 2003, 26(3): 301-308
[13] Shao Fei, Deng Wei, Li Feng, et al. Fuzzy Matter-Element Model for Crossing-site Selection Based on Grey Relational Analysis and Approach Degree[C]. International Conference on Future Information Technology and Management Engineering, 2010: 159-162
[14] Zhu Jiulong. Urban Atmospheric Environmental Quality Evaluation Based on Grey Correlation Analysis [C]. 2010 International Conference on Machine Vision and Human-Machine Interface, 68-71
[15] Lee W S, Lin Y C. Evaluating and ranking energy performance of of fice buildings using grey relational analysis[J]. Energy, 2011, 36(5): 2551-2556
[16] Zhang F T, Su W C, Zhou J X. Assessment of urban ecological security based on entropy-weighted gray correlation analysis[J]. Chinese Journal of Ecology, 2008, 27(7): 1249-1254 (in Chinese)
[17] Fu Chaoyang, Zheng Jiashen, Zhao Jingmao, et al. Application of grey relational analysis for corrosion failure of oil tubes [J]. Corrosion Science, 2001, 43(5): 881-889
Recieved date: 2012-11-18; Accepted date: 2012-12-21.
Zhao Dongfeng, Telephone: +86-532-86981576; E-mail: zhaodf@vip.sina.com.

- 中国炼油与石油化工的其它文章
- Alumina Supported Vanadium Oxide Catalysts for Residue Hydrotreating
- Highlights on Planned Grassroots Styrene Units and Expansion of Existing Styrene Units in China
- Hydrocarbon Composition of Different VGO Feedstocks and Its Correlation with FCC Product Distribution
- Purification of Crude Glycerol from Waste Cooking Oil Based Biodiesel Production by Orthogonal Test Method
- Degradation of Nitrobenzene-Containing Wastewater with O3and H2O2by High Gravity Technology
- Et3NHCl-AlCl3Ionic Liquids as Catalyst for Alkylation of Toluene with 2-Chloro-2-methylpropane