
A Novel Modeling, Simulation and Optimization Approach of Crude Oil Cold Stripping Process
2013-07-25 10:07KavehHezavehHesarmaskanHabibAleEbrahim
中国炼油与石油化工 2013年1期
Kaveh Hezaveh Hesarmaskan; Habib Ale Ebrahim
(Amirkabir University of Technology (Tehran Polytechnic), Department of Chemical Engineering, Tehran, Iran)
A Novel Modeling, Simulation and Optimization Approach of Crude Oil Cold Stripping Process
Kaveh Hezaveh Hesarmaskan; Habib Ale Ebrahim
(Amirkabir University of Technology (Tehran Polytechnic), Department of Chemical Engineering, Tehran, Iran)
Cold stripping is the most common process for crude oil sweetening in oilfields particularly at offshore installations because of its low price and relatively easy operating conditions in comparison with other sweetening processes. In this paper the cold stripping process in tray column has been modeled mathematically in static and dynamic modes, and solved with the MATLAB software. This process has been used in the existing treatment facilities of an offshore oil production complex for verifying the model results. With the help of HYSYS software the effective parameters on the process have been discussed and the optimized conditions finalized after some plant modifications for improving the performance of stripper columns have been proposed.
modeling, simulation, optimization, sour crude oil, cold stripping
1 Introduction
Crude oil generally contains a definite amount of sulfur compounds, and the crude that contains especially hydrogen sulfide (H2S) in excess of 5.1×10⁻³kg/m3is called a sour one. The main focus is aimed at removal of hydrogen sulfide, because other sulfur compounds are far less toxic and not so aggressively corrosive. The presence of brine exacerbates the equipment corrosion as does CO2[1]. Personnel safety and equipment protection require that H2S and other sulfur compounds be removed as far as possible.
The most important source of H2S production in oil reservoirs is propped up by the activity of sulfate reduction bacteria (Desulfovibrio,Desolfotomaculum,Desolfococcus,DesolfonemaandDesolfosarcina) at injected water contact zone with existing water in formation[2]. Regardless of the source, the remaining H2S content in crude should be decreased to 2.1×10⁻⁵kg/m3to protect personnel, mitigate corrosion and meet sales specification. Crude oil can be sweetened by many of the same chemicals used to remove acid gases from sour natural gas. Amines, caustic, zinc salts and other bases and/or oxidizing agents have been considered but because crude oil usually contains far more contaminants, the liquid/liquid chemical processes are seldom used[3]. Removal of H2S is usually accomplished by stripping with cold or hot natural gas that are cheaper than other alternative processes[4-6].
Although there are many models and simulation works for gas sweetening including especially those based on alkanolamines method[7-8], the exclusive models for crude stripping by natural gas must be considered for this process.
In this work the non-equilibrium method has been chosen for modeling the process in static and dynamic modes[9]. In static mode the number of trays can be calculated and in order to obtain the mole fraction on each tray the dynamic mode has been applied to study the changes at the column inlet. Mass transfer equations have been obtained on the basis of film theory because it has been assumed that the resistance against mass transfer is only in the phases and not in the fluid interface[10].
To verify the model results, an offshore oil production complex in Persian Gulf with its stripping facilities consisting of two consecutive tray columns has been assigned as the candidate of the pilot unit. To determine the effect of the modification over H2S expulsion and crude oil quality at our case plant, a sensitivity analysis has been carried out and finally the optimized process parameters have been proposed.
2 Model Definition
2.1 Static mode
In static mode, fluids in the column with counter-current flow pattern have constant conditions without any changes. The model calculates the number of trays and mole fraction across the column. The pressure and temperature profiles through trays can be considered as final results. However, because of nature of the process, the temperature profile is not included in our scope of work.
2.1.1 Total mass balance equation
Assumptions for total mass balance equation are as follows:
1) Mass transfer is in a steady-state condition;
2) Direction of mass transfer should be from crude oil to stripping gas; and
3) Crude and gas leave each tray with inlet conditions defined as:
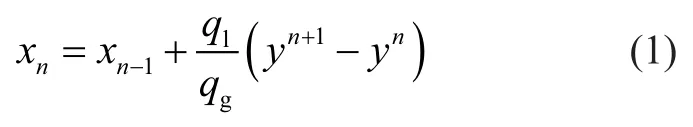
in whichxandyare mole fractions of H2S in bulk of crude oil and sweet gas, andqlandqgare flow rates of crude and gas.
2.1.2 Mass balance in crude phase
The assumptions for mole fraction calculations are considered as follows:
1) Movement of each gas bubble has no effect on other bubbles; and
2) Gas flow speed into the crude is stable.
So it can be written as follows:
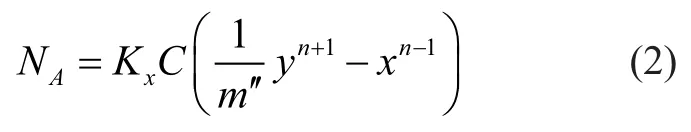
in whichKxis total mass transfer coefficient,Cis total concentration andm″is slope of the equilibrium curve.
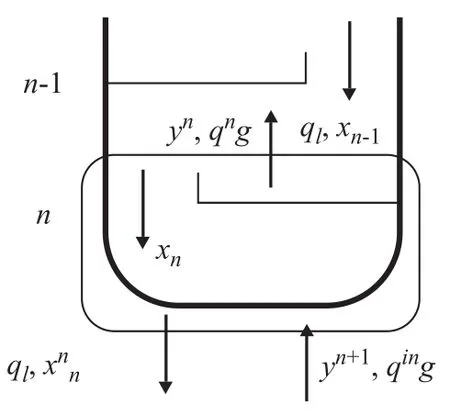
Figure 1 The schematic of bottom of the column
The mass transfer is a liquid-controlled one andm″is quite large, so Equation (1) can be simplified as shown below:
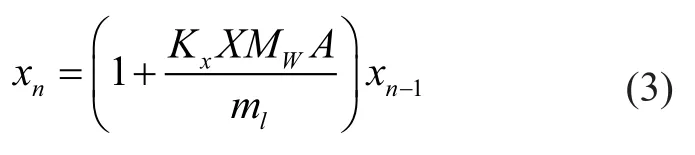
in whichMWis molecular weight,Ais mass transfer area andmlis total molar flow rate of crude oil. In these equations, two unknown parameters,ynandxn-1are calculated and the number of trays in the column can be obtained.
2.2 Dynamic model
The inlet crude changes fromLintoL2insuddenly. Because of this change, the volume of crude on each tray increases and reaches an equilibrium after some specified time by decreasing the height of liquid on the tray to weir height[11]. The liquid volume on the tray changes exponentially so the following equation can be written for the response time:
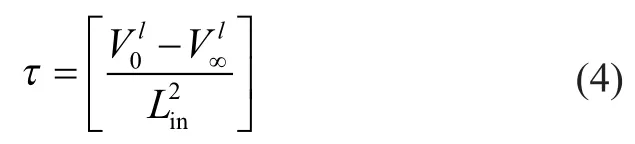
With the following equations it is possible to calculate the mole fractions on each tray:
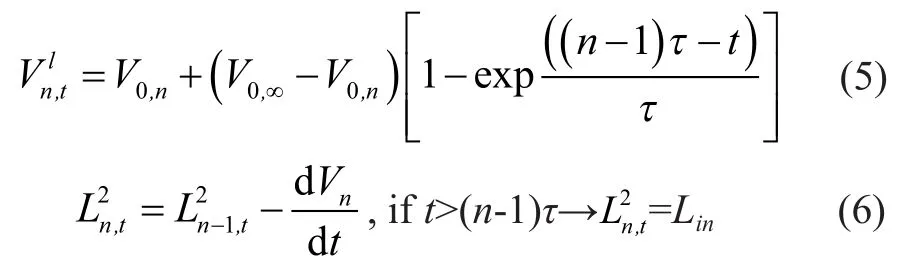
Crude volume change on each tray and flow rate of discharged fluids for each tray can be calculated by means of the volume balance as shown below[12]:
3 Results and Discussion
3.1 Pilot plant data
The total renovation project in the Bahregansar field wascompleted in 2007 and a new complex was installed near old facilities and put on production to replace them in 2008. Sour crude oil from the three-phase separators flows to the top tray of the first stage stripper and sweet gas from the sweet separator (with crude of formations containing very low concentration of H2S flowing to this three-phase separator) splits up into two parts. A part of sweet gas flows to the bottom of the first stage stripper column, whereas the crude flows downwards inside the column. In the second stripper column the remaining hydrogen sulfide is flashed off. The H2S content of treated crude is finally lower than 5.5×10⁻⁵kg/m3. The schematic of process flow diagram is given in Figure 2.
The composition of sour crude, sweet crude and sweet gas is listed in Table 1.
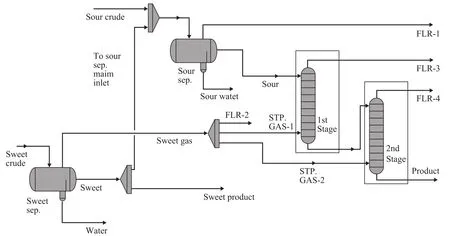
Figure 2 The schematic of plant PFD
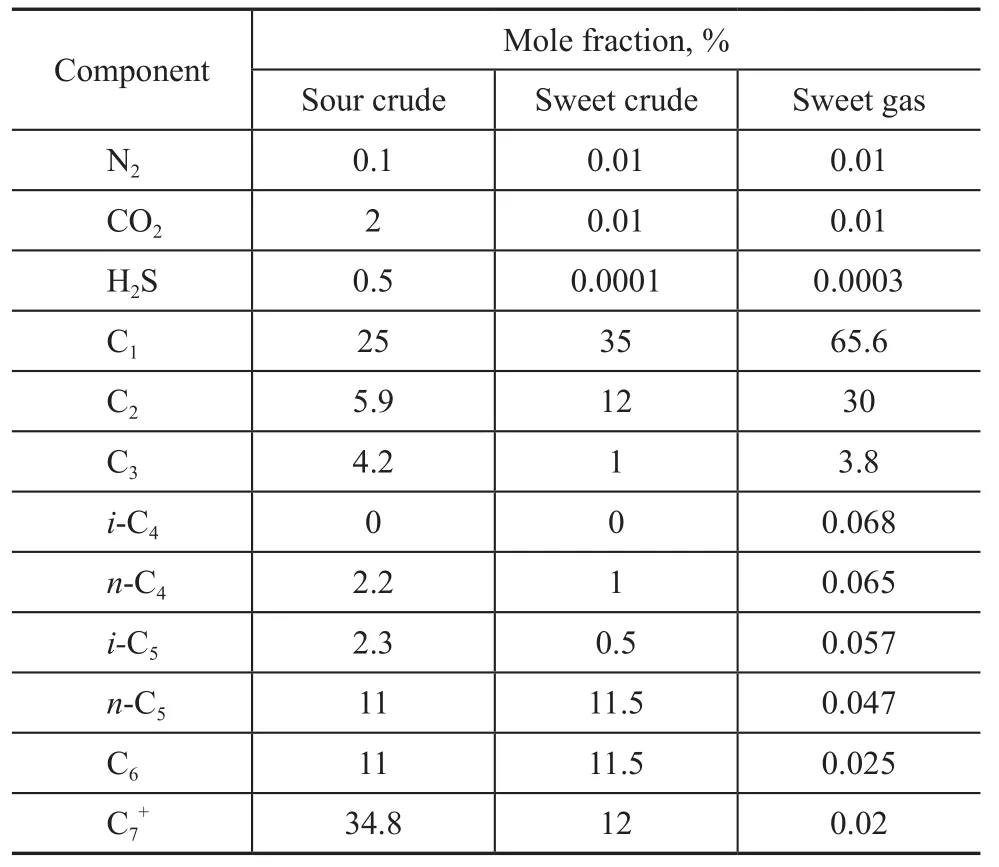
Table 1 Fluids composition
The inlet crude comes from sour separators at 55 ℃and 0.68 MPa and flows to the first column at 0.42 MPa. The temperature of stripping sweet gas is 40 ℃. Each column with 15 bubble cap trays is counted from top to bottom; and the internal differential pressure between trays is 14 kPa.
3.2 Modeling results
Sour crude oil with a flow rate of 3.5 m3/s enters the first stage stripper column. The sweet gas injection rate is: 78 m3/s in the first stage column and 49 m3/s in the second one. Pressure in these columns is set at 0.4 MPa and 0.2 MPa, respectively. The differential pressure at the top and bottom of trays must be maintained at 14 kPa. Modeling has been done in static mode and the H2S mole fraction across the column is shown in Figure 3. To achieve a specified level of H2S concentration to meet the market requirements and standards, it can be clearly seen from Figure 3 that 27 trays must be used in one stripper column.
Figure 4 shows the comparison between model results and experimental data.
Pressure profile across the columns is shown in Figure 5. It is obvious that the profile is linear and the summation of pressure drop of trays is equal to the total column pressure drop. When the inlet flow of crude increases suddenly, the volume of liquid on each tray becomes a function of time;therefore the mass transfer coefficient is time-dependent. Change in inlet flow leads to change in the thickness of liquid on weir (Figure 6). The overflow thickness (L0w) can be calculated using theFrancisformula as presented below[13-14]:
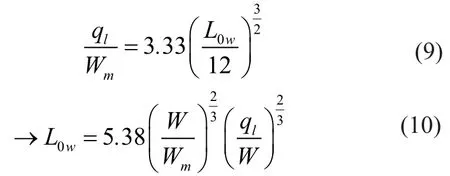
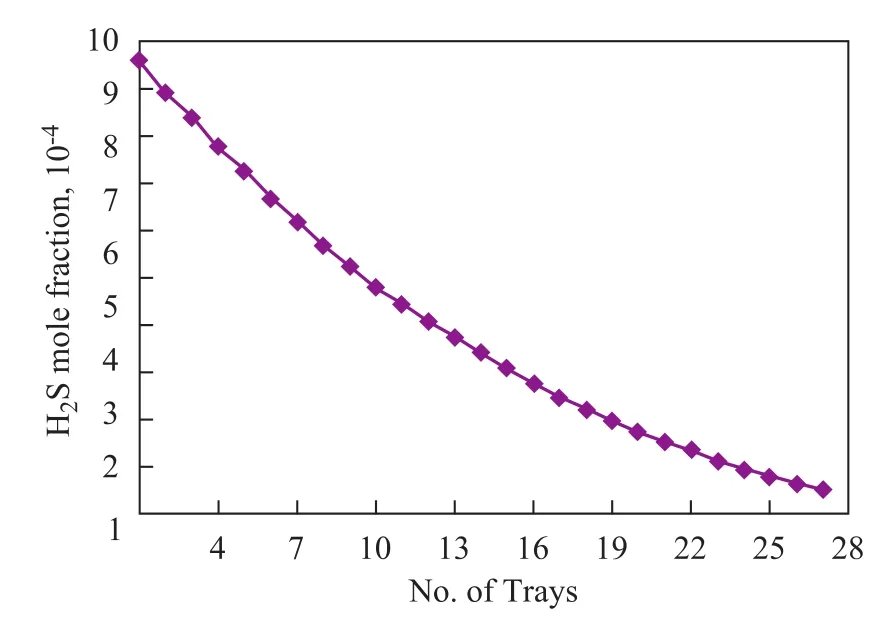
Figure 3 H2S mole fraction of crude oil on trays
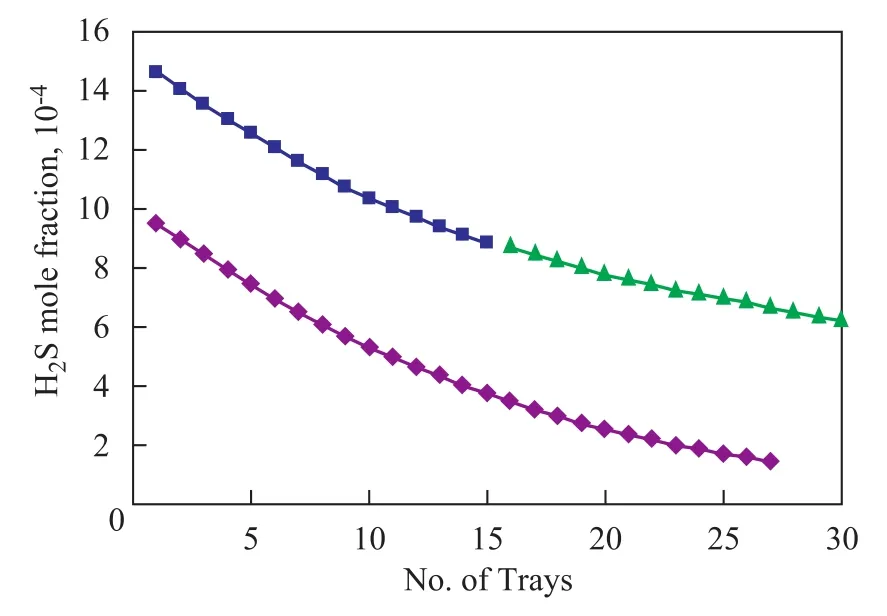
Figure 4 H2S mole fraction of crude oil (model and plant data)
in whichWmis effective weir length obtained from diagrams that have been designed for this purpose and depends on weir length and ratio ofL0wto column diameter[15].
Figure 5 Pressure profile across the column trays
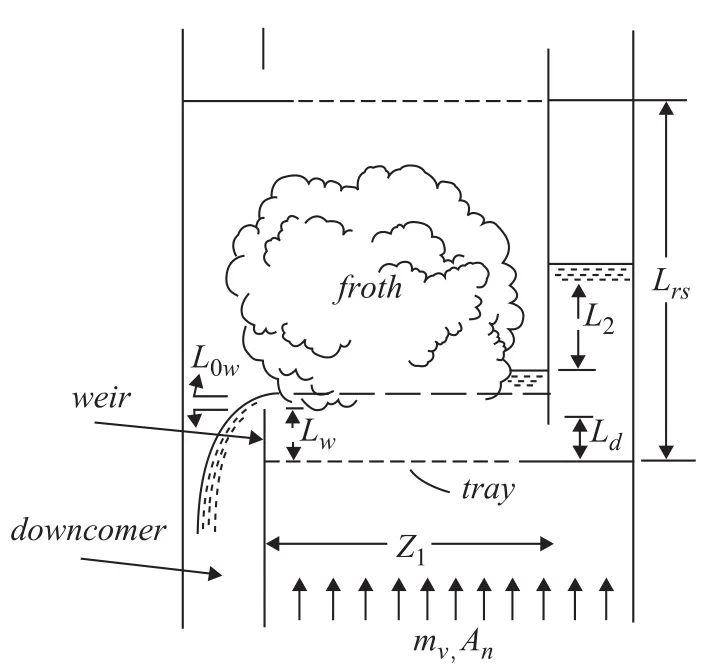
Figure 6 Overflow thickness on weir
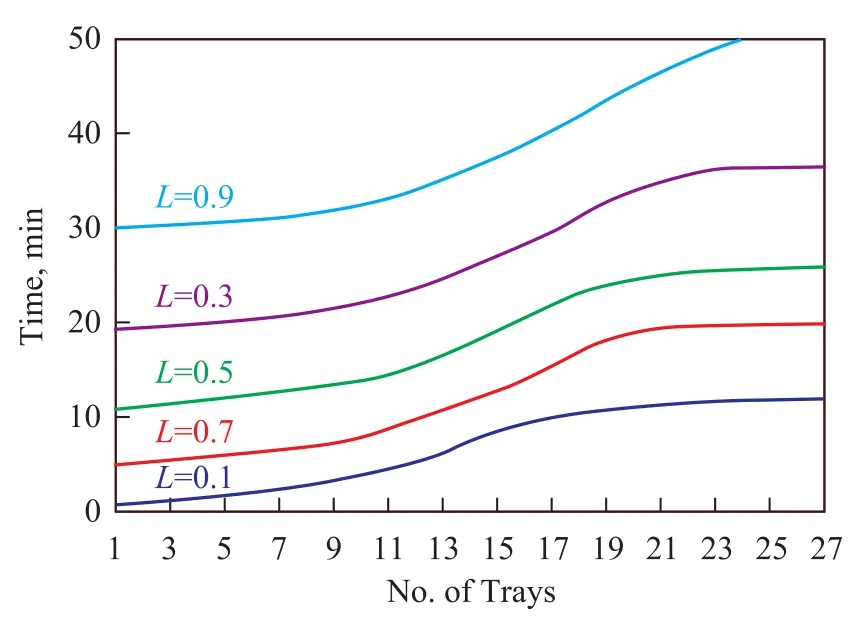
Figure 7 Response time at different L
The dynamic model calculates the time it takes to return to a steady state. It can be seen from Equation 10 that the ratio of overflow thickness before and after inlet flow change(L=L0w/ L1w)depends on the changing flow, but this relationship is not linear because the ratio ofW/Wmchanges withL0w/d. Figure 7 shows the response time trend at differentL.It has been clearly shown in Figure 7 that bigger change has greater effect on response time, in other words whilst the inlet crude flow is increasing, the response time for getting back to steady state on each tray is growing up, and in some conditions ifLis a very small amount, it is not possible for the system to adapt the trays and columns to be restored to stable condition.
3.2.1The Effect of gas flow rates and columns pressure on H2S and specific gravity of crude
The sensitivity analysis has been carried out by means of experimental, modeling and simulation data coupled with the following inputs: The sweet gas flow rate changes from 39 m3/s to 78 m3/s in the first stage column, and from 20 m3/s to 59 m3/s in the second one, with the sour crude oil flow rate equating to 3.5 m3/s. The results are plotted in Figure 8. As shown in Figure 8, it is obvious that increasing the flow of sweet gas in the second stage column to more than 39 m3/s has a slight effect on the final concentration of H2S.
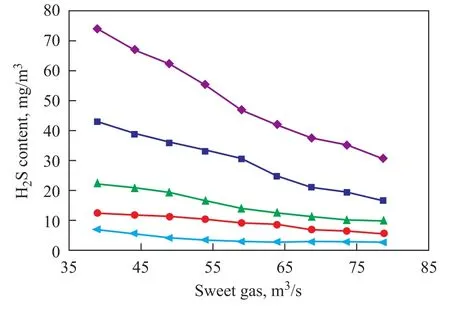
Figure 8 Effect of sweet gas on H2S content of crude
The curves of specific gravity of crude oil versus sweet gas flow rate are presented in Figure 9. The specific gravity of crude increases with an increasing amount of sweet gas injected into the second stage column. When the injection rate is greater than 39 m3/s, the curve shows a fairly steep slope.
Figure 10 and Figure 11 have been obtained with the following conditions: The pressure in the first stage column is changed from 0.55 MPa to 0.35 MPa at a sweet gas injection rate of 55 m3/s; and the pressure in the second stage column is changed from 0.35 MPa to 0.15 MPa at a sweet gas injection rate of 35.5 m3/s, with the crude oil flow rate equating to 3.5 m3/s.
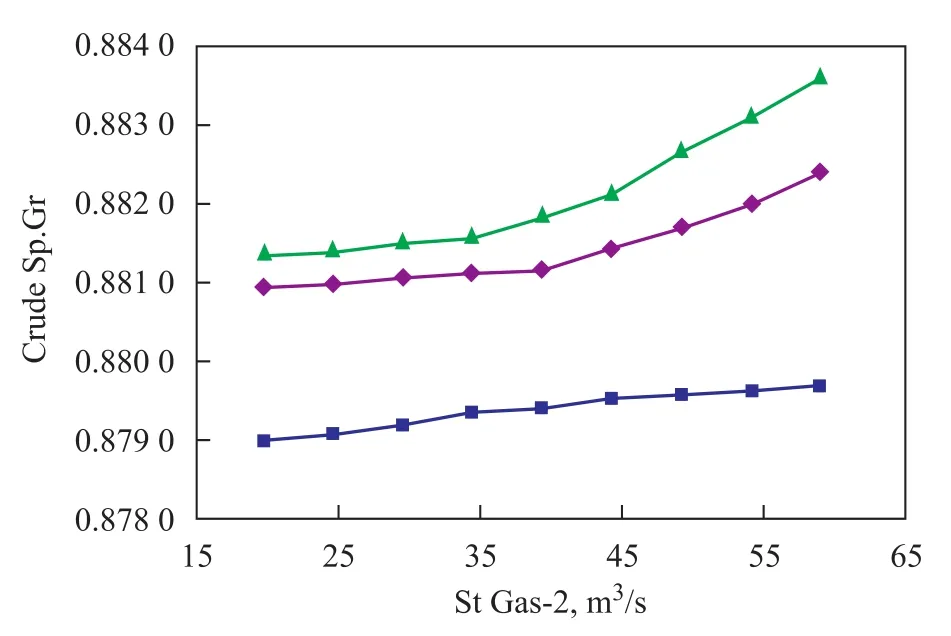
Figure 9 Effect of sweet gas rate on specific gravity of crude
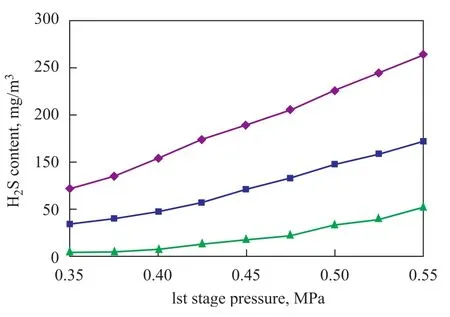
Figure 10 Effect of columns pressure on H2S content of crude
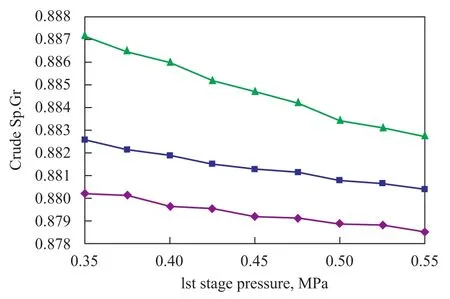
Figure 11 Effect of columns pressure on specific gravity of crude
The actual points are experimental data that are obtained from sampling at the plant and have been improved with the simulation software (HYSYS) and compared with results of main software (MATLAB) outputs. Since theplant is too sensitive to changes, it is not allowed to change the system at any wanted point for each analysis. Other points have been obtained using the HYSYS software in compliance with trays efficiency regulations so that the human errors arising from laboratory work have been reduced. In the MATLAB software, trays have been considered as ideal with no efficiency defined and the difference between the simulation results and actual ones is related with this fact, but the trends of behavior coincide with the reality.
3.2.2 Stripper columns optimization
Upon analyzing the processing parameters, it is possible to produce oil with higher quality by optimizing the sweet gas injection rates and pressures in stripping columns. The results are demonstrated in Table 2.
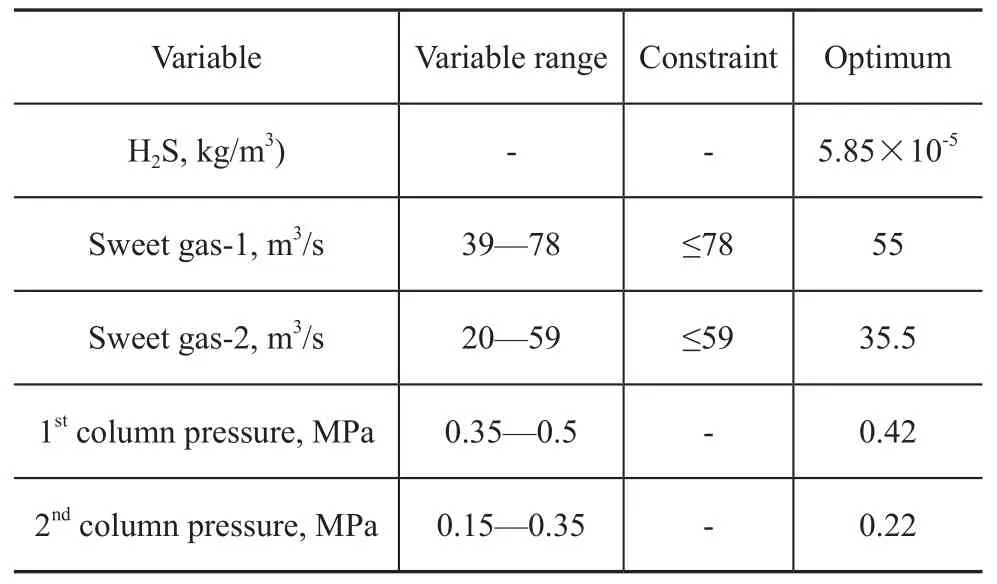
Table 2 Results of optimized columns of BAHREGANSAR
The data listed in Table 2 have revealed that the content of H2S can reach an optimal value of 5.85×10⁻⁵kg/m3under the following conditions: a first stage column pressure of 0.42 MPa coupled with a sweet gas injection rate of 55 m3/s, and a second stage column pressure of 0.22 MPa coupled with a sweet gas injection rate of 35.5 m3/s.
3.2.3 Process and control system modification
With a relatively simple extra-work on process technology and instrumentation, it is possible to divert a part of sweet crude through a 4-inch pipeline and a flow control valve to the main inlet of sour crude separator. The flow control valve enables the operators to regulate the sweet crude flow rate to meet different processing and production needs.
Figure 12 shows the effect of sweet crude injection rate on final H2S content in the product. The gradual increase of sweet crude flow has been implemented at optimum processing conditions as referred to in Section 3.2.2.
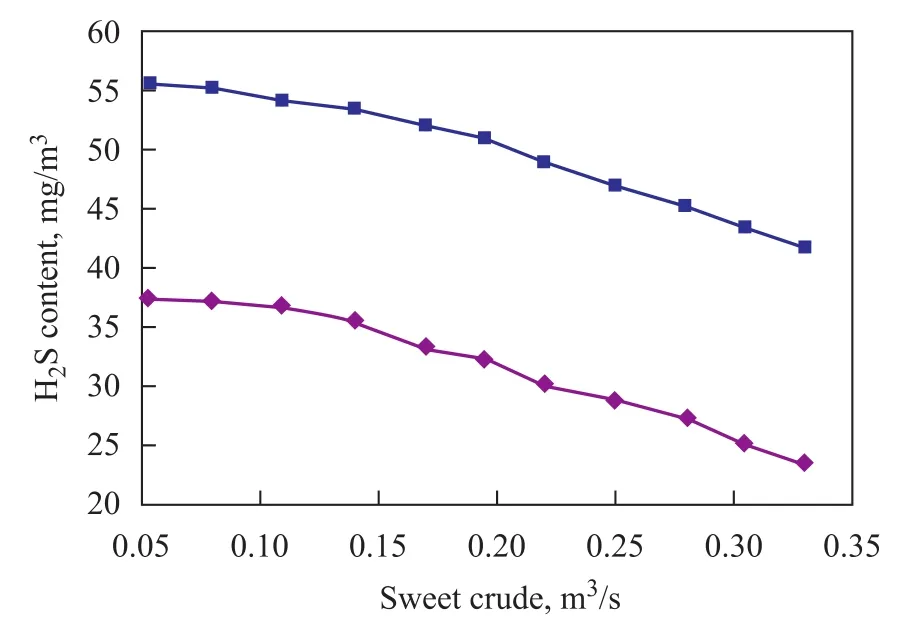
Figure 12 Effect of sweet crude on H2S content of product crude
As shown in Figure 12, the H2S content in the product crude has been decreased finally. It is possible to add more sweet crude to the sour crude inlet by this approach in case of some processing challenges such as carry-over in columns and booster pump operating troubles. Under the same condition the H2S content can be further decreased to 4.1×10⁻⁵kg/m3as a reasonable finding of this modification.
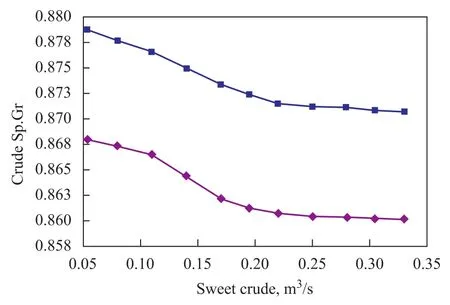
Figure 13 Effect of sweet crude on specific gravity of product crude
Figure 13 verifies the effect of sweet crude oil blending on the quality of final product. The specific gravity of crude oil has been decreased from 0.882 to 0.871 and flow rate at the outlet of the second stage stripper column has been increased from the previous level of 3 m3/s to 3.3 m3/s.
4 Conclusions
1) Modeling in static state helps us to estimate the num-ber of trays needed for cold stripping column as a rule of thumb to determine the economic and technical aspects of design.
2) By increasing the overflow ratio, the response time to achieve the new stable state increases and in some conditions returning to the stable state is impossible.
3) The H2S content of crude oil decreases with an increase of sweet gas rate injected into columns but the quality of crude decreases vice versa. The H2S content of crude increases and its quality improves with an increasing columns pressure.
4) In the case study, it has been established that the optimum sweet gas injection rate should be 55 m3/s for the first stage column and 35.5 m3/s for the second one, with 3.5 m3/s of sour crude oil flowing to the first stage stripper. The optimum pressure is 0.42 MPa for the first stage stripper and 0.22 MPa for the second stage stripper. These conditions can result in the treated sour crude with a specific gravity of 0.882 and a H2S content of 5.85×10⁻⁵kg/m3which is routed to onshore facilities for further processing.
5) The sweet crude oil injection at the separator inlet is a very interesting modification to achieve transmission of more treated crude oil with premium quality. This approach is simple, functional and effective and has no serious side effects on the downstream processes. It is possible for operators to control the plant at emergency cases which need to increase the pressure of columns or to decrease the stripping gas without any significant changes on quality of the target product.
Nomenclature
A—Mass transfer area;
C—Total concentration;
m—Slope of equilibrium curve;
V—Volume of liquid equilibrium;
W—Weir length;
x—Mole fraction in liquid bulk;
y—Mole fraction in gas bulk;
r—Density;
τ— Response time.
[1] Manning F S, Thompson Richard E. Oilfield Processing, Volume One: Natural Gas[M]. Pennwell Publishing Co., 1991
[2] Rabbani A R. Hydrogen Sulfide and Sour Oil and Gas Fields[M]. Amirkabir University of Technology Publication, 2010
[3] Manning F S, Thompson Richard E. Oilfield Processing, Volume Two: Crude Oil. Pennwell Publishing Co., 1995
[4] Shipster T R. Partial removal of H2S from crude oil by stripping with natural gas[R]. IP Review 1965, 393
[5] Clanton C W, Gipson R E. Sweetening of sour crude using gas stripping process [R]. SPE, 1969, 2599
[6] Allen R F, Smith S J, Walker G J. Offshore crude sweetening by gas stripping [R]. SPE, 1987, 16533/1-11
[7] Lakashmanan C C, Potter O E. Dynamic simulation of packed and tray- type absorbers [J]. Ind Eng Chem Res, 1989, 28: 1397-1405
[8] van Loo S, van ElK E P, Versteeg G F. The removal of solutions of methyl–diethanol-amine [J]. Journal of Petroleum Science and Engineering, 2007, 55: 135-145.
[9] Seader J D. The rate-based approach for modeling staged separation [J]. Chem Eng Prog, 1989, 85: 41-49
[10] Skelland A H P. Diffusional Mass Transfer[M]. John Wiley & Sons, 1974
[11] Handerton F M. Open Channel Flow[M]. New York: Macmillan, 1966,
[12] Pourkarimi S, Hallajisani A, Majidian N, et al. A novel dynamic model and simulation of gas sweetening in tray beds [J]. International Journal of Modeling and Optimization, 2011, 4(1): 269-274
[13] American Institute of Chemical Engineers. Bubble-tray Design Manual[M]. New York, 1958
[14] Bolles W L. Design of Equilibrium Stage Processes[M]. McGraw-Hill Book Companies, 1963
[15] Treybal R E. Mass Transfer Operations[M], 3rdedition. McGraw-Hill Book Companies, 1980
Recieved date: 2012-11-14; Accepted date: 2012-12-26.
Kaveh Hezaveh Hesarmaskan, E-mail: k.hezaveh@aut.ac.ir.

- 中国炼油与石油化工的其它文章
- Alumina Supported Vanadium Oxide Catalysts for Residue Hydrotreating
- Highlights on Planned Grassroots Styrene Units and Expansion of Existing Styrene Units in China
- Hydrocarbon Composition of Different VGO Feedstocks and Its Correlation with FCC Product Distribution
- Purification of Crude Glycerol from Waste Cooking Oil Based Biodiesel Production by Orthogonal Test Method
- Degradation of Nitrobenzene-Containing Wastewater with O3and H2O2by High Gravity Technology
- Et3NHCl-AlCl3Ionic Liquids as Catalyst for Alkylation of Toluene with 2-Chloro-2-methylpropane