
Scatter factor confidence interval estimate of least square maximum entropy quantile function for small samples
2016-11-24 02:24WuFuxianWenWeidong
CHINESE JOURNAL OF AERONAUTICS 2016年5期
Wu Fuxian,Wen Weidong,*
aJiangsu Province Key Laboratory of Aerospace Power System,College of Energy and Power Engineering,Nanjing University of Aeronautics and Astronautics,Nanjing 210016,China
bState Key Laboratory of Mechanics and Control of Mechanical Structures,Nanjing University of Aeronautics and Astronautics,Nanjing 210016,China
Scatter factor confidence interval estimate of least square maximum entropy quantile function for small samples
Wu Fuxiana,b,Wen Weidonga,b,*
aJiangsu Province Key Laboratory of Aerospace Power System,College of Energy and Power Engineering,Nanjing University of Aeronautics and Astronautics,Nanjing 210016,China
bState Key Laboratory of Mechanics and Control of Mechanical Structures,Nanjing University of Aeronautics and Astronautics,Nanjing 210016,China
Classic maximum entropy quantile function method (CMEQFM) based on the probability weighted moments (PWMs) can accurately estimate the quantile function of random variable on small samples,but inaccurately on the very small samples.To overcome this weakness,least square maximum entropy quantile function method (LSMEQFM) and that with constraint condition (LSMEQFMCC) are proposed.To improve the confidence level of quantile function estimation,scatter factor method is combined with maximum entropy method to estimate the confidence interval of quantile function.From the comparisons of these methods about two common probability distributions and one engineering application,it is showed that CMEQFM can estimate the quantile function accurately on the small samples but inaccurately on the very small samples(10 samples);LSMEQFM and LSMEQFMCC can be successfully applied to the very small samples;with consideration of the constraint condition on quantile function,LSMEQFMCC is more stable and computationally accurate than LSMEQFM;scatter factor confidence interval estimation method based on LSMEQFM or LSMEQFMCC has good estimation accuracy on the confidence interval of quantile function,and that based on LSMEQFMCC is the most stable and accurate method on the very small samples(10 samples).
1.Introduction
The estimation of quantile function to test samples is commonly encountered in the reliability analysis of engineering system(such as aviation product properties).In traditional methods of statistical inference,the steps for quantile function estimation involve fitting an analytical probability distribution that is judged empirically from the available sample data,and the n distribution parameters are suitably estimated using methods such as maximum likelihood method or least square method.However the bias and efficiency of quantile function estimate remain sensitive to the type of assumed distribution.
An alternative approach for the distribution fitting comes from the modern information theory in which a robust measure of probabilistic information,the entropy,has been developed.The maximum entropy principle is presented as a rational approach for choosing the least biased probability distribution among all possible distributions which are consistent with available sample data and contain the minimum amount of spurious information.In Refs.1,2,the maximum entropy is used to characterize a large number of discrete and continuous distributions under certain constraints.In Refs.3–6,the maximum entropy is applied in the engineering problems,and compared with the common probability distributions.In Refs.7,8,the maximum entropy is also applied in the climate science to estimate the probability distribution of rainfall amount,temperature and emissivity.There are also some researches to improve the performance of maximum entropy.Maximum entropy is combined with adaptive importance sampling for modeling different kinds of loss distributions.9The maximum entropy method is incorporated into Bayesian probability theory to estimate the distribution of intensity of weighted image.10The minimum Kullback entropy rather than the maximum entropy is used in the derivation of exponential distribution with given mean and variance.11The maximum entropy method is combined with bootstrap method to resolve the problem about parameter estimation under the condition that the number of test times is small while at every test time,the number of test data is large.12The maximum entropy method is combined with the Monte Carlo simulation to estimate the dam overtopping probability.13
However,the estimates of higher order moments(ordergt;2)from small samples(size less than 30)tend to have large sampling errors.The maximum entropy distribution derived from poor moment estimates would lead to inaccurate quantile values.14–16This difficulty can be circumvented by using the probability weighted moments (PWMs) in place of ordinary moments.The PWMs are firstly introduced by Greenwood and Landwehr17The PWMs can be viewed as the expectations of order statistics and moments of the quantile function of any nonnegative random variable.In contrast with ordinary moments,PWMs are less sensitive to the effects of sampling variability.Also higher order PWMs can be accurately estimated from small samples,because the y are linear combinations of the observed sample values.18PWMs shows the potential to provide a robust solution to characterizing the statistical nature of the underlying distributions especially for small samples.For this reason,PWMs have been extended to a variety of field of science and engineering.19–21But there will be some sampling errors on the very small samples(size less than 10),which can be verified in Section 4.
Because of expensiveness of aviation product and high test cost,the test is conducted only on the small samples.There will be some errors between the estimated quantile function and theoretical quantile function on the very small samples,so scatter factor method is introduced to estimate the confidence interval of quantile function,where there is assigned probability for including the theoretical quantile function.22The scatter factor is widely used to estimate the fatigue life of air plane and air engine components.23,24In Ref.25,life scatter factor method based on kth order experiment life with logarithm normal distribution is deduced.In Refs.26–28,the scatter factor formula is deduced for common probability distributions and has a good application in the aviation product.But there is a weakness that probability distribution type and distribution parameters of the random variable must be determined before it is used.
In this paper,to overcome the low accuracy of classic maximum entropy quantile function method (CMEQFM) on the very small samples,least square maximum entropy quantile function method (LSMEQFM) and that with constraint condition (LSMEQFMCC) are proposed.To improve the confidence level of quantile function estimate,scatter factor method is introduced.The results show that LSMEQFMCC is the most stable and accurate method for quantile function estimate on the very small samples.
2.Maximum entropy quantile function methods
2.1.CMEQFM
For a continuous random variable X,with the quantile function x(u)where u(x)=P(X≤x)is the cumulative distribution function (CDF) and 0≤u(x)≤1,the classic maximum entropy of quantile function x(u)is defined as12,14,16,20,21,29

where S is the entropy of quantile function x(u);bjis the one form of PWMs;m is the highest order of PWMs considered in the analysis.
From an ordered random sample of X with size n(x1≤x2≤...≤xn),bjcan be obtained as

To account for constraints Eq.(2),the entropy function is augmented as

where λjdenotes an unknown Lagrangian multiplier.To derive the quantile function,the entropy is maximized using the following condition

Substituting Eq.(3)into Eq.(4)with subsequent simplification leads to quantile function as


The m Lagrangian multiplierscan be obtained by solving the following unconstrained optimization problem
After Lagrangian multipliersare determined,we can estimate the quantile value for cumulative distribution probability with Eq.(5).
It will be showed that CMEQFM can estimate the quantile function accurately from small samples but inaccurately from very small samples.LSMEQFM and LSMEQFMCC introduced below are proposed to overcome this problem.
2.2.LSMEQFM
As shown in Section 4,Eq.(5)can be accurate when Lagrangian multipliersare set to be appropriate values.The estimated accuracy of Lagrangian multipliers based on the CMEQFM is affected greatly by the number of the samples.The quantile function based on the CMEQFM is inaccurate when the samples are very small.To overcome this problem,LSMEQFM is proposed here.
Eq.(5)can be re-derived as

From Eq.(8)we can define that uiis the cumulative distribution probability for xi,which is the ith-order statistics(x1≤x2≤...≤xn).And uican be determined by a suitable formula based on the middle rank method,30such as


where

Then substituting Lagrangian multipliersinto Eq.(5),we can estimate the quantile value for cumulative distribution probability.But it will be found that the cumulative distribution probability is not the monotonic function of the quantile value in some cases.To overcome this problem,constraint conditions are introduced when least square optimization problem is solved.
The derivative of quantile value about cumulative distribution probability can be written as


The slopes of the quantile function at the tail are written as

where x′(umin)is the slope of quantile function at umin=0.001 with x′(umin)gt;tanβ,and x′(umax)is the slope of quantile function at umax=0.999 with x′(umax)gt;tanβ.Let β =80°here.Thus Lagrangian multiplierscan be obtained by solving the least square optimization problem shown in Eq.(10),and Eq.(10)is subjected to the following constraints:

where r is the number of the ukwhich is obtained uniformly from[umin,umax].
3.Confidence interval estimate of least square maximum entropy quantile function (LSMEQF)
3.1.Scatter factor method
If X is a continuous random variable,with the order statistics(X(1)≤ X(2)≤ ...≤ X(n)),scatter factor SF(α,γ,u)can be defined

where SF(α,γ,u)can be denoted as minimum order statistic scatter factor and maximum order statistic scatter factor when α=1 and α=n,respectively;Xuis the quantile value of random variable X with cumulative distribution probability u.The item X(α)γcould be given by

If F(x)is the cumulative distribution function of random variable X,the cumulative distribution function FX(1)(x)of the minimum order statistic can be expressed as33

The cumulative distribution function FX(n)(x)of the maximum order statistic can be expressed as33

When cumulative distribution function of random variable X is known,the scatter factor SF(α,γ,u)can be obtained from Eqs.(16)–(19).
Under γ confidence level,estimated quantile value~Xuof random variable X for cumulative distribution probability u can be written as

where x(α)is the minimum test value and maximum test value when α =1 and α =n,respectively(x(1)≤ x(2)≤ ...≤ x(n)).
3.2.Scatter factor confidence interval estimate of LSMEQF
From Eq.(20),quantile value of a random variable X for cumulative distribution probability u can be estimated when the test value x(α)and scatter factor SF(α,γ,u)are known.From Eqs.(16)–(19),SF(α,γ,u)can be obtained when the cumulative distribution function of random variable X must be known prior.
In fact,the cumulative distribution function of random variable X is usually unknown prior,and determined through probability distribution hypothesis,hypothesis testing,and parameter estimation.But the estimated accuracy of cumulative distribution function greatly depends on the type of assumed distribution.Furthermore,classic probability distribution type is not suitable for some problems.
To overcome the weakness mentioned above,LSMEQFM combined with scatter factor method is introduced,whose advantage is that quantile function of random variable can be determined without probability distribution hypothesis,hypothesis testing,or parameter estimation.
3.2.1.Scatter factor confidence interval estimate of LSMEQF based on minimum order statistic
If X is a continuous random variable,with the order statisticscan be denoted as minimum order statistic scatter factor,and the item X(1)γin Eq.(17)can be obtained as

Substituting Eq.(18)into Eq.(21),we can get the following relationship:

We think that LSMEQF Eq.(5)is sufficiently accurate and could take place of the theoretical quantile function of random variable X,and the n the X(1)γcould be obtained as


Then, for an ordered test sample of variable X(x(1)≤x(2)≤...≤x(n)),the quantile value estimatefor cumulative distribution probability u of the variable X,under γ confidence level,can be written as

3.2.2.Scatter factor confidence interval estimate of LSMEQF based on maximum order statistic
If X is a continuous random variable,with the order statisticscan be denoted as maximum order statistic scatter factor,and the item X(n)γin Eq.(17)can be obtained as

Substituting Eq.(19)into Eq.(26),we can get the following relationship:

Similarly,we think that LSMEQF Eq.(5)is sufficiently accurate and could take place of the theoretical quantile function of random variable X,and the n X(n)γcould be obtained as


Then,for an ordered testsample of variable X(x(1)≤x(2)≤...≤x(n)),the quantile value estimatefor cumulative distribution probability u of the variable X,under γ confidence level,can be written as

4.Results and discussions
4.1.Comparison of computational accuracy among CMEQFM,LSMEQFM and LSMEQFMCC
CMEQFM,LSMEQFM and LSMEQFMCC are compared by estimating the quantile function of common random variable X1and X2,which obey lognormal distribution and Weibull distribution,respectively.(It can be verified that normal distribution and exponential distribution have the same results as the lognormal distribution and Weibull distribution).
We assume that X1obeys the lognormal distribution lg N(0,0.3)which means that the lognormal expected value is 0,and the lognormal standard deviation is 0.3;X2obeys the Weibull distribution W(2,2,0.5)which means that the shape parameter is 2,location parameter is 2,and scale parameter is 0.5.
There are three different kinds of simulation numbers to show the comparisons of computational accuracy among CMEQFM,LSMEQFM and LSMEQFMCC.The root mean square error (RMSE) is used to measure the computational accuracy of CMEQFM,LSMEQFM,and LSMEQFMCC.RMSE can be defined as

Monte Carlo method is used to produce the 10000,20,and 10 samples,and the quantile functions of random variable X1and X2are estimated by the CMEQFM,LSMEQFM and LSMEQFMCC with 6-order Lagrangian multipliers.The comparisons among the theoretical CDF curve (CDF,is the inverse function of quantile function),CMEQFM CDF curve,LSMEQFM CDF curve and LSMEQFMCC CDF curve are showed in Figs.1 and 2.The RMSE of CMEQFM,LSMEQFM and LSMEQFMCC are showed in Tables 1 and 2.
According to Figs.1 and 2 and Tables 1 and 2,it is showed that the order of computational accuracy from high to low is LSMEQFMCC,LSMEQFM and CMEQFM.
Figs.1(a)and 2(a)and Tables 1 and 2 show that the LSMEQFMCC,LSMEQFM and CMEQFM have the similarly good precision in CDF curvefitting when the simulation samples are large(about 10000 samples).
Figs.1(b)and 2(b)and Tables 1 and 2 show that the computational accuracy of three methods declines,when the number of simulation samples becomes smaller.The CMEQFM CDF curves of X1and X2are little away from the theoreticalCDF curve,especially at the tail of the curves.Also there are some errors at the tail of the LSMEQFM CDF curves.It is showed that CMEQFM makes few errors with the middlesize samples(about 20 samples)and so does the LSMEQFM in some cases.

Table 1 RMSE of three methods based on different samples of X1.

Fig.1 Comparisons of computational accuracy among different methods based on different samples of X1when sample value following lognormal distribution.
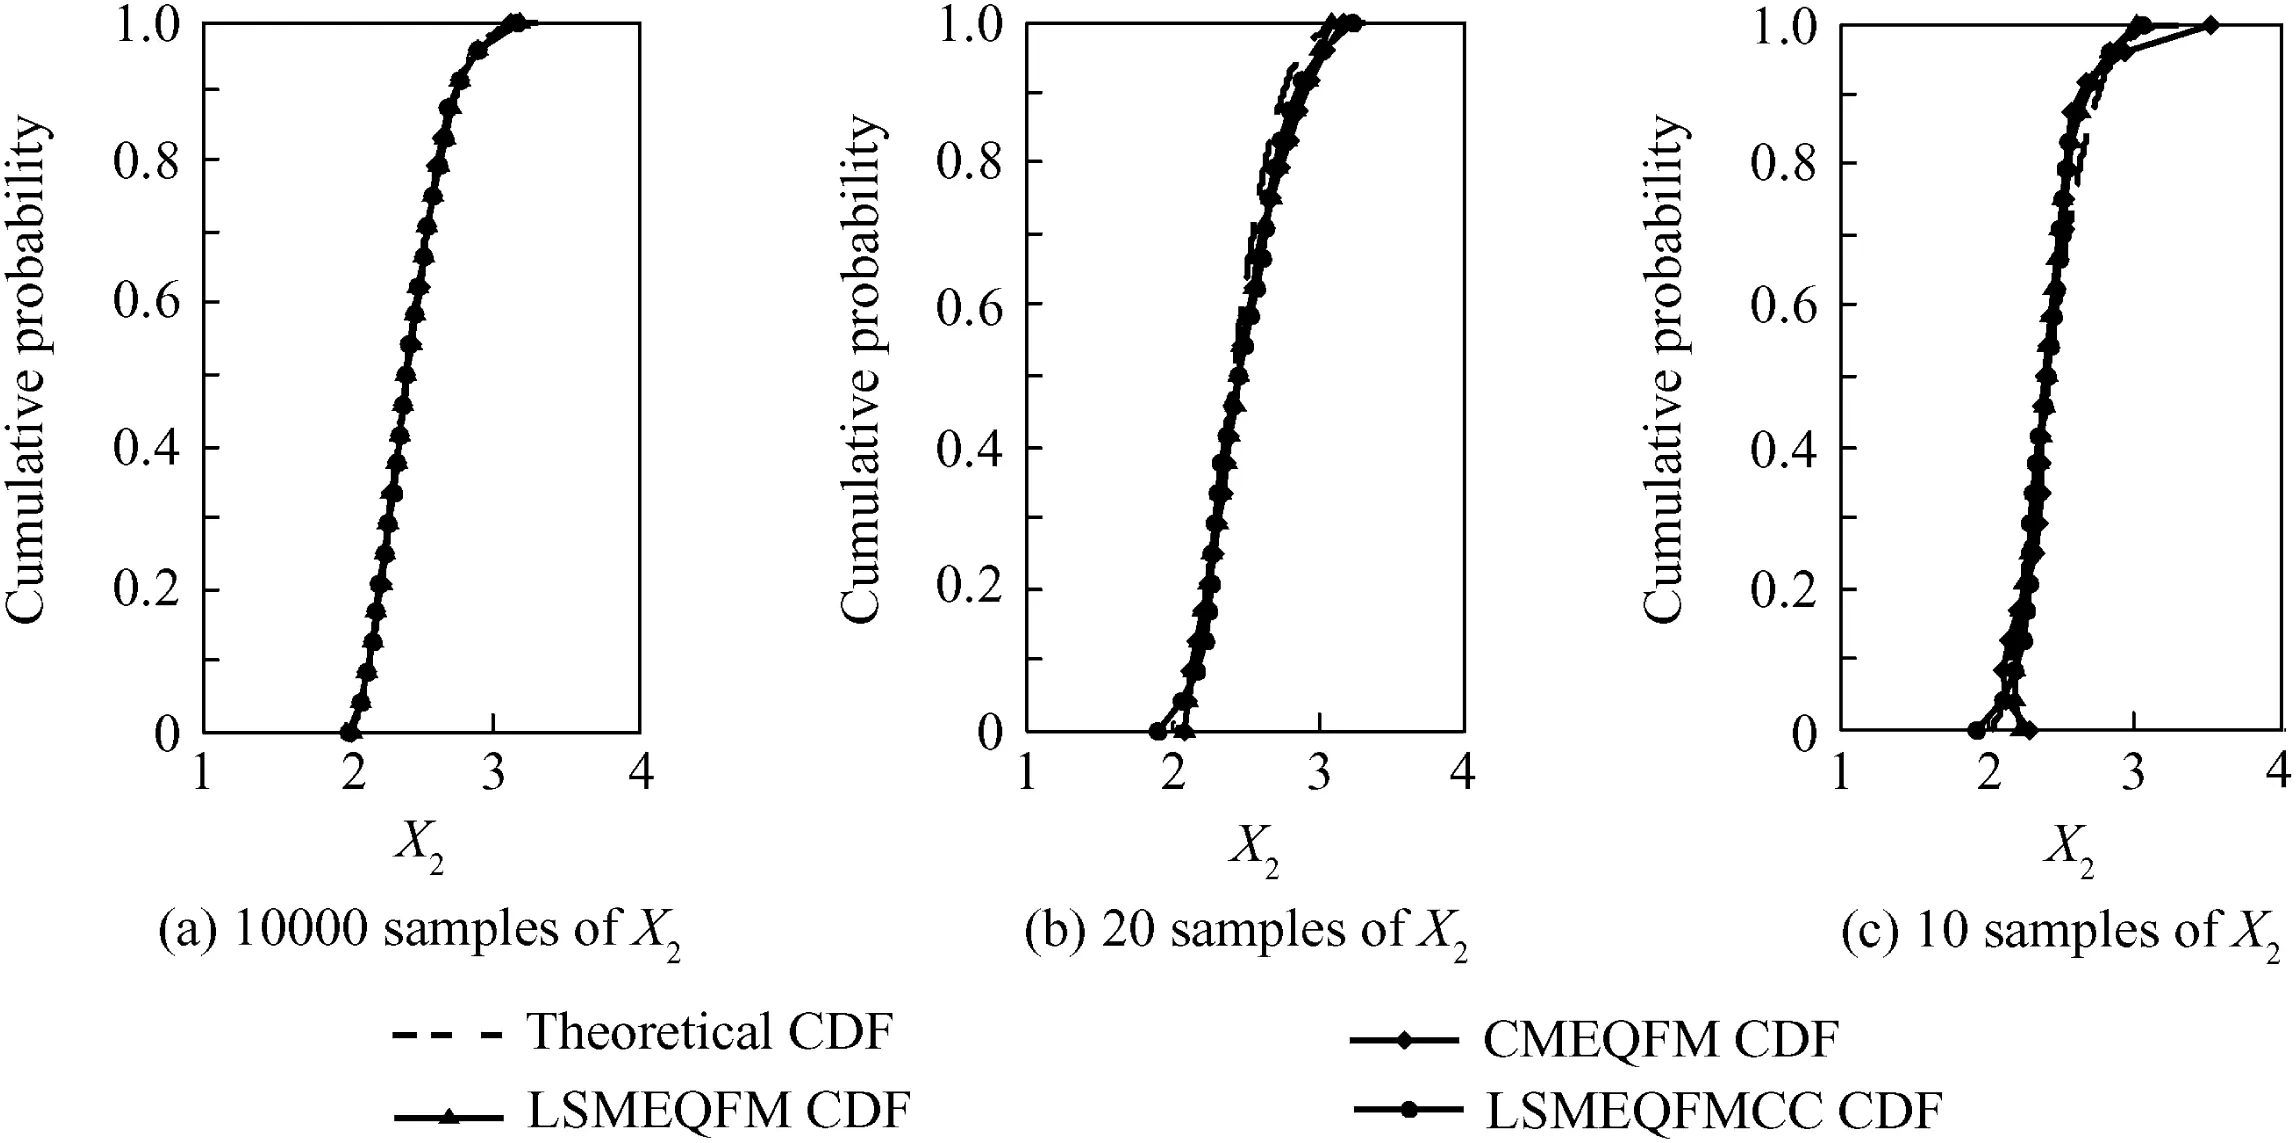
Fig.2 Comparisons of computational accuracy among different methods based on different samples of X2when sample value following Weibull distribution.

Table 2 RMSE of three methods based on different samples of X2.
Figs.1(c)and 2(c)and Tables 1 and 2 show that the computational accuracy of three methods declines further,when the number of simulation samples becomes much smaller.The CMEQFM CDF curves are far away from the theoretical CDF curve at the tail of the curves.And the cumulative distribution probability at the tail of LSMEQFM CDF curves is not the monotonic function of sample value.It is showed that for the very small samples(about 10 samples),LSMEQFMCC,instead of CMEQFM and LSMEQFM,could get a good precision especially at the tail of the curve.
4.2.Confidence interval estimate of common probability distribution
From the above example,it can be found that there are some errors between the theoretical CDF curve and CMEQFM,LSMEQFM,LSMEQFMCC CDF curves when the simulation samples are very small.Confidence interval estimate of the quantile function needs to be introduced to improve the confidence level.
We assume that X1and X2obey lognormal distribution lg N(0,0.3)and Weibull distribution W(2,2,0.5),respectively.(It can be verified that normal distribution and exponential distribution have the same results as the lognormal distribution and Weibull distribution).
Monte Carlo method is used to produce the 10 samples of random variable X1and X2;the CMEQFM,LSMEQFM and LSMEQFMCC are combined with scatter factor method respectively to estimate the quantile functions and 95%confidence intervals.6-order Lagrangian multipliers are considered in the CMEQFM,LSMEQFM and LSMEQFMCC.
The theoretical CDF curve,middle rank method points,CMEQFM CDF curve,LSMEQFM CDF curve,LSMEQFMCC CDF curve and upper and lower bounds are showed in Figs.3 and 4.The percentage of the theoretical quantile points falling in the confidence interval (PTCI),confidence interval(CI)of quantile value at cumulative distribution probability (CDP)0.01,0.50 and 0.99,theoretical quantile value (TQV) at CDP 0.01,0.50 and 0.99,and width of the confidence interval (WCI),including flag(IFG,0 means that theoretical quantile value is not included in the confidence interval,and 1 means included)are showed in Tables 3 and 4.

Fig.3 Three methods' CDF curves and confidence interval curves based on 10 samples of X1when sample value following lognormal distribution.

Fig.4 Three methods' CDF curves and confidence interval curves based on 10 samples of X2when sample value following Weibull distribution.

Table 3 Comparisons of confidence interval parameters about random variable X1among three methods.

Table 4 Comparisons of confidence interval parameters about random variable X2among three methods.
According to the results of Figs.3 and 4 and Tables 3 and 4,we can learn that the suitable confidence interval estimate methods ordered from high to low are LSMEQFMCC,LSMEQFM and CMEQFM.
Figs.3(a)and 4(a)and Tables 3 and 4 show that CMEQFM is not suitable for the estimation of quantile function and confidence interval on the very small samples.Although the percentage of the theoretical quantile points falling in the confidence interval is high(98.5%for X1,100%for X2),the width of the confidence interval is the longest,and the CDP is not the monotonic function of the quantile value at the tail of CMEQFM CDF curve.
Figs.3(b)and 4(b)and Tables 3 and 4 show that LSMEQFM has a good estimation of the quantile function and confidence interval on the very small samples generally.The percentages of theoretical quantile points falling in the confidence interval are 95.86%for X1and 97.08%for X2,and the confidence interval width is smaller than that of CMEQFM.But there are some errors at the tail of the CDF curve.
Figs.3(c)and 4(c)and Tables 3 and 4 show that LSMEQFMCC is suitable for the estimation of the quantile function and confidence interval on the very small samples,and it is the method with the highest accuracy.There are 99.34%and 100%of the theoretical quantile points falling in the confidence interval of X1and X2,respectively.The confidence interval width of LSMEQFMCC is smaller than that of CMEQFM and similar with that of LSMEQFM.

Table 5 Fatigue life data of aluminium alloy specimens made of LY12CZ.34
4.3.Date processing of fatigue life
LY12CZ is a common material in the aviation industry.Some parts of the plane,which are made of LY12CZ,encounter fatigue failure within the serve life.In fact,fatigue life is scattered at the same stress,so we treat it as a random variable.A group of the fatigue life data of aluminum alloy specimens at 262.5 MPa stress is listed in Table 5.34
The CMEQFM,LSMEQFM and LSMEQFMCC are combined with scatter factor method respectively to estimate the quantile functions and 95%confidence intervals of the fatigue life.4-order Lagrangian multipliers are considered in the CMEQFM,LSMEQFM and LSMEQFMCC.
The middle rank method points,CMEQFM CDF curve,LSMEQFM CDF curve,LSMEQFMCC CDF curve and upper and lower bounds are showed in Fig.5.The percentage of the middle rank method points falling in the confidence interval (PMRMCI),confidence interval of quantile value(CI),and width of the confidence interval (WCI) at CDP 0.01,0.50 and 0.99 are showed in Table 6.
Fig.5 shows that the middle rank method points all fall in the confidence intervals,but there are some errors at the tail of the CMEQFM CDF curve and LSMEQFM CDF curve where the cumulative distribution probability is not the monotonic function of quantile value.With consideration of the con-straints on quantile function,LSMEQFMCC has a good estimation at the tail of the CDF curve.

Fig.5 Three methods' CDF curves and confidence interval curves for fatigue life.

Table 6 Comparisons of confidence interval parameters for fatigue life among three methods.
Table 6 shows that the percentages of the middle rank method points falling in the confidence interval of three methods are all 100%.But the width of the confidence interval for CMEQFM is the longest among three methods.The widths of confidence intervals for LSMEQFM and LSMEQFMCC are similar with each other.
It is concluded that LSMEQFMCC is the most suitable method to estimate the quantile function and confidence interval on the very small samples.It not only overcomes the monotonic problem at the tail of the CDF curve,but also has small confidence interval width where the middle rank method points all fall.
5.Conclusions
(1)CMEQFM can estimate the quantile function accurately on small samples but inaccurately on very small samples.To overcome this problem, LSMEQFM and LSMEQFMCC are proposed.It is showed that the y can be applied on the very small samples successfully.
(2)It is found that the cumulative distribution probability is not the monotonic function of the quantile value in some cases for LSMEQFM.To remedy this problem,LSMEQFMCC is proposed.It is showed that LSMEQFMCC can get the highest stability and computational accuracy among three methods on the very small samples.
(3)Scatter factor confidence interval estimate functions based on maximum entropy quantile function method are established to estimate the confidence interval of random variable.We can learn from the examples that the suitable confidence interval estimation methods ordered from high to low are LSMEQFMCC,LSMEQFM and CMEQFM;LSMEQFMCC is the most stable and accurate method on the very small samples.
1.Borzadaran G.Characterization of pearsonian and bilateral power series distribution via maximum entropies.Am Instit Phys 2001;568:145–50.
2.Kirlin RL,Reza AM.Maximum entropy estimation of the probability density function from the histogram using order statistic constraints.In:2013 IEEE international conference on acoustics,speech and signal processing (ICASSP);2013 May 26–31;Vancouver(BC).Piscataway(NJ):IEEE Press;2013.p.6407–10.
3.Zhang H,Yu Y,Liu Z.Study on the maximum entropy principle applied to the annual wind speed probability distribution:A case study for observations of intertidal zone anemometer towers of Rudong in East China Sea.Appl Energy 2014;114(SI):931–8.
4.Shi X,Teixeira AP,Zhang J,et al.Structural reliability analysis based on probabilistic response modelling using the maximum entropy method.Eng Struct 2014;70:106–16.
5.Ramirez P,Carta JA.The use of wind probability distributions derived from the maximum entropy principle in the analysis of wind energy.Energy Convers Manage 2006;47(15–16):2564–77.
6.Zhu HH,Zuo YL,Li XJ.Estimation of the fracture diameter distributions using the maximum entropy principle.Int J Rock Mech Min Sci 2014;72:127–37.
7.Barducci A,Guzzi D,Lastri C,et al.Emissivity and temperature assessment using a maximum entropy estimator:Structure and performance of the maxentes algorithm.IEEE Trans Geosci Remote Sens 2015;53(2):738–51.
8.Singh PV,Zhang L,Rahimi A.Probability distribution of rainfallrunoff using entropy theory.Trans Asabe 2012;55(5):1733–44.
9.Fletcher JD,Sawyer TE.A maximum entropy approach to loss distribution analysis.Entropy 2013;15(4):1100–17.
10.Bretthorst GL.The maximum entropy method of moments and Bayesian probability theory.In:AIP Conference Proceedings;2012 July 15–20;Garching,Germany.Melville(NY):AIP Publishing;2013.p.3–15.
11.Olivares S,Pairs MGA.About the probability distribution of a quantity with given mean and variance.Metrologia 2012;49(3):L14–6.
12.Zhang L,Xia XT,Wang ZY.Maximum entropy bootstrap method for parameter estimation.In:Seventh international symposium on instrumentation and control technology:Measurement theory and systems and aeronautical equipment;2008 October 10–13;Beijing,China.Bellinham (WA):SPIE;2008;p.301–7.
13.Li CQ,Wang W,Wang S.Maximum entropy Monte Carlo method for the evaluation of dam overtopping probability.Disaster Adv 2012;5(4):1143–7.
14.Deng J,Pandey MD,Xie WC.Maximum entropy principle and partial probability weighted moments. Am Instit Phys 2012;1443:190–7.
15.Yu LJ,Zhang XN.Maximum entropy models for mode split forecasting.In:IEEE/INFORMS international conference on service operations,logistics and informatics 2009;2009 July 22–24;Chicago(IL).Piscataway (NJ):IEEE Press;2009.p.609–13.
16.Yu LJ.A new calculation algorithm for quantile function with application to headway distribution.In:IEEE international conference on Service Operations and Logistics,and Informatics,2008;2008 Oct 12–15.Beijing,China;2008;Piscataway (NJ):IEEE Press;2008.p.452–6.
17.Greenwood JA,Landwehr JM.Probability weighted moments definition and relation to parameters of several distributions expressible in inverse form.Water Resour Res 1979;15:1049–54.
18.Pandey MD.Direct estimation of quantile functions using the maximum entropy principle.Struct Saf 2000;22(1):61–79.
19.Zhang M,Bai S.Probability weighted mixed moments method and its application to estimation parameters of pearson type-III distribution.Water Resour Power 2012;30(9):20–2.
20.Deng J,Pandey MD.Derivation of sample oriented quantile function using maximum entropy and self-determined probability weighted moments.Environmetrics 2010;21(2):113–32.
21.Deng J,Pandey MD.Using partial probability weighted moments and partial maximum entropy to estimate quantiles from censored samples.Probab Eng Mech 2009;24(3):407–17.
22.Xiong J,Shenoi RA,Gao Z.Small sample theory for reliability design.J Strain Anal Eng Des 2002;37(1):87–92.
23.He XF,Dong YM,Liu WT.Reliability analysis on fatigue life with separated structural and load spectrum scatters.Acta Aeronautica et Astronautica Sinica 2010;31(4):732–7[Chinese].
24.Zhang FZ.Fatigue scatter factor of flown aircrafts original life.Acta Aeronautica et Astronautica Sinica 2013;34(5):1108–13[Chinese].
25.Lu XY,Lu S.Life scatter factor method based on the kth order experimental life with logarithm normal distribution.J Aerosp Power 2006;21(4):738–40[Chinese].
26.Zhang YB,Fu HM,Wang ZH.Fatigue life scatter factor analysis for time truncated zero failure data based on Weibull distribution.J Aerosp Power 2012;27(4):795–800[Chinese].
27.Fu HM,Zhang YB.Life scatter factor of time truncated zero failure data subjected to normal distribution.J Aerosp Power 2011;26(8):1836–40[Chinese].
28.Ma X,Chen Q,Zhang Y.Life scatter factor of birnbaum-saunders distribution.J Aerosp Power 2015;30(2):392–6[Chinese].
29.Deng J,Pandey MD.Estimation of the maximum entropy quantile function using fractional probability weighted moments.Struct Saf 2008;30(4):307–19.
30.Haktanira T,Bozduman A.A study on sensitivity of the probability weighted moments method on the choice of the plotting position formula.J Hydrol 1995;168(1–4):265–81.
31.Zhang YB,Fu HM,Wang ZH.Fatigue life scatter factor analysis for time truncated zero failure data based on Weibull distribution.J Aerosp Power 2012;27(4):795–800[Chinese].
32.He XF,Liu WT.On scatter factors of fatigue life obeying different distributions.J Beijing Univ Aeronaut Astronaut 2002;28(1):47–9[Chinese].
33.Townsend JT,Colonius H.Variability of the max and min statistic:A theory of the quantile spread as a function of sample size.Psychometrika 2005;70(4):759–72.
34.Yuan XK,Lu ZZ,Yue ZF.Bootstrap confidence interval of quantile function estimation for small samples.Acta Aeronautica et Astronautica Sinica 2012;33(10):1842–9[Chinese].
Wu Fuxianis a Ph.D.student at College of Energy and Power Engineering,Nanjing University of Aeronautics and Astronautics.His main research interests are aircraft engine structural strength and vibration fatigue reliability.
Wen Weidongis a professor and Ph.D.supervisor in Nanjing University of Aeronautics and Astronautics.His main research interests are aviation power structure,strength and vibration.
22 December 2015;revised 28 March 2016;accepted 19 May 2016
Available online 27 August 2016
Confidence intervals;
Maximum entropy;
Quantilefunction;
Reliability;
Scatter factor;
Small samples
©2016 Production and hosting by Elsevier Ltd.on behalf of Chinese Society of Aeronautics and Astronautics.This is an open access article under the CC BY-NC-ND license(http://creativecommons.org/licenses/by-nc-nd/4.0/).
*Corresponding author.Tel.:+86 25 84892251.
E-mail addresses:wfxfjxy@163.com(F.Wu),gswwd@nuaa.edu.cn(W.Wen).
Peer review under responsibility of Editorial Committee of CJA.
 CHINESE JOURNAL OF AERONAUTICS2016年5期
- CHINESE JOURNAL OF AERONAUTICS的其它文章
- Flapping wing micro-aerial-vehicle:Kinematics,membranes,and flapping mechanisms of ornithopter and insect flight
- A new non-linear vortex lattice method:Applications to wing aerodynamic optimizations
- Experimental study of flow field distribution over a generic cranked double delta wing
- Streamwise-body-force-model for rapid simulation combining internal and external flow fields
- An artificial neural network approach for aerodynamic performance retention in airframe noise reduction design of a 3D swept wing model
- effects of wing locations on wing rock induced by forebody vortices