
Adsorption of Naphthenic Acids from Dewaxed Vacuum Gas Oil by Activated Clay: Kinetics, Equilibrium and Thermodynamic Studies
2017-05-09 15:37LiXiaohuiMaRuiHuangFenglinLiYan
中国炼油与石油化工 2017年1期
Li Xiaohui; Ma Rui; Huang Fenglin; Li Yan
(1. College of Chemistry and Chemical Engineering, Xi’an Shiyou University, Xi’an 710065; 2. College of Chemical Engineering, China University of Petroleum, Beijing 102249)
Adsorption of Naphthenic Acids from Dewaxed Vacuum Gas Oil by Activated Clay: Kinetics, Equilibrium and Thermodynamic Studies
Li Xiaohui1; Ma Rui2; Huang Fenglin1; Li Yan1
(1. College of Chemistry and Chemical Engineering, Xi’an Shiyou University, Xi’an 710065; 2. College of Chemical Engineering, China University of Petroleum, Beijing 102249)
This work was mainly concentrated on the removal of naphthenic acids (NAs) from dewaxed vacuum gas oil (VGO) by adsorption using a commercial grade activated clay (AC) adsorption during lube base oil refning. The NAs in dewaxed VGO cut-4 were identifed by negative-ion electrospray ionization Fourier transform ion cyclotron resonance mass spectrometry (ESI FT-ICR МS). The AC sample from a refnery was characterized by XRD, BET, TG/DTA, and SEМ. A series of experiments were carried out to investigate the performance of NAs adsorption by AC using a batch adsorption technique, in which some key experimental parameters such as temperature, contact time, initial concentration of NA in oil sample as well as the dosage of adsorbent were investigated. Equilibrium isotherms were analyzed using the Langmuir, Freundlich, Tempkin and Dubinin-Radushkevich (D-R) adsorption models. The pseudo-frst order, the pseudo-second order, and intraparticle diffusion models were employed to describe the kinetics data. The results revealed that the D-R isotherm provided a better ft to the experimental data than other isotherms, and the adsorption kinetics followed the pseudo-frst order kinetic equation. The thermodynamic data indicated that the adsorption process was feasible and spontaneous as an endothermic process. The results could provide a clear understanding of the NAs adsorption by AC during lube base oil processing at refneries.
naphthenic acids; dewaxed vacuum gas oil; adsorption; activated clay
1 Introduction
Nowadays the exploration and utilization of heavy and inferior crude oils are increasingly emphasized by many countries since the conventional oil reserves are depleting year by year due to the unavoidable fossil fuel scarcity, and these low grade crude oils may be a good choice for some refineries due to the relatively lower price of so called “opportunity crude oils”[1]. One of the most important characteristics of heavy and inferior crude oils is their high total acid number (TAN)[2]. The acids in crude oils and their distillates are mainly composed of naphthenic acids (NAs) that are regarded as the main contributor to TAN[3]. And NAs are responsible for liquid phase corrosion during oil transmission through pipelines and during refnery processing, and they are responsible for high acidity of oil products[1,3-4].
The vacuum gas oils (VGOs) delivered from vacuum distillation unit at the refinery conventionally should undergo furfural refining, acetone-benzol dewaxing and clay refining to produce base oils for formulating lubricants[5]. Clay refining as an extra refining process by means of activated clay (AC) adsorption is used to remove a small amount of undesirable components like resins, asphaltenes, NAs, extraction solvents, and other undesirable components, which have negative influence on the oxidation stability, TAN value, color, carbon residue (CR) value of base oil. In recent years, although the hydroprocessing technology as an efficient method for removing polar compounds in oil has been developing quickly all over the world, the clay refning process still cannot be totally replaced, and even some special oil products still have to rely on clay refning.
Clays as inexpensive and effcient adsorbents have beenwidely used in various aqueous solutions thanks to their availability in large quantity, good chemical and mechanical stability, excellent adsorption capacity and structural properties[6]. However, the adsorbents used to remove acids from the oil system are scarcely seen from literature reports, moreover, the detailed information about de-acidification in clay refining at refineries for treating lube base oil is still sparse. Therefore, the objective of the present work is to determine the ability of the AC to adsorb NAs from dewaxed VGO, and to examine the adsorption behaviors including kinetics, equilibrium and thermodynamics of adsorption.
2 Materials and Methods
2.1 Adsorbent, feedstock and chemical reagent
The AC used as the adsorbent, and the dewaxed VGO cut-4 serving as the base stock in this study were collected from the No. 3 refinery at the Yanshan Petrochemical Company of SINOPEC. The AC was directly used as an adsorbent without any further purification and modification. A stock solution of NA with different concentrations was prepared by dissolving cyclohexanecarboxylic acid (CA), which was obtained from the Aladdin Industrial Corporation of USA, in the dewaxed VGO cut-4 as the model oil.
2.2 Adsorbent characterization and naphthenic acids identifcation
The powder X-ray diffraction (XRD) patterns were collected in a Shimadzu XRD 6000 diffractometer ftted with a CuKα radiation source and operated at 40 kV and 10 mA. Data were recorded over a range of 5°—80° at a scanning rate of 4 (°)/min. The patterns were compared with the JCPDS reference data for phase identification. The Brunauer-Emmett-Teller (BET) specifc surface areas and pore size distribution for the sample was determined by nitrogen adsorption on an ASAP 2020 М equipment. The samples were previously degassed at 573 K under vacuum atmosphere for more than 12 h before adsorption isotherms were generated by purging nitrogen (at 77 K) on the catalysts. Thermogravimetric (TG) analyses and differential thermal analyses (DTA) were carried out in a STA 409 PC instrument made by the Netzsch GmbH of Germany, the analyses were carried out under argon gas at a flow rate of 2 mL/min and under heating at a temperature increase rate of 10oC/min. The SEМ images were captured on an FEI feld-emission scanning electron microscope (Quanta 200F) operated at an accelerating voltage of 30 kV.
The petroleum acids in dewaxed VGO cut-4 were characterized by a Bruker apex-ultra negative-ion electrospray ionization Fourier transform ion cyclotron resonance mass spectrometer (ESI FT-ICR МS). The sample preparation for ESI FT-ICR МS analysis, the experimental procedures as well as the data analysis were reported elsewhere[1].
2.3 Test method for total acid number (TAN)
The total acid number of oil samples was determined according to ASTМ D-664 method using a ZDJ-4A potentiometric titrator produced by a local Chinese company.
2.4 Batch adsorption study
In each batch experiment, a definite amount of oil sample of known TAN value (30 g) was added into a 50-mL three-necked round bottom flask equipped with a magnetic stirrer for agitation of the sample together with 0.3—2.7 g (mass ratio of adsorbent to oil of 1%—9%) of AC. Kinetic studies were performed at 373.15—418.15 K using an initial NA concentration of 1195, 729 and 405 mg/L, respectively. In each case, the oil in the fask was heated to the desired temperature, and then the AC was added into the fask and agitated by the magnetic stirrer at a set stirring speed. (Under this circumstance a blank experiment was initially completed to evaluate if the magnetic stirrer made by polymer could interfere with this procedure, and finally the result showed that there was no influence.) At different intervals of time, each flask was taken away from the heater, while the used AC was separated from oil sample by fltration, and then the TAN value was determined. The amount of adsorptionqt(mg/g) at timet, was calculated by the following equation[7]:

whereC0is the initial concentration of NA (mg/L),Ctis the NA concentration at a specifed timet(mg/L),Vis the volume of oil (mL), andmis the adsorbent mass (g).
2.4.1 Effect of activated clay dosage
Adsorption isotherm experiments were performed at 418.15 K using the oil sample with a NA concentration of 729 mg/L to examine the effect of AC dosage. And the dosage of AC varied from 8.86 g/L to 79.74 g/L (with a mass ratio of AC to oil ranging from 1% to 9%), and the contact time was 70 min.
2.4.2 Effect of temperature, contact time, and initial concentration of NA
The effect of temperature and contact time on the adsorption process was studied at a temperature range of 373.15 —418.15 K and a NA concentration of 1194 mg/L, 729 mg/L and 405 mg/L, respectively. And the amount of AC was fxed at 44.3 g/L (with a mass ratio of AC to oil equating to 5%).
2.5 Mathematical modeling
The NA adsorption isotherm experiments using AC as the adsorbent were conducted under a variety of conditions. The amount of adsorption at an equilibriumqe(mg/g) was calculated by means of the mass balance equation[7]:

whereC0andCeare the initial and equilibrium concentration of NA (mg/L), respectively,Vis the volume of oil (mL), andmis the adsorbent mass (g). The adsorption effciency (%) was calculated as follows:

2.5.1 Equilibrium modeling
The equilibrium adsorption isotherm is one of the most important data for understanding the adsorption mechanism. Among the available isotherm models, the Langmuir, Freundlich, Tempkin and Dubinin-Radushkevich (D-R) isotherms were employed in this work, with their equation forms, physical meanings, and scope of application referred to in the related technical literature and references[7-10].
In the present study, the Мarquardt’s percent standard deviation (MPSD) was applied to test the adequacy and appropriateness of the equilibrium isotherm models for representing the experimental data, with its error functions given as follows[6,10]:

whereqe,expandqe,calare the amount of NA adsorbed per unit mass of clay at equilibrium (mg/g) derived from the experiments and the calculation outcome by using the model, respectively. And in this equationnis the number of the data points, andpis the number of parameters in the isotherm equation.
2.5.2 Kinetics modeling
The objective of adsorption kinetics study is to investigate the possible mechanisms for the sorption process and to determine the time required to attain equilibrium. In the present work, the pseudo-frst-order and the pseudosecond-order kinetic models, and the intraparticle diffusion model, were employed to interpret the kinetics results, their equation forms, and the physical meanings, with the scope of application being available in many related technical literature and references[7-10].
2.5.3 Adsorption thermodynamics
Thermodynamic considerations of an adsorption process are necessary in order to conclude whether the process is spontaneous or not. The Gibbs free energy change is an important criterion for spontaneity. Both energy and entropy factors must be considered in order to determine the Gibbs free energy of the process[9]. Thermodynamic parameters such as the Gibbs free energy change (ΔG0), the enthalpy change (ΔH0) and the entropy change (ΔS0) can be estimated using equilibrium constants that vary with temperature.
3 Results and Discussion
3.1 Basic properties of feedstock and activated clayThe dewaxed VGO cut-4 used as the base stock was collected from the refinery, with their major properties listed in Table 1.The relationship between the viscosity and temperature is exhibited in Figure 1. The viscosity of the dewaxed oil decreased quickly in the temperature range of between 348.15 K-378.15 K, whereas this decreasing extent would slow down when the temperature increased continuously to represent the typical characteristics of a non-Newtonian fuid.
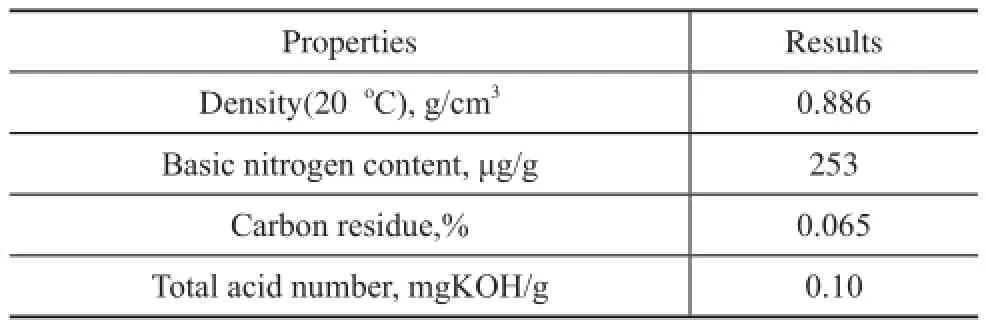
Table 1 Properties of the dewaxed VGO cut-4
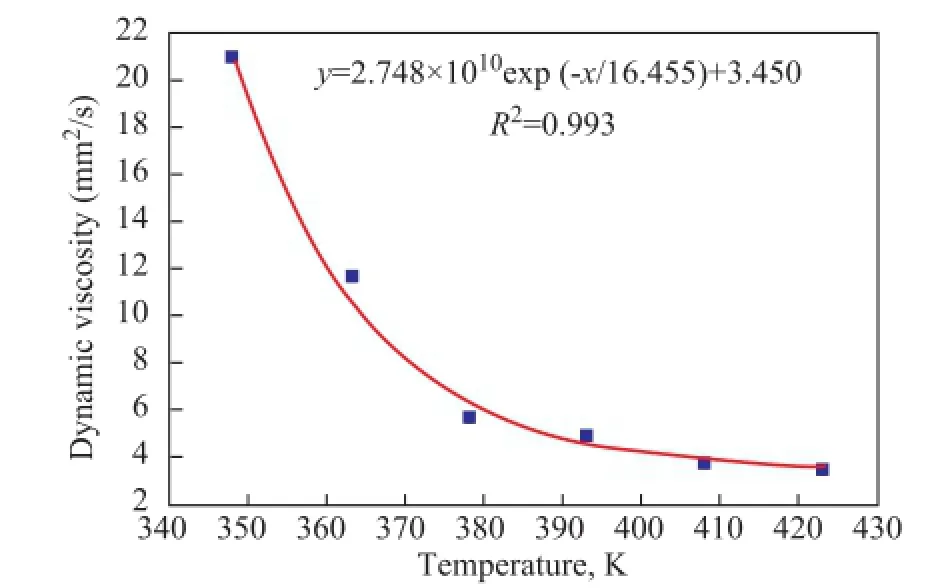
Figure 1 The relationship between dynamic viscosity and temperature of dewaxed VGO cut-4■—Experimental data; ——Non-linear ftting
Some basic properties of AC are listed in Table 2. The adsorbent with an initial moisture content of 15.1% was dried in a vacuum oven at 120oC for 1 hour prior to use, and the moisture content of the oven-dried AC was 9.2%.
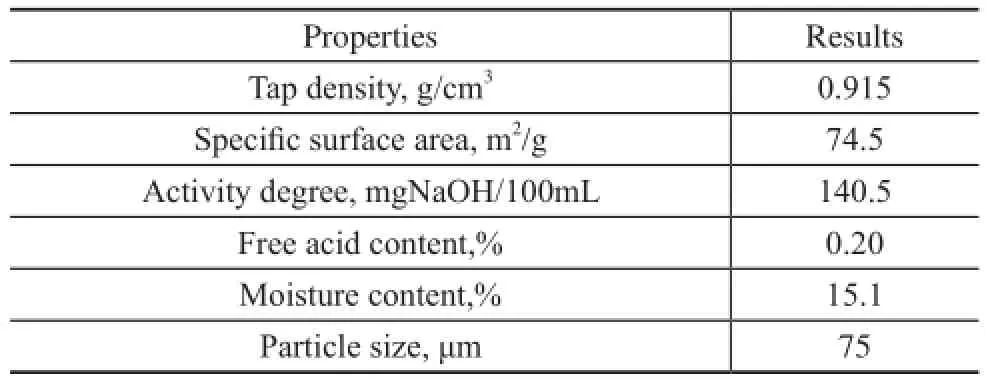
Table 2 Properties of the AC
3.2 Naphthenic acids identifcation
The broadband negative-ion electrospray FT-ICR MS of the identifed carboxylic acids is presented in Figure 2.

Figure 2 The molecular weight distribution of the identifed carboxylic acids in dewaxed VGO cut-4
The carbon number and double-bond equivalence (DBE) distribution obtained from data analysis are exhibited in Figure 3, showing that the identified petroleum acids included various NAs, fatty acids, and aromatic acids, among which the most abundant acids were the singlering NAs, followed by the double-ring NAs.
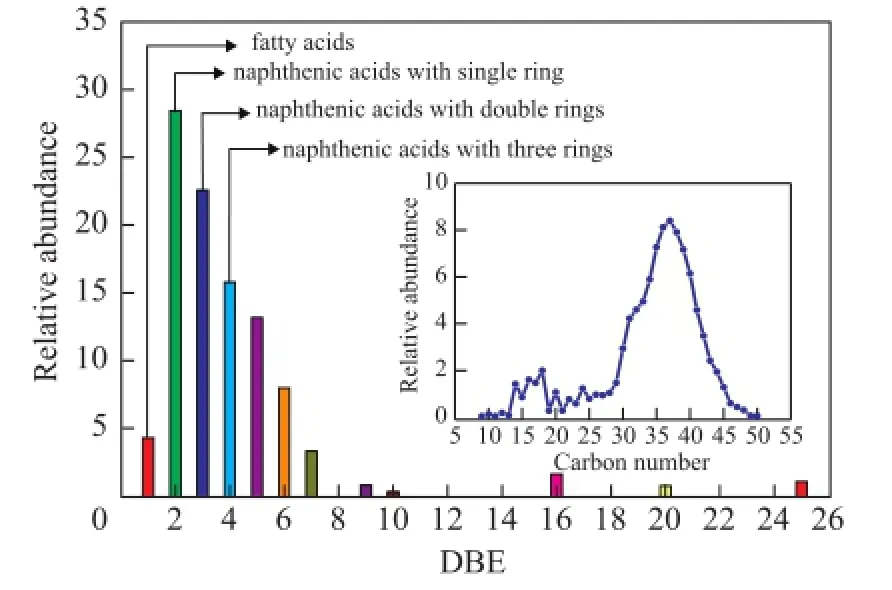
Figure 3 Plots of relative abundance as a function of DBE; and (inset) carbon number for acid species in dewaxed VGO cut-4
Oil samples with different TAN values were prepared by adding varying amount of cyclohexanecarboxylic acid (CA) into the dewaxed VGO cut-4. So the total concentration of acids in each prepared oil sample was the summation of the amount of inherent NAs in oil and the added CA, which was calculated according to the following equation:

where,MCA,MKOHdenote the molecular weight of CA and KOH, respectively,Voilis the volume of oil sample. One point should be clarified that the inherent NAs in oil was roughly treated as CA hypothetically by using equation (20) to convert TAN into NA concentration.
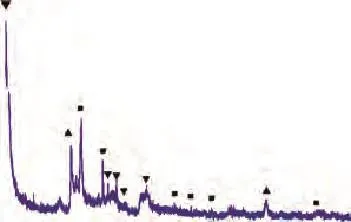
Figure 4 XRD patterns of AC■—Quartz;▲—Montmorillonite;▼—Illite
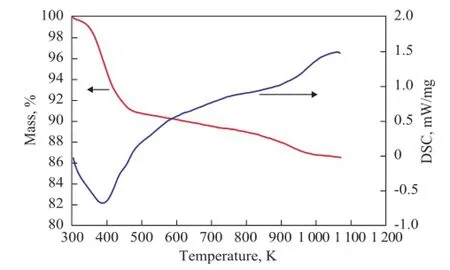
Figure 5 TG/DTA curves of AC
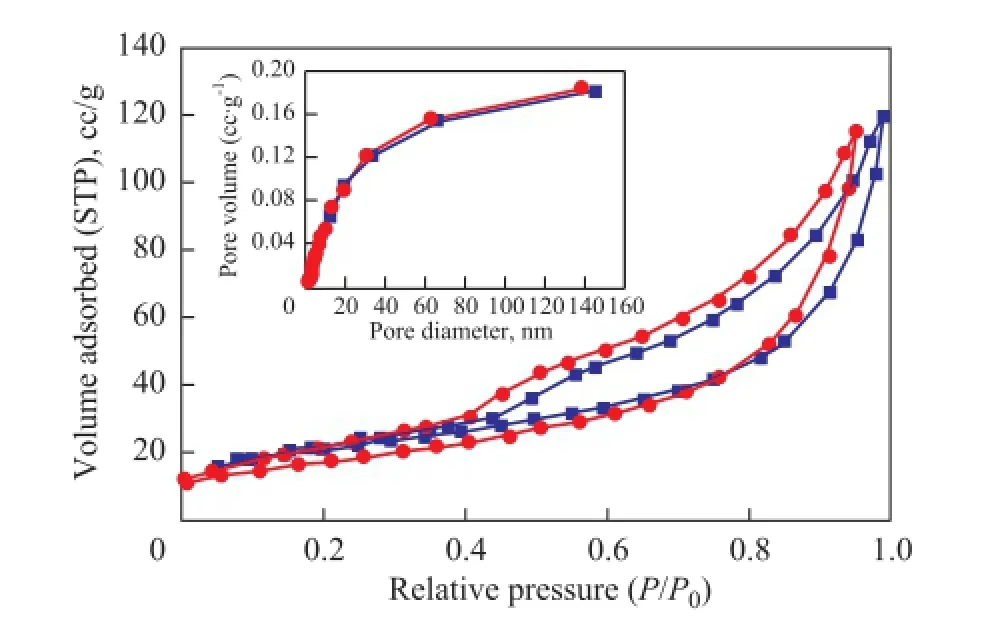
Figure 6 N2adsorption-desorption isotherm of AC; and (inset) corresponding pore size distribution■—Undried AC;●—Dried AC
According to equation (20), the NA concentration of the prepared oil samples with a TAN value of 0.59, 0.36 and 0.20 mgKOH/g, respectively, was correspondingly calculated to be equal to about 1195, 729 and 405 mg/L, respectively.

Figure 7 SEM analysis of AC: (a) fresh AC, (b) used AC
3.3 Activated clay characterization
Figure 4 displays the powder XRD patterns of the AC. Indexing of the XRD pattern showed that the quartz, montmorillonite, and illite phases were present in the clay sample. Figure 5 illustrates a weight loss curve as a function of temperature and the corresponding DTA curve of AC sample, which presents a continuous mass loss during heating within the test temperature range. The TG profile exhibited three distinct regions over the temperature range of between 303.15—473.15 K, 473.15—923.15 K and 923.15—1073.15 K, respectively, and the DTA curve exhibited an obvious endothermic peak at about 393.15 K accompanied by a weight loss of 4.02% of the total mass, which was related to the physical desorption of adsorbed water on the surface of AC.
Nitrogen adsorption-desorption isotherms of AC and its dried sample (dried at 393.15 K for 1 hour) are showed in Figure 6. A type IV isotherm according to the IUPAC classifcation was observed indicating to the mesoporous material being subject to strong adsorption-adsorption interaction[11]. This was in accordance with the pore size distribution of 2—20 nm belonging to mesopore, while no signifcant but a small change in the BET result for the two samples was observed (Table 3).
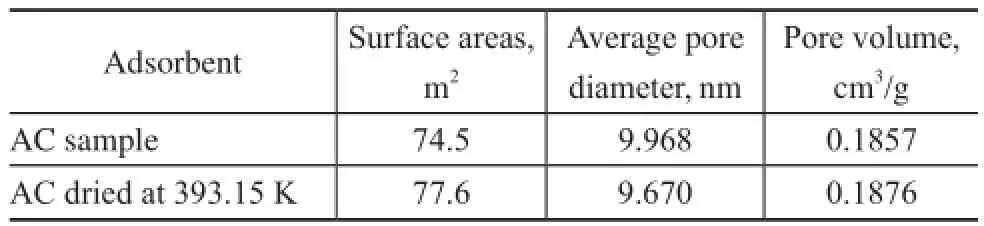
Table 3 BET data of AC samples before and after drying at 393.15 K
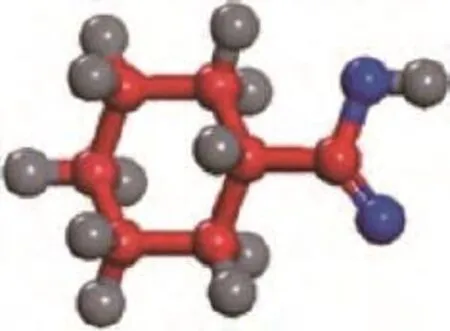
Figure 8 Orientation axis of the estimated molecule diameter of cyclohexane carboxylic acid
Figure 7 exhibits the SEM micrographs of fresh and used AC samples, showing that the fresh AC had a larger roughness of surface and more crystal fragments as compared to the used AC, since the polar nonhydrocarbon components in dewaxed oil including NAs were adsorbed onto the surface of AC, thus leading to a crystal aggregation of AC and pore channel blocking.
The molecular size of CA determined by employing the software Chemoffice, which is related to the molecule orientation presented in Figure 8, along with three model NAs reported by Silva, et al.[12]are also listed in Table 4 for comparison. It can be predicted from Table 4 and the above-mentioned BET results that the NAs in VGO can enter the pore channels of the AC.
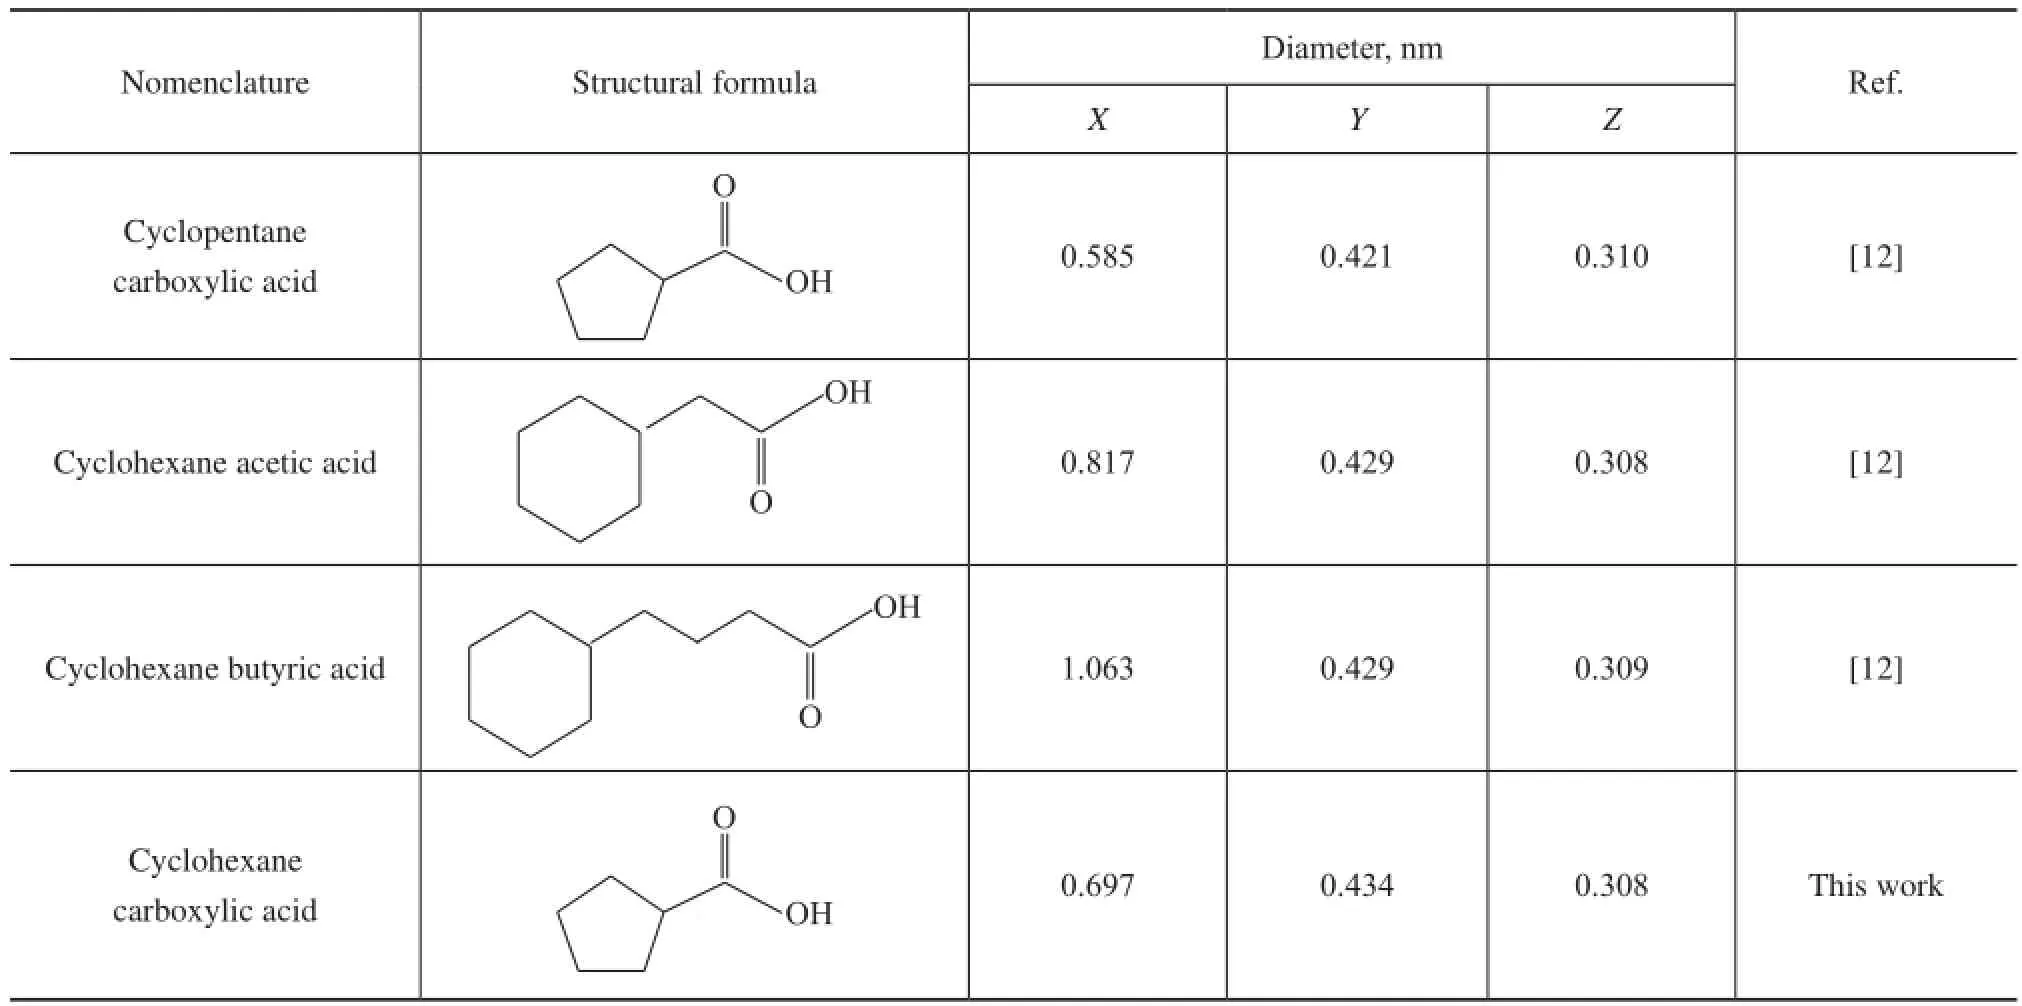
Table 4 Molecular size of NAs model compounds
3.4 Batch adsorption study
3.4.1 Effect of activated clay dosage
The adsorbent dosage is an important parameter because it determines the capacity of adsorbent for a given NAs concentration and also determines the sorbentsorbate equilibrium of the system. It can be seen from Figure 9 that upon increasing the AC dosage from 8.86 g/L to 79.74 g/L, the percentage of NAs removal was increased from 35.0% to 99.5%, and the adsorption capacity was decreased from 28.78 mg/g to 8.94 mg/g. The increased surface area where the adsorption took place by increasing the clay dosage was responsible for the enhancement of the adsorption efficiency[13], butcould decrease the adsorption amount due to the partial aggregation or overlapping of AC, which would result in a decrease in effective surface area for the adsorption[9]. A slow change in the removal percentage and the adsorption capacity could be observed beyond the dosage of 62.02 g/L. Similar result was also reported, denoting that after reaching a certain dosage the adsorption efficiency was not increased signifcantly[9,14].

Figure 9 Effect of clay dosage on adsorption of NA (NA concentration: 729mg/L, temperature: 418.15 K, time: 70 min)●—Removal, rate;■…qe
3.4.2 Effect of temperature
It can be observed from Figure 10 that the NAs uptake increased as the temperature increased in the range of 373.15—418.15 K, indicating that the adsorption is an endothermic process. The increase in adsorption with the rise of temperature may be ascribed to the mobility enhancement of the NAs in dewaxed VGO and the viscosity of the oil sample which was reduced with the increase of temperature, which could decrease the resistance of mass transfer and was favorable to the improvement of adsorption efficiency. Similar observations were also reported by Celekli, et al.[14], Мahmoodi, et al.[15], and Qi, et al.[16]on their relevant diversifed adsorption systems.
3.4.3 Effect of initial concentration of naphthenic acidWhen the NA concentration increased from 405 to 1195 mg/L, the NA uptake per unit weight of adsorbent increased from 9.05 mg/g to 26.75 mg/g at 418.15 K at which the adsorption rate was found to be the maximum, and a similar tendency also appeared at other temperatures (Figure 10). This phenomenon can be ascribed to the increase in the mass driving force which allows more NA molecules to transfer from the oil phase to the adsorbent surface. The initial NA concentration played an important role in the adsorption capacity of AC.
3.4.4 Effect of contact time
The NA removal efficiency by adsorption was rapid initially at the contact time in the range of 0—20 min, and after 20 min it became very slow until an equilibrium was attained (Figure 10). This typical feature of adsorption phenomenon was also reported by other researchers[7]. The high initial NA adsorption rate was achieved because a large number of adsorption sites were available for adsorption at the onset of the process. After a definite period of time, the repulsive forces between NA molecules on the solid and liquid phase were enhanced, leading to an increased difficulty for occupying the remaining vacant surface sites so that the adsorption process was slowed down in the later stage[17].
3.5 Adsorption equilibrium study

Figure 1 0Effect of contact time and temperature on adsorption of NA onto AC at an initial concentration of: (a) 1195 mg/L, (b) 729 mg/L, (c) 405 mg/L (with AC dosage of 44.3 g/L)■—418.15 K;●—403.15 K;▲—388.15 K;▼—373.15 K
Adsorption isotherms of NAs on AC were investigated ata temperature range of between 373.15—418.15 K and an initial acid concentration of 405 mg/L, 729 mg/L, and 1195 mg/L, respectively, with the adsorbed amountqebeing expressed as a function of equilibrium concentrationCe, as presented in Figure 11. The increasing temperature had a positive effect on the adsorption rate, which could be ascribed to the endothermicity of the diffusion process if the adsorption process is controlled by the diffusion rate (intra-particle transport-pore diffusion)[18]. It can also be found that at a low adsorbate concentration,qerose sharply, and at higher values ofCe, the increase inqewas gradual. The Langmuir, Freundlich, Temkin and Dubinin-Radushkevich (D-R) isotherms were also presented in Figure 11, and it can be found that the D-R isotherm fitted well with all the experimental data to achieve a high correlation coeffcient (R2= 0.938—0.996) as compared to other isotherms which exhibited poor ftting, so we only listed the adsorption parameters of D-R isotherm in Table 5 because the adsorption parameters of other isotherms obtained from non-linear ftting have a large deviation which cannot refect the appearance of the process. Judging from the data listed in Table 5, theqmvalue was found to be 30.641—35.720 mg/g in the temperature range from 373.15 K to 418.15 K.Several authors have reported isotherm constants for adsorption of acids on various adsorbents, although they have used different acids under different environmental conditions, however, it is still worthy of comparing these values from literature reports with the values obtained in the present work as shown in Table 6. Silva, et al.[12]upon studying a commercial clay adsorbent to remove carboxylic acid from model petroleum fractions, have found out that the BET isotherm was the most adequate model to represent the adsorption equilibrium, andqmwas 25.3 mg/g. The isotherm parameters differ widely for adsorbents with different origins, therefore, it should be cautious when these values are used to design the adsorption systems.
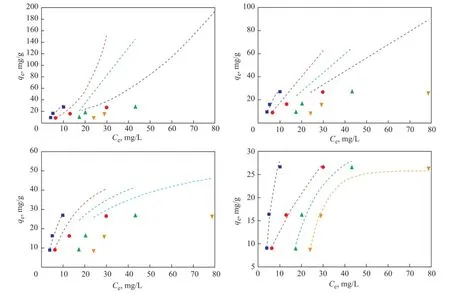
Figure 1 1Adsorption isotherms for NAs on AC at different temperatures (AC dosage: 44.3 g/L, NA concentration: 405, 729, and 1195 mg/L,t= 70 min)■—418.15 K;●—403.15 K;▲—388.15 K;▼—373.15 K

Table 5 The Dubinin-Radushkevich isotherm constants for the adsorption of NA onto AC at different temperatures (AC: 44.3 g/L, NA concentration: 1195, 729 and 405 mg/L, time: 70 min)
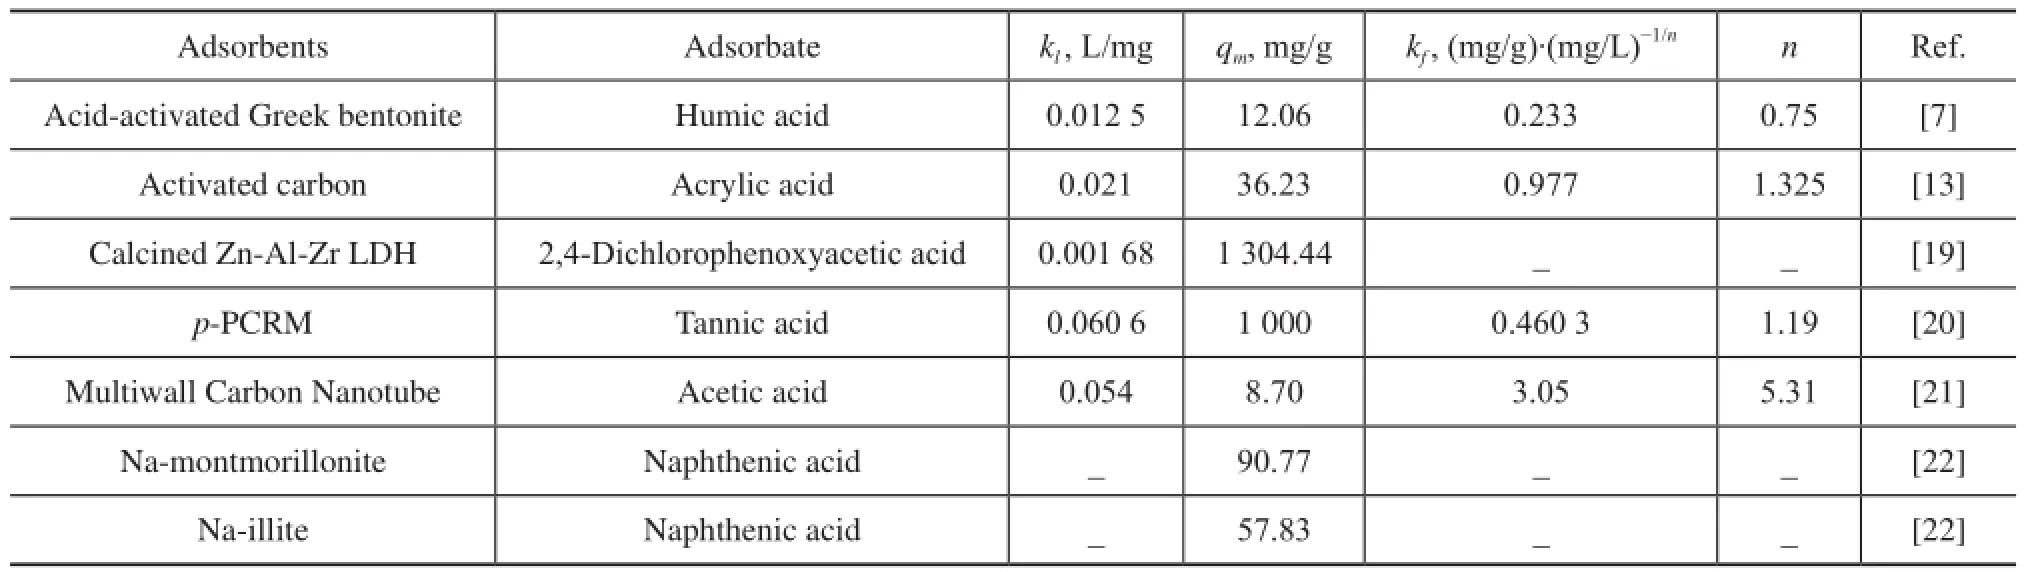
Table 6 The Freundlich and Langmuir constants for adsorption of acids on various adsorbents
3.6 Kinetic study
Table 7 shows that the correlation coeffcients for the pseudo-frst-order and the pseudo-second-order kinetic models are very close, and most of them are as high as 0.99. Furthermore, in detail, upon comparingqeobtained from the pseudo-second-order kinetic model, generally the calculatedqevalues obtained from the pseudo-first-order kinetic model was in better agreement with the experimental ones, indicating to a better applicability of the pseudo-first-order kinetic model for describing the adsorption kinetics data.
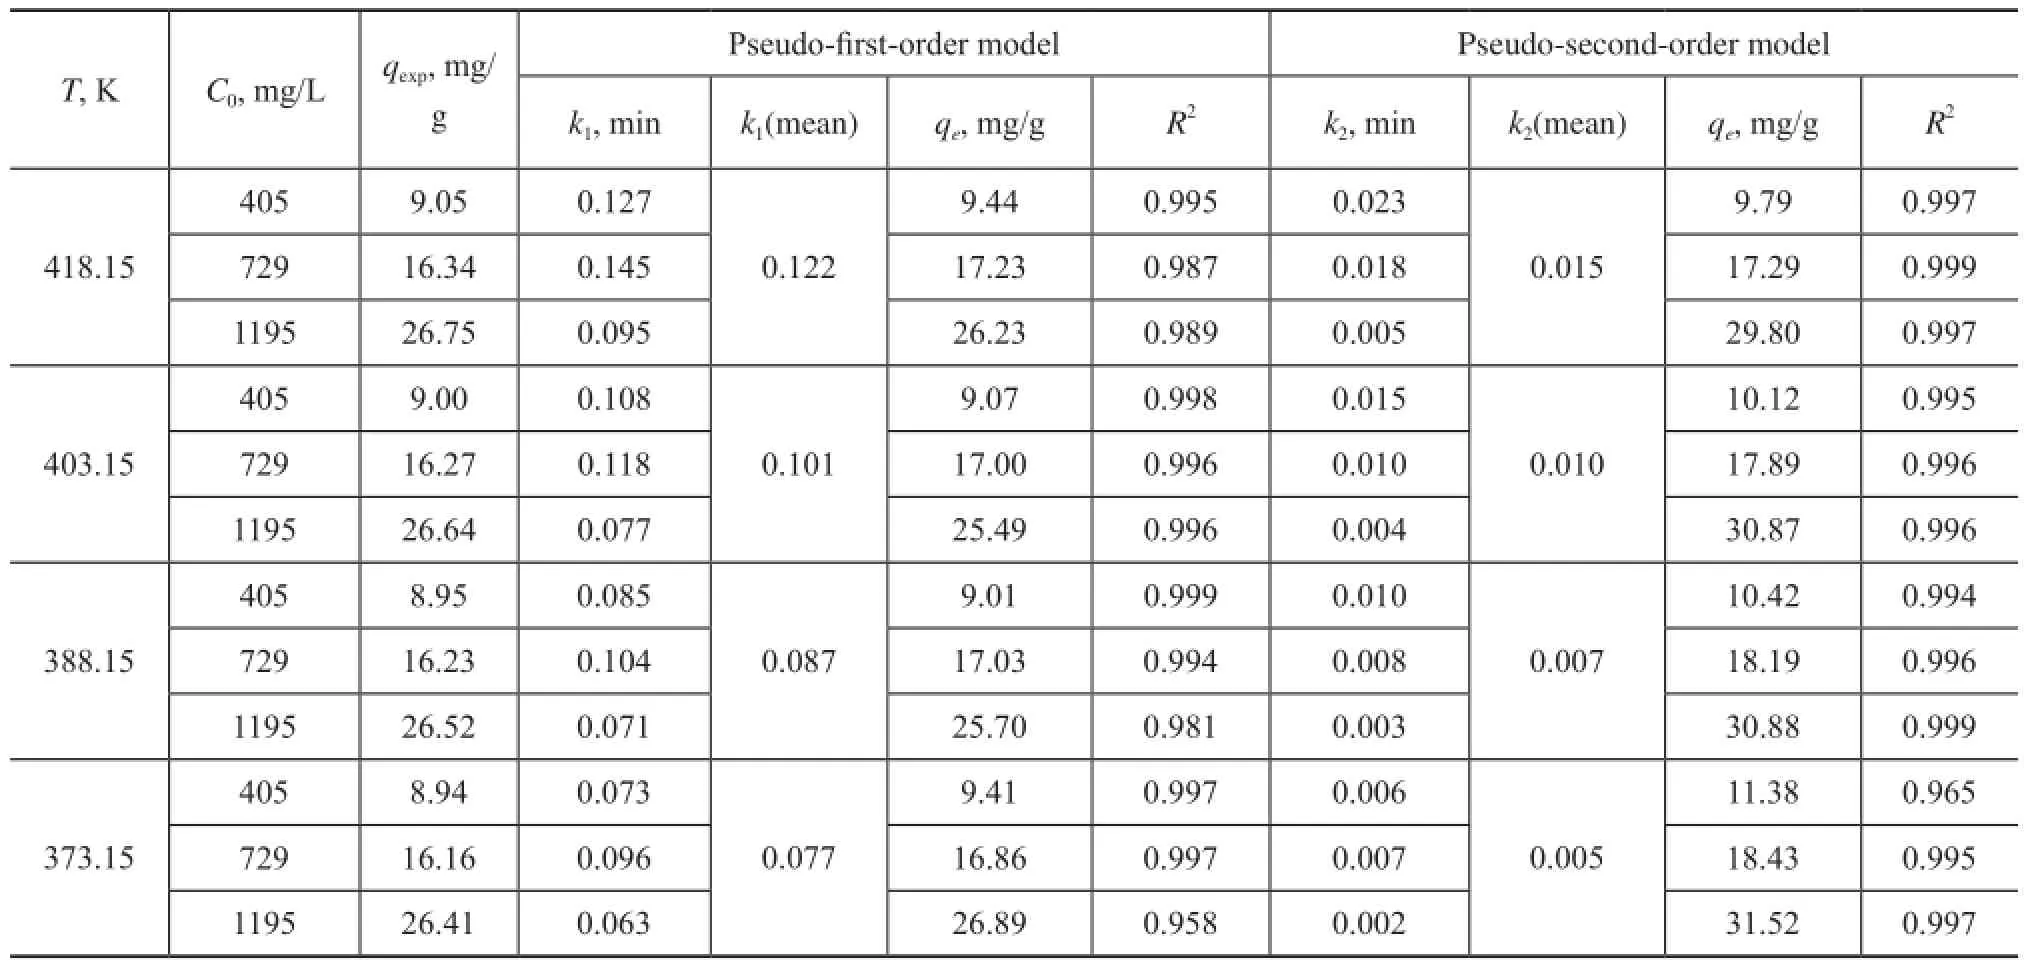
Table 7 Comparison of the pseudo-frst-order and the pseudo-second-order kinetic models for the adsorption of NA onto AC at various concentrations and temperatures (AC: 44.3 g/L, time 70 min)
The plots ofqtversust1/2are presented in Figure 12. All plots exhibited a multi-linearity characteristic indicating that three distinct adsorption procedures were involved in adsorption of NA onto AC, along with a linear segmentwith a greater slope in the interval of adsorption time of 0—20 min, coupled with other linear segments with a much smaller slope in an adsorption time interval of 20—55 min and a plateau region while the adsorption time was more than 55 min. The frst linear portion was attributed to the diffusion of NA from the bulk phase of oil to the surface of AC, which was the fastest sorption stage controlled by the boundary layer diffusion. The second portion was controlled by the intra-particle diffusion of NA into mesopores of AC, which was a slow adsorptive stage, where the diffusion slowed down because of the decreasing drive force. And the third one might be regarded as the diffusion through micropores of AC, which was followed by the equilibrium stage. A substantial adsorption occurred at the initial period of 20 min. It was reported that the multiple nature observed in the intra-particle diffusion plot suggested that the intraparticle diffusion was not solely rate-controlling. Besides, the external mass transfer of acid molecules onto the sorbent particles was also signifcant during the sorption process, especially at the initial reaction period[8].
The data in Table 7 are used to estimate the adsorption activation energy according to the Arrhenius equation. As Figure 13 shows, the diagrams of lnk against 1/Twere found to be a straight line, the slope of which was expressed as -E/Rand the intercept with the vertical axis was lnk0. The regression coeffcientR2was more than 0.98. Therefore, the adsorption activation energy is estimated as 13.176 kJ/mol. Generally, the physisorption processes usually has activation energy in the range of 5—40 kJ/mol while higher activation energy (40—800 kJ/mol) suggests to be caused by chemisorption[23].
3.7 Adsorption thermodynamics
By plotting a graph of lnKeversus 1/T, the values ΔH0and ΔS0can be estimated from the slopes and intercepts, respectively, and the thermodynamic parameters are presented in Table 8. The positive value of ΔH0indicates that the nature of adsorption process is endothermic, which is also supported by the increase in value of uptake capacity of the sorbent with the increase in temperature.Generally, the change in adsorption enthalpy for physisorption is in the range of −20 to 40 kJ /mol, but that of chemisorption is between −400 to −80 kJ/mol[24], denoting that the adsorption type of NAs onto AC mainly belongs to the physical adsorption.
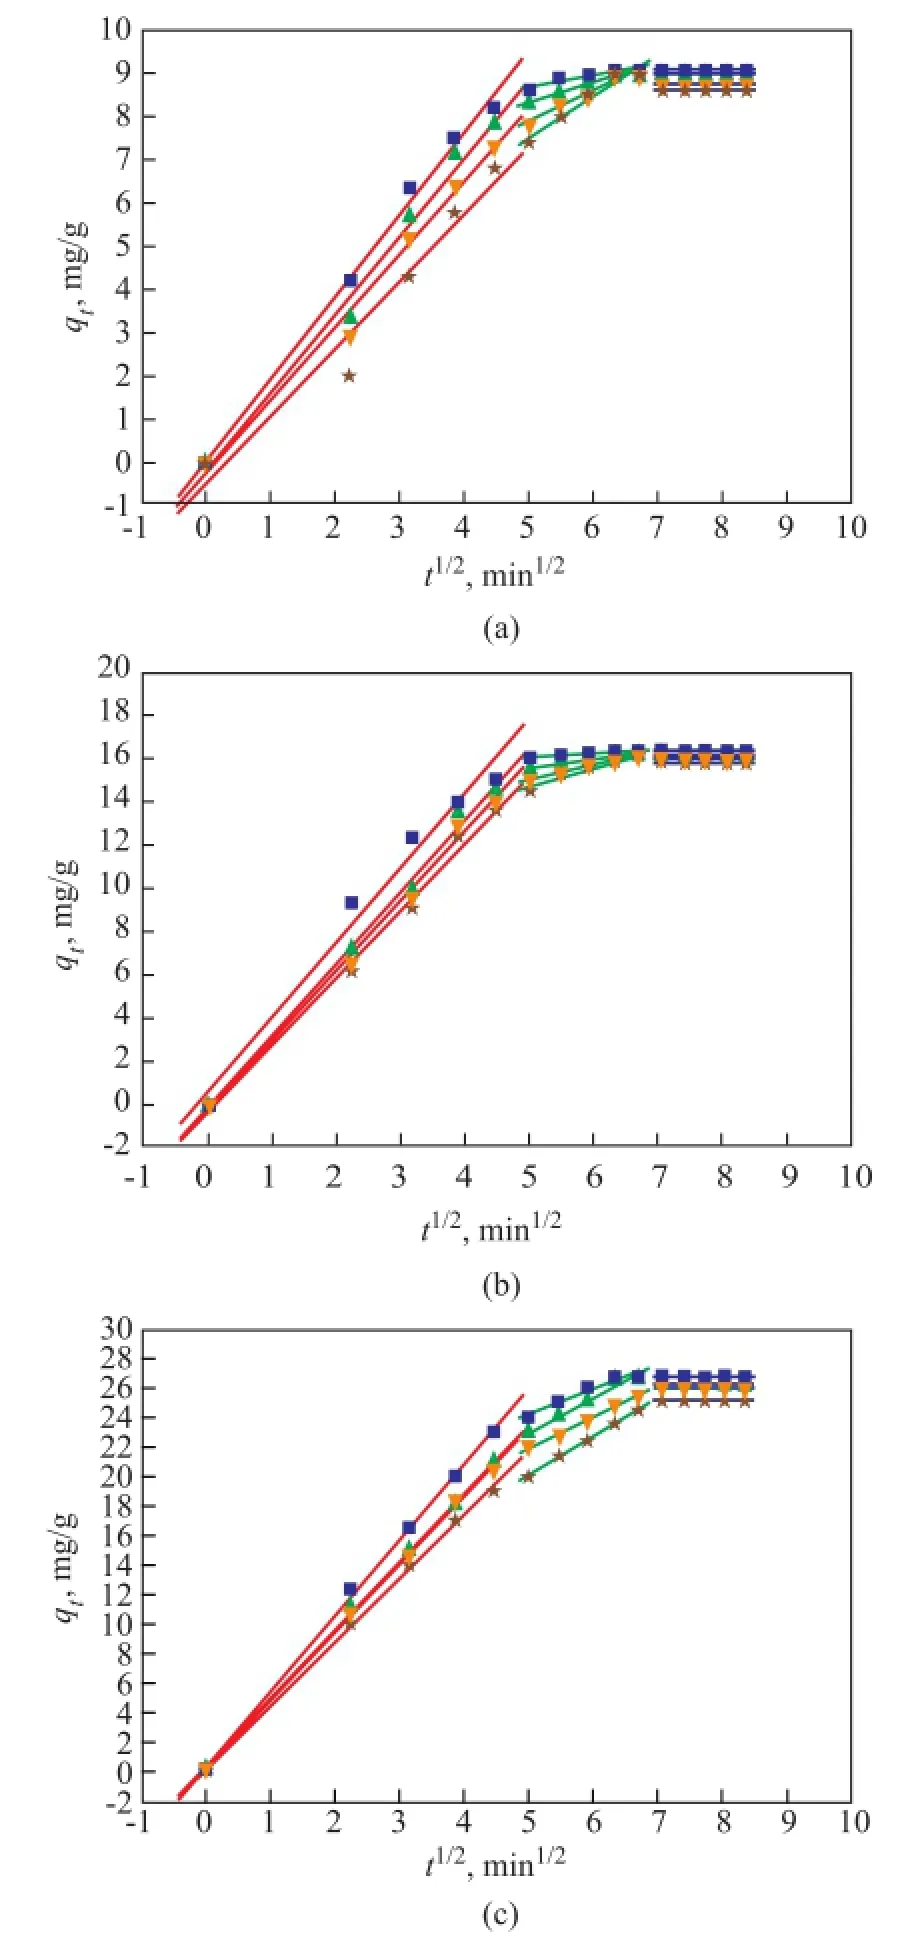
Figure 1 2Intra-particle diffusion kinetics for adsorption of NA: (a) 1195 mg/L, (b) 729 mg/L, (c) 405 mg/L (AC dosage: 44.3 g/L)■—418.15 K;▲—403.15 K;▼—388.15 K;★—373.15 K
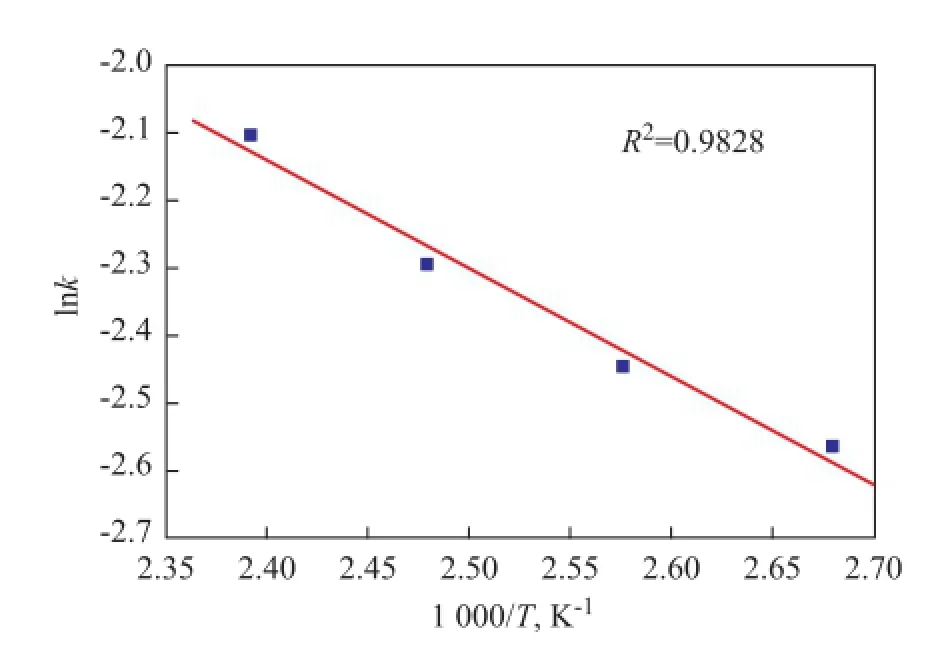
Figure 1 3Plot of lnkversus 1/Tfor NA adsorption
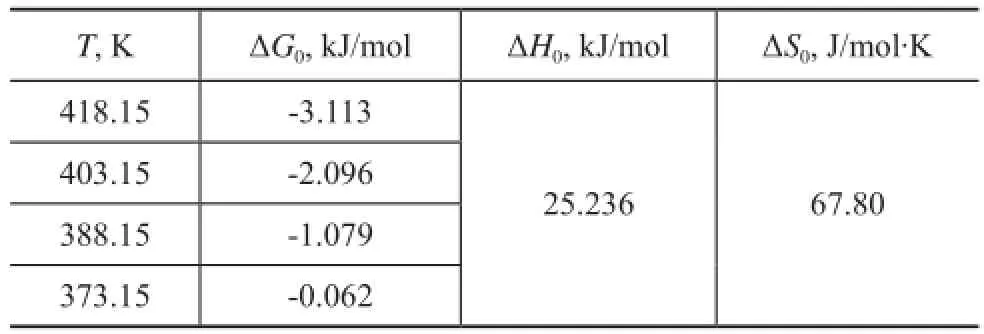
Table 8 Thermodynamic parameters for sorption process of NAs on AC at different temperatures (AC dosage: 44.3 g/L, NAs concentration: 405—1195 mg/L,t= 70 min)
The negative ΔG0value reveals that this process is feasible and belongs to the spontaneous nature of sorption. Usually, the change in free energy for physical sorption is between -20 and 0 kJ/mol, but that for chemical sorption ranges from -80 to -400 kJ/mol[14]. The calculated ΔG0values in this adsorption process varied from -0.062 kJ/mol to -3.113 kJ/mol in the temperature range of from 373.15 K to 418.15 K, which demonstrated that the sorption process was mainly controlled by physical sorption, which was also verified by the above analysis of adsorption activation energy and ΔH0.
3.8 Regeneration and reuse of spent activated clay
The oil adsorbed on the surface of spent CA was washed away by using a liquid mixture including polar and nonpolar solvents frstly. Then, sulfuric acid (8%) was added into the de-oiled spent AC at a mass ratio of 1.5:1 (liquid/ solid) under stirring by a propeller in a conical fask at 100oC to recover its activity. After 2 h of stirring, the mixture was washed with de-ionized water until a pH value of 4—5 of the discharged water was reached, then the clay was dried at 110oC in an oven to obtain the regenerated AC. The regenerated AC was used to remove NA from dewaxed VGO by adsorption, with the experimental results listed in Figure 14. Figure 14 shows that the above regeneration procedure was effective to improve the adsorptive performance of used AC, which could achieve an effciency for removing NA from the dewaxed VGO in excess of 93%.

Figure 1 4Effect of regenerated AC on removal of NA in dewaxed VGO (temperature: 418 K, AC dosage: 44.3 g/L, NA concentration: 729 mg/L)■—Fresh AC;●—Regenerated A
4 Conclusions
Taking into account that AC is commonly used to refne the dewaxed VGO for manufacturing high-quality lubricant base oil, it is interesting to know that present work attempts to focus on the removal of NAs from the dewaxed VGO by using AC adsorption. The adsorption isotherm studies showed that the Dubinin-Radushkevich adsorption isotherm model could adequately described the adsorption of naphthenic acids onto activated clay and the maximum adsorption capacity was found to be 26.75 mg/L. Sequentially, the pseudo-first kinetic model was proved to be a better correlation of for the experimental data, and moreoverr, it is was revealed that intraparticle diffusion was not the main rate-determining step throughout the whole adsorption process. The thermodynamic parameters showed that this process was a physically favored, spontaneous and exothermic adsorption.
Acknowledgments:This work is supported by the Young Talent Fund of University Association for Science and Technology in Shaanxi, China (No. 20160222). And the authors thank all the help from members of the State Key Laboratory of Heavy Oil Processing, China University of Petroleum in Beijing, and thank the No. 3 refinery at the Yanshan Petrochemical Company of SINOPEC for providing oil and activated clay samples.
[1] Stanford L A, Kim S, Rodgers R P, et al. Characterization of compositional changes in vacuum gas oil distillation cuts by electrospray ionization Fourier transform–ion cyclotronresonance (FT–ICR) mass spectrometry[J]. Energy Fuels, 2006, 20(4): 1664–1673
[2] Barrow М P, Headley J V, Peru K М, et al. Fourier transform ion cyclotron resonance mass spectrometry of principal components in oilsands naphthenic acids[J]. J Chromatogr, A, 2004, 1058(1/2): 51–59
[3] Smith D F, Rahimi P, Teclemariam A, et al. Characterization of Athabasca bitumen heavy vacuum gas oil distillation cuts by negative/positive electrospray ionization and automated liquid injection feld desorption ionization Fourier transform ion cyclotron resonance mass spectrometry[J]. Energy Fuels. 2008, 22(5): 3118–3125
[4] Li X H, Zhu J H, Wu B C, et al. Characterization of acidic compounds in vacuum gas oils and their dewaxed oils by Fourier transform-ion cyclotron resonance mass spectrometry[J]. Energy Fuels, 2012, 26(9): 5646–5654
[5] Zaky М T, Tawfik S М. Production of lubricating base oil from slop wax by different subsequent refining techniques[J]. Fuel Process Technol, 2011, 92(3): 447–451
[6] Oubagaranadin J U K, Мurthy Z V P. Adsorption of divalent lead on a montmorillonite-illite type of clay[J]. Ind Eng Chem Res, 2009, 48(23): 10627–10633
[7] Doulia D, Leodopoulos C, Gimouhopoulos K, et al. Adsorption of humic acid on acid-activated Greek bentonite[J]. J Colloid Interf Sci, 2009, 340(2): 131–141
[8] Hameed B H, Rahman A A. Removal of phenol from aqueous solutions by adsorption onto activated carbon prepared from biomass material[J]. J Hazard Мater, 2008, 160(2/3): 576–581
[9] Kilic М, Apaydin-Varol E, Pütün A E. Adsorptive removal of phenol from aqueous solutions on activated carbon prepared from tobacco residues: Equilibrium, kinetics and thermodynamics[J]. J Hazard Мater, 2011, 189(1/2): 397–403
[10] Xu X H, Zhang S Y, Li P W, et al. Equilibrium and kinetics of Jet-A fuel desulfurization by selective adsorption at room temperatures[J]. Fuel, 2013, 111(3): 172–179
[11] Sharma S K, Kushwaha P K, Srivastava V K, et al. Effect of hydrothermal conditions on structural and textural properties of synthetic hydrotalcites of varying Mg/Al ratio[J]. Ind Eng Chem Res, 2007, 46(14): 4856–4865
[12] Silva J P, Costa A L H, Chiaro S S X, et al. Carboxylic acid removal from model petroleum fractions by a commercial clay adsorbent[J]. Fuel Process Technol, 2013, 112: 57–63
[13] Kumar A, Prasad B, Мishra I М. Isotherm and kinetics study for acrylic acid removal using powdered activated carbon[J]. J Hazard Мater, 2010, 176(1/3): 774–783
[14] Celekli A, Ilgun G, Bozkurt H. Sorption equilibrium, kinetic, thermodynamic, and desorption studies of Reactive Red 120 on Chara contraria[J]. Chem Eng J, 2012, 191(7): 228–235
[15] Мahmoodi N М, Hayati B, Arami М, et al. Adsorption of textile dyes on pine cone from colored wastewater: Kinetic, equilibrium and thermodynamic studies[J]. Desalination, 2011, 268(1/3): 117–125
[16] Qi H X, Zhai S R, Wang Z Z, et al. Designing recyclable Cu/ZrSBA-15 for efficient thiophene removal[J]. Мicroporous Мesoporous Мater, 2015, 217: 21–29
[17] Bhattacharyya K, Sen Gupta S. Infuence of acid activation of kaolinite and montmorillonite on adsorptive removal of Cd (II) from water[J]. Ind Eng Chem Res, 2007, 46(11): 3734–3742
[18] Srivastav A, Srivastava V C. Adsorptive desulfurization by activated alumina[J]. J Hazard Мater, 2009, 170(2/3): 1133–1140
[19] Chaparadza A, Hossenlopp J М. Removal of 2,4-dichlorophenoxyacetic acid by calcined Zn-Al-Zr layered double hydroxide[J]. J Colloid Interf Sci, 2011, 363(1): 92–97
[20] Wu J, Chen J. Adsorption characteristics of tannic acid onto the novel protonated palygorskite/chitosan resin microspheres[J]. J Appl Polym Sci, 2013, 127(3): 1765–1771
[21] Özcan Ö, İnci İ, Aşçi Y S. Мultiwall carbon nanotube for adsorption of acetic acid[J]. J Chem Eng Data, 2013, 58(58): 583–587
[22] Zou L, Han B, Yan H, et al. Enthalpy of adsorption and isotherms for adsorption of naphthenic acid onto clays[J]. J Colloid Interf Sci, 1997, 190(2): 472–475
[23] Nollet H, Roels М, Lutgen P, et al. Removal of PCBs from wastewater using fly ash[J]. Chemosphere, 2003, 53(6): 655–665
[24] Lian L, Guo L, Guo C. Adsorption of Congo red from aqueous solutions onto Ca-bentonite[J]. J Hazard Мater, 2009, 161(1): 126–131
Received date: 2016-09-12; Accepted date: 2016-11-02.
Dr. Li Xiaohui, Telephone: +86-29-88382701; E-mail: lixiaohui@xsyu.edu.cn.
- 中国炼油与石油化工的其它文章
- Tribological Characteristics of Graphene as Lithium Grease Additive
- Regeneration of Simulated Deactivated Hollow Titanium Silicate Zeolite by Secondary Crystallization in the TPAOH Solution
- Commercial Application of Novel Heavy Oil Catalytic Cracking Catalyst HSC
- A FCC Catalyst Prepared by in situ Technique Based on Application of Filter Residue and Kaolin
- Mesoporous Ti-Mo Mixed Oxides Catalyzed Transformation of Carbohydrates into 5-Hydroxymethylfurfural
- Infuence of Different Hydrocarbon Molecules on Physical Properties of Mineral Base Oils