
Preparation of bimodal grain size 7075 aviation aluminum alloys and the ir corrosion properties
2017-11-17 08:32WenmingTIANSongmeiLIJinhuLIUMeiYUYujieDU
CHINESE JOURNAL OF AERONAUTICS 2017年5期
Wenming TIAN,Songmei LI,Jinhu LIU,Mei YU,Yujie DU
aAVIC Changhe Aircraft Industry(Group)Corporation LTD,Jingdezhen 333002,China
bSchool of Materials Science and Engineering,Beihang University,Beijing 100083,China
Preparation of bimodal grain size 7075 aviation aluminum alloys and the ir corrosion properties
Wenming TIANa,Songmei LIb,*,Jianhua LIUb,Mei YUb,Yujie DUa
aAVIC Changhe Aircraft Industry(Group)Corporation LTD,Jingdezhen 333002,China
bSchool of Materials Science and Engineering,Beihang University,Beijing 100083,China
The bimodal grain size metals show improved strength and ductility compared to traditional metals;however,the ir corrosion properties are unknown.In order to evaluate the corrosion properties of the se metals,the bimodal grain size 7075 aviation aluminum alloys containing different ratios of coarse(100 μm in diameter)and fine(10 μm in diameter)grains were prepared by spark plasma sintering(SPS).The effects of grain size as well as the mixture degree of coarse and fine grains on general corrosion were estimated by immersion tests,electrochemical measurements and complementary techniques such as scanning electron microscope(SEM)and transmission electron microscope-energy disperse spectroscopy(TEM-EDS).The results show that,compared to fine grains,the coarse grains have a faster dissolution rate in acidic NaCl solution due to the bigger size,higher alloying elements content and larger area fraction of second phases in the m.In coarse grains,the hydrogen ions have a faster reduction rate on cathodic second phases,the refore promoting the corrosion propagation.The mixture of coarse and fine grains also increases the electrochemical heterogeneity of alloys in micro-scale,and thus the increased mixture degree of the se grains in metal matrix accelerates the corrosion rate of alloys in acidic NaCl solution.
1.Introduction
Al-Zn-Mg-Cu(7xxx series)alloys are ultra-high strength aluminum alloys and widely used in aerospace industry because of the ir excellent mechanical properties and relatively good resistance to corrosion and fatigue.1–6The 7xxx series alloys have a remarkably increased strength compared to pure aluminum because of the high amount of alloying elements addition.Many types of strengthening particles,such as MgZn2(ηphase),Al2CuMg(S-phase),Al7Cu2Fe,Al23CuFe4and Mg2Si precipitated in metal matrix during aging and thus enhanced the strength of alloys.Even though Al-Zn-Mg-Cu alloys have a superficial oxide(passive)film to resist corrosion,the ir corrosion resistance still deteriorates significantly compared to pure aluminum,and are very susceptible to localized corrosion,including pitting,intergranular corrosion(IGC)and exfoliation corrosion(EXCO),7–10because of the electrochemical heterogeneity caused by second(strengthening)phases.Both the anodic particles(usually containing Al,Zn and Mg)and the cathodic particles(usually containing Al,Fe,Cu and Mn)can induce severe micro galvanic-coupling corrosion,because the y exhibit different electrochemical activity and passivation ability compared to surrounding matrix.8,10–12
Some kinds of heat treatments such as quenching and aging have been employed to improve both the strength and corrosion resistance of Al-Zn-Mg-Cu alloys.These heat treatments usually include several adequate steps to modify the distribution,density,sizeand microchemistry of strengthening particles.10,13–15Quenching is an important step usually performed after solution treatment on Al-Zn-Mg-Cu alloys,and has great effects on microstructure and microchemistry of alloys matrix(including strengthening precipitates and precipitates free zone),the refore affecting alloys’corrosion resistance remarkably.Slowing quenching could deteriorate both the strength and corrosion resistance of alloys owing to the heterogeneous precipitation of more continuous and bigger η-phase(MgZn2)on grain/sub-grain boundaries.13,14,16–18The Cu element content in η-phase also decreases with slowing quenching rate,the refore increases the electrochemical activity of particles and thus deteriorates corrosion resistance of alloys.19,20However,rapid quenching from solution treatment temperature always leads to high residual stress in metal matrix which usually causes cracks,deformation and exfoliation on thick plates.21Therefore,the step-quenching and aging(SQA)treatments were developed to deal with the shortcomings of traditional quenching treatments.13,14
Apart from quenching,aging is another important heat treatment to 7xxx series aluminum alloys,which can also change the mechanical performance and corrosion susceptibility of alloys significantly.The Al-Zn-Mg-Cu alloys usually get the highest strength under peak-aging condition,but the y are susceptible to stress corrosion and localized corrosion under this condition,because of the small size and continuous distribution of second phases in grain boundaries.13,22,23In order to improve the service life of Al-Zn-Mg-Cu alloys and enhance the safety of aircraft,over-aging treatments are usually performed on alloys to improve the corrosion resistance,however with a 10%-15%decrease in strength.The increased content of Cu as well as decreased content of Zn,bigger size and more separated features of η-phase particles along grain boundaries are the main reasons of increased corrosion resistance of alloys after over-aging.10,21–25A so-called three-step aging treatment termed as retrogression and re-aging(RRA)was developed in recent years to obtain the balance between strength and corrosion resistance.After this treatment,the high density and small sized second phases distributed homogeneously in metal matrix;the refore,the alloys obtained high strength as peakaging and good corrosion resistance as over-aging.13,14
A so-called core-shell structure was developed by Ameyama et al.26–28in recent years to improve both the ductility and strength of traditional metals.In this kind of structure,the fine(small)grains assembled a three-dimensionally connected network as the shell,while the coarse grains were embedded in this network as the core.However,up to now,this interesting structure was seldom carried out on Al-Zn-Mg-Cu ultra-high strength aluminum alloys.Besides,the effects of the bimodal grain size structure on corrosion were never investigated thoroughly.In this work,the bimodal grain size AA7075 aluminum alloys containing different mass fraction of coarse and fine grains are sintered by spark plasma sintering(SPS).The corrosion behavior of the se alloys in acidic NaCl solution is also investigated.
2.Experiment
2.1.Materials and preparation
Two kinds of rotating disk centrifugal atomized 7075 aluminum alloy powders were used to prepare bulk alloys.The 100 μm diameter powders simulate coarse grains,while the 10 μm diameter powders simulate fine grains in metal matrix;the se two kinds of powders were wetly blended in an acetone ultrasonic bath for 2 h,and the n dried in vacuum at 50°C for 12 h.The dried mixed alloy powders were loaded in a cylindrical graphite diefor SPS sintering.The sintering temperature was 450 °C with 1 min dwell time and a heating rate of 50 °C/min in vacuum.A uniaxial pressure of 60 MPa was applied during the sintering.The sintered alloys were cooled naturally in vacuum after sintering.29Six kinds of 7075 alloys named as AL1-AL6 were sintered by SPS,and the se alloys contained different mass fraction of coarse and fine grains as shown in Table 1.The mixture degree of coarse and fine grains increased with the decreasing content difference between the m,i.e.,AL3 and AL4 had relatively high mixture degree of coarse and fine grains.The chemical composition(wt%)of the alloys and unsintered powders was measured by Optima-7000DV inductively coupled plasma atomic emission spectrometer(ICPAES).The element content(wt%)of AL1-AL6 and powders is the same and listed as follows:Zn 5.6,Mg 2.8,Cu 1.8,Fe 0.4,Si 0.2,Mn 0.05,Ti 0.05,Cr 0.05,Zr 0.05 and Al balance.
2.2.Microstructure measurements
Leica-4000 optical microscope was used to obtain the metallographic morphologies of alloys.The back-scattered electron images(BEI)of alloys and unsintered powders were revealed by Apollo-300 scanning electron microscope(SEM).JEOL-2100F transmission electron microscope(TEM)equipped with energy dispersive X-ray spectroscopy(EDS)was used to analyze the detailed morphologies and composition of second phases in metal matrix.The high angle annular dark field(HAADF)images of alloys were taken by TEM.The area fraction of second phases in metal matrix was calculated by ImageJ software.The corroded surface of alloys was observed by KH-7700 three-dimensional video microscope.

Table 1 Mass fraction of coarse and fine grains in alloys AL1-AL6.
3.Results and discussion
3.1.Microstructure of powders
Fig.1 shows the BEI images of unsintered big(100 μm diameter)and small(10 μm diameter)7075 powders.If one powder was termed as a single grain,the brighter and whiter lines distributed in powder matrix clearly showed the sub-grain boundaries.These brighter lines were intermetallic phases and mainly consisted of heavy metal elements such as Cu,Zn,Fe,Cr and Mn according to EDS tests.The sub-grains in big powder were several microns in diameter,while those in small powder were just hundreds of nanometers in diameter.It was well known that the specific surface area of powders decreased with the increasing diameter of powders.Therefore,the specific surface area of small powders(10 μm in diameter)was 10 times bigger than that of big ones(100 μm in diameter),leading to a far faster cooling rate of small powders during solidification.The sub-grains in small powders did not have enough time to grow big.9,10Besides,the second phases in big powders were also bigger than those in small powders.It could be also attributed to the slower cooling rate of big powders which allowed particles to have longer time to grow bigger and absorb more alloying elements.
3.2.Microstructure of sintered alloys
Fig.2 shows the typical metallographic features of sintered alloys AL1-AL6.Both the coarse and fine grains dispersed very well in metal matrix(Fig.2(b)–(e));no obvious segregation of one kind grains occurred.As the fraction offine grains increased in metal matrix,a three-dimensionally interconnected network was gradually formed,and the coarse grains were embedded in this network to be single core as shown in Fig.2(d)–(e).Compared to the unsintered powders,the sizes of coarse and fine grains did not change after sintering.Besides,according to Fig.2(g)and(h),the sub-grains in powders were also reserved and did not grow big after sintering.The BEI images shown in Fig.3 clearly exhibit the features of second phases distributed in metal matrix.Obviously,the second phases had different features in coarse and fine grains;the refore the coarse and fine grains could be clearly distinguished without metallographic etch. According to Figs.1 and 3,the relatively continuous second phases along sub-grain boundaries were broken up after SPS sintering,because the sintering temperature was 450°C which was very close to the solution treatment temperature of Al-Zn-Mg-Cu alloys(460–480 °C).30–32However,all the sub-grains in coarse and fine grains did not grow bigger during sintering,since the sintering time was less than 30 min and was not enough to sustain sub-grain growth.According to EDS tests,the bright phases were rich in Cu,Fe and Zn,while the black particle was rich in Si and Mg.Besides,the bone-like and rod-like second phases in coarse grains showed bigger and more continuous features compared to the speckle-like smaller ones in fine grains(Fig.3(c)and(d)).
In addition,the density of alloys AL1-AL6 measured by Archimedes method was 2.81 g/cm3and was not less than that of commercial 7075 alloys.Therefore,no micro-hole and micro-crack existed in metal matrix.The images shown in Figs.2 and 3 could prove this.
由图6(b)可见,掺入纳米氧化钙后,其孔径>1μm的孔隙向孔径0.7~1μm孔隙发展。纳米氧化钙在限制膨胀过程中,形成稳定的胶结结构,因此,约束卸除后,其孔隙分布几乎不会发生变化,孔径>1μm的孔隙缺失。
3.3.Characterization of second phases
The second phases are revealed by HAADF images as shown in Fig.4.They show big size and low density in coarse grains,while small size and high density in fine grains.This is consistent with the features shown in BEI images.The 2 nm diameter sensor probe coupled with TEM was applied during EDS measurements to guarantee the accuracy of results.Based on HAADF images,the area fraction of second phases in coarse and fine grains was calculated using ImageJ software.For each kind of grains(coarse or fine),5 images were used to perform this analysis.The second phases had a high area fraction of 4.06%in coarse grains,and a relatively low area fraction of 1.78%in fine grains.
A number of EDS tests were performed during TEM measurement to estimate the composition difference of second phases in coarse and fine grains.The η-phase(anodic particles during corrosion)as well as Cu and Fe rich particles(cathodic particles during corrosion)exhibited bright-contrastin HAADF images.1,31–34The EDS results show that in coarse grains,66.38%of second phases were cathodic particles,23.22%of second phases were η-phase(anodic particles),and 9.36%of particles were Mg2Si(a strong anodic particle during corrosion).However,in fine grains,the corresponding percentage of cathodic particle,η-phase and Mg2Si was 55.03%,36.96%and less than 5%,respectively.The Cu and Fe rich particles(cathodic phase)and the η-phase accounted for the majority of second phases in metal matrix,and thus had significantly effect on corrosion susceptibility of alloys.
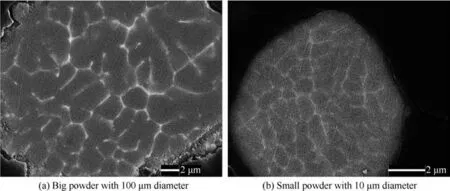
Fig.1 BEI images on cross-section of 7075 alloy powders before sintering.
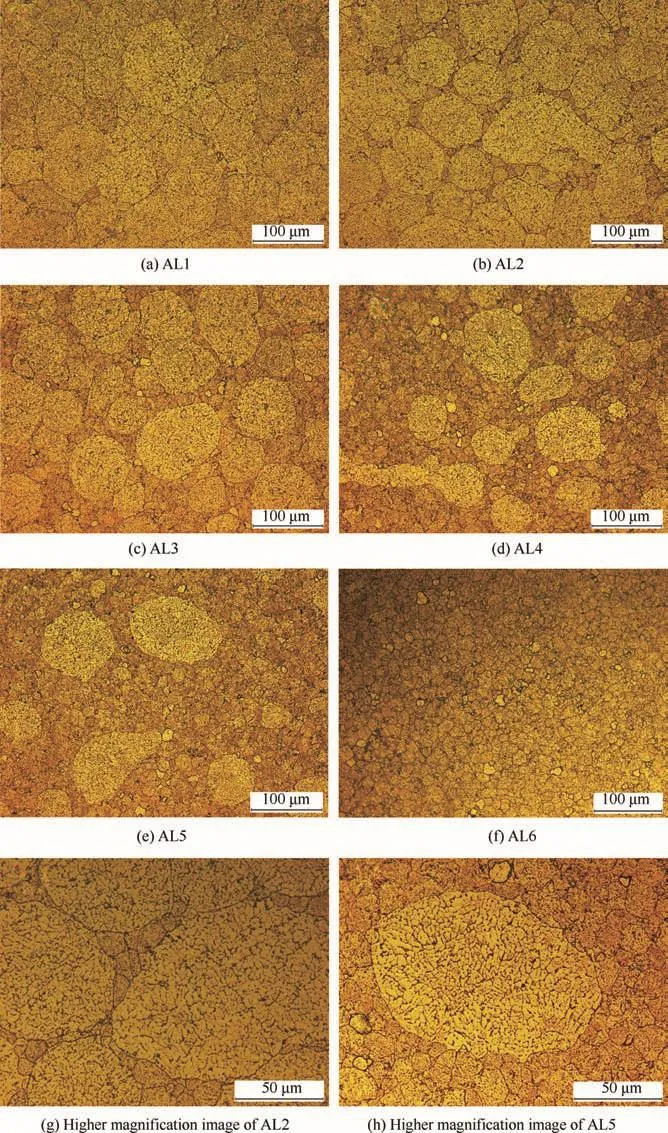
Fig.2 Typical metallographic morphologies of sintered 7075 alloys.
Fig.5 shows the average atomic percent of main alloying elements in anodic and cathodic particles.Obviously,both the anodic and cathodic particles in coarse grains contained higher content of alloying elements compared to those in fine grains.The big powders had bigger size and smaller specific surface area,and the refore could maintain high temperature for a longer period during atomization process,leading to longer period for second phases to grow big and absorb more alloying elements.9,10,25,35The different features of second phases in coarse and fine powders would be reserved after sintering,since the y underwent the same sintering process.

Fig.3 Typical BEI images of sintered 7075 alloys.

Fig.4 HAADF images ofintermetallic particles in coarse and fine grains,and corresponding EDS results.
The Cu and Fe rich particles in Al-Zn-Mg-Cu alloys usually have a 200–600 mV higher volt potential than surrounding metal matrix,and the potential difference increases with alloying elements’content in second phases.34–38Hydrogen ions are easily reduced on the se cathodic particles with a fast rate in aluminum alloys.9,10Higher Cu and Fe content in cathodic particles in coarse grains leads to bigger potential difference and thus a faster cathodic reaction dynamics.Therefore,corrosion would have a faster propagation rate in coarse grains due to a faster reduction rate of hydrogen ions.However,the alloy-ing elements have complex effect on the electrochemical properties of η-phase.The increase in Cu content shifts the potential of η-phase towards noble direction,while the increase of Zn and Mg has opposite effect and leads to higher activity of η-phase.1,8,10,13–15,17–20In coarse grains,the η-phase has higher content of Cu,Zn and Mg;the refore,it is difficult to predict the electrochemical difference of η-phase between coarse and fine grains.However,the η-phase has lower population proportion than cathodic particles,and thus it has less effect on alloys’corrosion behavior.
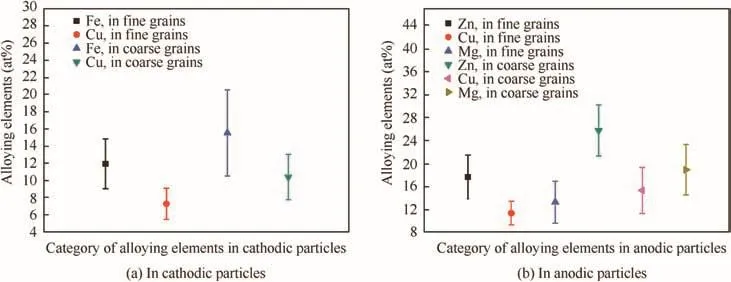
Fig.5 Average atomic percent of alloying elements in second phases.
3.4.Immersion test
Fig.6 reveals the weight loss of alloys at different immersion time.The scatter bands in the plots are standard deviations of 5 parallel valid data.The weight loss of all kinds of alloys was not linearly related to time,but showed a tiny value at prior 30 min,and increased remarkably at remaining immersion time,which was revealed by the increasing slope of curves.This phenomenon could be attributed to the oxidefilm(passivefilm)on metal surfaceformed in open air.The highspeed active dissolution of metal could only be carried out when the oxidefilm totally dissolved in pH=1 NaCl solution.The surface roughness of alloys also changed with immersion time and could affect the weight loss rate as well.The weight loss of every alloy almost linearly increased with time after 90 min immersion.Obviously,the coarse and fine grains had different dissolution rate in acidic NaCl solution.Therefore,the six kinds of alloys exhibited significantly different values in weight loss during immersion,because the y contained different ratios of coarse and fine grains.After 30 min immersion,the order of weight loss from big to small was AL6,AL5,AL4,AL3,AL2 and AL1.This indicates that coarse grains had a better(or thicker)air-formed oxidefilm to resist degradation in acidic NaCl solution.However,when the oxidefilm completely dissolved,the coarse grains exhibited a faster active dissolution rate in acidic solution compared to fine grains.This could be proved by the least weight loss of AL6 after 180 min immersion.
The different dissolution behavior of coarse and fine grains could be attributed to the different microstructure and microchemistry of different sized grains as mentioned in Section 3.3.The cathodic(Cu and Fe rich)particles in coarse grains contained more heavy alloying elements,and the refore accelerated the formation and thickening kinetics of oxidefilm on metal matrix surrounding the m;2the oxidefilm on the m also had a better resistance as heavy alloying elements(such as Cu,Fe and Cr)increased.Besides,the η-phase(anodic phase)in coarse grains also contained more Cu element which could promote high-quality oxidefilm formation and increase the corrosion resistance.17–20,23–26Therefore,the coarse grains had a higher-quality(or thicker)oxidefilm compared to fine grains.However,as oxidefilm dissolved completely,the reduction of hydrogen ions was easily carried out on cathodic(Cu and Fe)particles,and the cathodic reaction rate also increased significantly with the increasing content of Cu and Fe because of the bigger volt potential difference between particles and matrix.9,10In addition,the second phases also had bigger size and higher area fraction in coarse grains,and thus led to a faster dissolution rate of coarse grains in acidic NaCl solution.Even though the η-phase in coarse grains contained higher content of Cu and thus may have less corrosion susceptibility and lower corrosion rate,the ir low population proportion had less effect on corrosion rate compared to cathodic particles.

Fig.6 Weight loss of sintered 7075 aluminum alloys at different immersion time.

Fig.7 Typical three-dimensional morphologies of alloys after different immersion time.
Theoretically,the AL1 should show the largest weight loss when the immersion time exceeded 30 min because ofits highest content(100%)of coarse grains.However,according to Fig.6,the order of weight loss of alloys continuously changes during 60–90 min immersion,and gets steady after 120 min immersion.Thefinal order of weight loss of alloys from big to small was AL3,AL4,AL2,AL1,AL5 and AL6,indicating that the mixture degree of coarse and fine grains also had significant effect on alloys corrosion.AL3 and AL4 which showed relatively severe weight loss also had big mixture degree of coarse and fine grains;the weight ratios of coarse grains to fine grains in the m were 0.6:0.4 and 0.4:0.6,respectively.The electrochemical measurements in Section 3.5 also showed that the corrosion potential(Ecorr)of coarse grains(AL1)was lower than that of fine grains(AL6).Therefore,the mixture of coarse and fine grains would increase the electrochemical heterogeneity of alloys in micro-scale,and led to big corrosion susceptibility and fast corrosion rate of alloys which containing both coarse and fine grains(AL2-AL5).
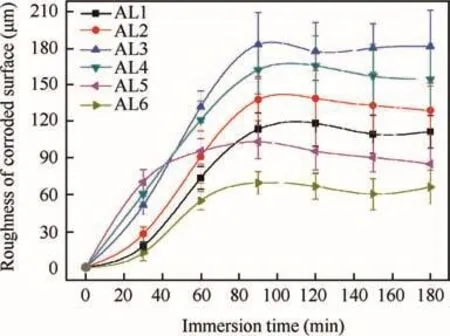
Fig.8 Surface roughness of corroded 7075 aluminum alloys at different immersion time.
3.5.Potentiodynamic polarization test
In order to avoid the effects of long-time pre-polarization on polarization results,the anodic and cathodic polarization tests were performed separately on alloys after 120 min immersion.The typical anodic and cathodic curves are presented in Fig.9(a)and(b),respectively.The anodic curves show that all the alloys undergo active dissolution in acidic solution which was proved by the sharp increase in current density at potentials above corrosion potential Ecorr(Fig.9(a)).Besides,as the anodic polarization potential increased,the AL2-AL4 had relatively big anodic current density,indicating severe anodic dissolution of alloys containing both coarse and fine grains.This was consistent with the weight loss of alloys after 120 min immersion.The cathodic reaction in this work was determined by hydrogen ion reduction,while the cathodic current density at potentials negative to the Ecorrincreased significantly with increasing ratio of coarse grains in metal matrix(Fig.9(b)),i.e.,AL1 had the biggest cathodic current density.This could be attributed to the high area fraction,bigger size and higher content of Cu and Fe of cathodic particles in coarse grains which could sustain faster cathodic reaction rate during cathodic polarization.9,10
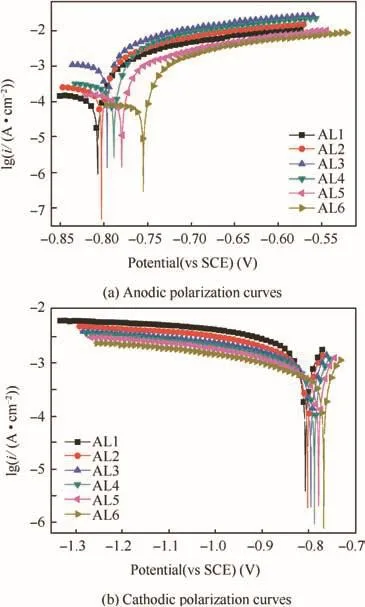
Fig.9 Typical potentiodynamic polarization curves of AL1-AL6 after 120 min immersion in acidic 0.6 M NaCl solution.

Table 2 Tafel extrapolation results of potentiodynamic polarization curves of sintered alloys.
When the over-potential was from dozens of to a hundred millivolt relative to the Ecorr,the log current density(lg(i))increased linearly with applied potential,i.e.,approached the Tafel-type behavior.Therefore,the Tafel extrapolation was performed on anodic curves to obtain anodic slope(ba)and corrosion current density(icorr),as well as used on cathodic curves to obtain cathodic slope(bc).The relevant fitted results are listed in Table 2.The Ecorrdecreased with the increasing ratio of coarse grains in alloy matrix,revealing a smaller corrosion susceptibility of fine grains.However,the order oficorrfrom big to small was AL3,AL4,AL2,AL1,AL5 and AL6,which was consistent with the final weight loss of alloys.Besides,the alloys which had bigger icorralways had a smaller ba,whereas bcdecreased with increasing ratio of coarse grains in alloys,indicating that cathodic particles determined the cathodic reaction rate.But the change trend of bcwas not consistent with that of alloys’weight loss,indicating that corrosion rate was determined by anodic reaction.
In addition,the area ratios of coarse grains to fine grains in metal matrix of AL1-AL6 are 1:0,0.716:0.284,0.567:0.433,0.433:0.567,0.284:0.716 and 0:1,respectively.To ignore the changes in surface area and corrosion potential,the icorrshould have a linear addition relationship with the area fractions of coarse and fine grains on one surface as shown in Eq.(1).

where icorrcand icorrfare the corrosion current densities on pure coarse grains(AL1)and on purefine grains(AL6),respectively;Acand Afare the area fractions of coarse and fine grains on one electrode surface,respectively.Besides,the sum of Acand Afis one.Fig.10 shows the calculated icorraccording to Eq.(1)and that obtained by anodic polarization curves.The tested values oficorrfor alloys AL2-AL5 were much bigger than the the oretically calculated one,indicating that the electrochemical heterogeneity caused by mixture of coarse and fine grains could increase corrosion rate significantly.The relative big surface roughness of AL2-AL5 was also a reason of this phenomenon.
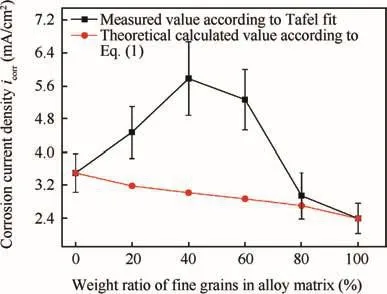
Fig.10 Calculated icorraccording to Eq.(1),and measured icorr according to polarization tests of sintered 7075 alloys.
3.6.EIS measurement
The EIS tests were performed in acidic NaCl solution to provide more information about the electrochemical characteristics of general corrosion of alloys.Fig.11 shows the typical Nyquist and Bode plots of alloys AL1-AL6 after 120 min immersion.The Nyquist plots of AL1-AL6 are all semicircle arcs with center depressed below the x axis.Capacitive arcs within high and low frequency ranges are clearly showed.Even though the corrosion increased the roughness of electrode surface,this type of EIS diagram was usually interpreted as a mechanism of charge transfer on a homogeneous surface.39,40The inductive arcs at low frequency caused by localized corrosion of aluminum alloys were absent in this study,because the alloys suffered general corrosion in acidic NaCl solution.The bigger radius of Nyquist plot indicated a higher resistance of corrosion and a slower corrosion rate of alloys.Alloys had bigger radius of Nyquist plot also exhibited smaller weight loss after 120 min immersion.The Bode plot also shows a good consistency with weight loss after 120 min immersion,i.e.,the alloys with a big weight loss always exhibited a small impedance magnitude(|Z|).Besides,the highest phase angle of alloys also increased with the corrosion resistance;alloys with small weight loss showed a higher phase angle,and this was similar with those reported in previous researches.39–42

Fig.11 Typical Nyquist plots and corresponding Bode plots of EIS tests of alloys AL1-AL6 after 120 min immersion in acidic 0.6 M NaCl solution.
In order to quantitatively estimate the EIS data,an equivalent electrical circuit was designed to best fit the experimental results,as displayed in Fig.12.The elements in the equivalent electrical circuit are defined as follows:Rsis the solution resistance,Qhfassociates with the capacitance of corrosion products or precipitated salt layers at high frequency,Rhfis the high-frequency resistance corresponding to the resistance of corrosion products or some precipitated salts films on corroded metal surface,Rctis the charge transfer resistance at active corroded surface within low frequency range,and Qlfassociates with interfacial capacitance of the new interface originated from corrosion,which is parallel to the charge transfer resistance.43–45

Fig.12 Equivalent circuit used to fit EIS test data.
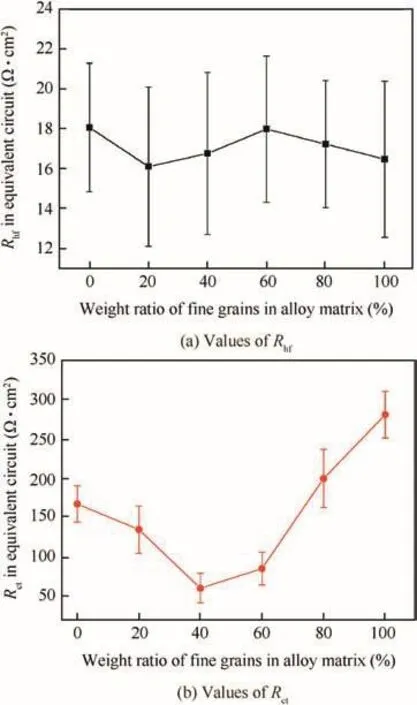
Fig.13 Fitted values of Rhfand Rctof alloys after 120 min immersion.
Fig.13 shows the fitted Rhfand Rctof sintered alloys AL1-AL6 as a function offine(coarse)grains’content.The Rhfhad no certain relationship with the content of coarse or fine grains,and it was about ten to twenty ohms for every alloy.Besides,Rhfhad a smaller value than Rct,indicating that it did not determine the general corrosion rate.However,the Rcthad a good consistency with the weight loss of alloys,i.e.,it showed small values for alloys with big weight loss.The AL3 had the smallest Rct,while AL6 had the biggest one.Because of the bigger size,higher area fraction and higher content of alloying elements of second phases in coarse grains,the AL1 showed a more severe electrochemical heterogeneity and thus a smaller Rctcompared to AL6.The mixture of coarse and fine grains also increased the electrochemical heterogeneity of alloys.Therefore,AL2-AL4 exhibited smaller Rctthan AL1.The increased mixture degree of coarse and fine grains would deteriorate alloys’corrosion resistance and increase corrosion rate.
4.Conclusions
(1)The 7075 alloys prepared in this work contain different weight ratios of coarse and fine grains.The corrosion susceptibility and dissolution rate of sintered alloys show significant dependence on microstructure and microchemistry of alloys.The mixture of coarse and fine grains as well as the second phase can increase electrochemical heterogeneity and promote corrosion propagation.
(2)In coarse grains,66.38%of the intermetallic particles are rich in Cu and Fe which act as cathode during corrosion;23.22%of the particles are η-phase and its analogues which act as anode during corrosion.However in fine grains,the corresponding percentages of cathodic phases and η-phase are 55.03%and 36.96%,respectively.The area fraction of second phase is 4.06%and 1.78%in coarse and fine grains,respectively.
(3)Compared to those in fine grains,intermetallic particles in coarse grains have bigger size,more continuous feature,higher area fraction and lower population density.In coarse grains,both anodic and cathodic particles contain more alloying elements.These features increase the cathodic reduction rate of hydrogen ions on Cu and Fe rich particles,and thus accelerate the corrosion rate.
(4)The final order of weight loss of alloys from big to small is AL3,AL4,AL2,AL1,AL5 and AL6 after 180 min immersion.The mixture of coarse and fine grains can increase the electrochemical heterogeneity significantly,and thus promote the corrosion propagation remarkably.The electrochemical tests are well consistent with the immersion test.Alloys have big weight loss also show big icorrand low corrosion resistance.
Acknowledgements
This research is supported by the Innovation Foundation of BUAA for PhD Graduates,and the National Natural Science Foundation of China(NSFC)under Grant No.51271012.
1.Knight SP,Pohl K,Holroyd NJH,Birbilis N,Rometsch PA,Muddle BC,et al.Some effects of alloy composition on stress corrosion cracking in Al-Zn-Mg-Cu alloys. Corros Sci 2015;98:50–62.
2.Ryl J,Wysocka J,Jarzynka M,Zielinski A,Orlikowski J,Darowicki K.Effect of native air-formed oxidation on the corrosion behaviour of AA 7075 aluminum alloys.Corros Sci 2014;87:150–5.
3.Guo LG,Yang S,Yang H,Zhang J.Processing map of as-cast 7075 aluminum alloy for hot working.Chin J Aeronaut 2015;28(6):1774–83.
4.Su JX,Ma MY,Wang TJ,Guo XM,Hou LG,Wang ZP.Fouling corrosion in aluminum heat exchangers.Chin J Aeronaut 2015;28(3):954–60.
5.Tian W,Hu J,Liao WH,Bu Y,Zhang L.Formation ofinterlayer gap and control ofinterlayer burr in dry drilling of stacked aluminum alloy plates.Chin J Aeronaut 2016;29(1):283–91.
6.Chen X,Tian WM,Li SM,Yu M,Liu JH.Effect of temperature on corrosion behavior of 3003 aluminum alloy in ethylene glycol–water solution.Chin J Aeronaut 2016;29(4):1142–50.
7.Deng Y,Ye R,Xu G,Yang J,Pan Q,Peng B,et al.Corrosion behaviour and mechanism of new aerospace Al-Zn-Mg alloy friction stir welded joints and the effects of secondary Al3ScxZr1-xnanoparticles.Corros Sci 2015;90:359–74.
8.Bertoncello JCB,Manhabosco SM,Dick LFP.Corrosion study of the friction stir lap joint of AA7050-T76511 on AA2024-T3 using the scanning vibrating electrode technique. Corros Sci 2015;94:359–67.
9.Tian W,Li S,Chen X,Liu J,Yu M.Intergranular corrosion of spark plasma sintering assembled bimodal grain sized AA7075 aluminum alloys.Corros Sci 2016;107:211–24.
10.Tian W,Li S,Wang B,Liu J,Yu M.Pitting corrosion of naturally aged AA 7075 aluminum alloys with bimodal grain size.Corros Sci 2016;113:1–16.
11.Chemin A,Marques D,Bisanha L,Mothe o ADJ,Bose Filho COF,Ruchert COF.Influence of Al7Cu2Fe intermetallic particles on the localized corrosion of high strength aluminum alloys.Mater Des 2014;53:118–23.
12.Cavanaugh MK,Li JC,Birbilis N,Buchheit RG.Electrochemical characterization of intermetallic phases common to aluminum alloys as a function of solution temperature.J Electrochem Soc 2014;161(12):C535–43.
13.Song F,Zhang X,Liu S,Tan Q,Li D.The effect of quench rate and overageing temper on the corrosion behaviour of AA7050.Corros Sci 2014;78:276–86.
14.Song FX,Zhang XM,Liu SD,Tan Q,Li DF.The effect of quench transfer time on microstructure and localized corrosion behaviour of 7050–T6 Al alloy.Mater Corros 2014;65(10):1007–16.
15.Chen JF,Frankel GS,Jiang JT,Shao WZ,Zhen L.Effect of ageforming on corrosion properties of an Al-Zn-Mg-Cu alloy.Mater Corros 2014;65(7):670–7.
16.Godard D,Archambault P,Aeby-Gautier E,Lapasset G.Precipitation sequences during quenching of the AA 7010 alloy.Acta Mater 2002;50(9):2319–29.
17.Chen SY,Chen KH,Peng GS,Liang X,Chen XH.Effect of quenching rate on microstructure and stress corrosion cracking of 7085 aluminum alloy.Trans Nonferrous Met Soc China 2012;22(1):47–52.
18.Deng Y,Wan L,Zhang Y,Zhang X.Influence of Mg content on quench sensitivity of Al-Zn-Mg-Cu aluminum alloys.J Alloys Compd 2011;509(13):4636–42.
19.Liu SD,Chen B,Li CB,Dai Y,Deng YL,Zhang XM.Mechanism of low exfoliation corrosion resistance due to slow quenching in high strength aluminium alloy.Corros Sci 2015;91:203–12.
20.Marlaud T,Malki B,Henon C,Deschamps A,Baroux B.Relationship between alloy composition,microstructure and exfoliation corrosion in Al-Zn-Mg-Cu alloys.Corros Sci 2011;53(10):3139–49.
21.Xu R,Li L,Zhang L,Zhu B,Liu X,Bu X.Influence of pressure and surface roughness on the heat transfer efficiency during water spray quenching of 6082 aluminum alloy.J Mater Process Technol 2014;214(12):2877–83.
22.Lin J,Liao H,Jehng W,Chang C,Lee S.Effect of heat treatments on the tensile strength and SCC-resistance of AA7050 in an alkaline saline solution.Corros Sci 2006;48(10):3139–56.
23.Xu DK,Birbilis N,Rometsch PA.The effect of pre-ageing temperature and retrogression heating rate on the strength and corrosion behaviour of AA7150.Corros Sci 2012;54:17–25.
24.Gupta RK,Fabijanic D,Zhang R,Birbilis N.Corrosion behaviour and hardness ofin situ consolidated nanostructured Al and Al–Cr alloys produced via high-energy ball milling.Corros Sci 2015;98:643–50.
25.Ma Y,Zhou X,Huang W,Thompson GE,Zhang X,Luo C,et al.Localized corrosion in AA2099-T83 aluminum–lithium alloy:the role ofintermetallic particles.Mater Chem Phys 2015;161:201–10.26.Orlov D,Fujiwara H,Ameyama K.Obtaining copper with harmonic structurefor the optimal balance of structure-performance relationship.Metall Trans 2013;54(9):1549–53.
27.Zhang Z,Vajpai SK,Orlov D,Ameyama K.Improvement of mechanical properties in SUS304L steel through the control of bimodal microstructure characteristics. Mater Sci Eng:A 2014;598:106–13.
28.Sekiguchi T,Ono K,Fujiwara H,Ameyama K.New microstructure design for commercially pure titanium with outstanding mechanical properties by mechanical milling and hot roll sintering.Metall Trans 2010;51(1):39–45.
29.Tian WM,Li SM,Wang B,Chen X,Liu JH,Yu M.Graphenereinforced aluminum matrix composites prepared by spark plasma sintering.Int J Miner Metall Mater 2016;23(6):723–9.
30.Peng G,Chen K,Chen S,Fang H.Influence of repetitious-RRA treatment on the strength and SCC resistance of Al-Zn-Mg-Cu alloy.Mater Sci Eng:A 2011;528(12):4014–8.
31.Liu D,Xiong B,Bian F,Li Z,Li X,Zhang Y,et al.Quantitative study of nanoscale precipitates in Al–Zn–Mg–Cu alloys with different chemical compositions. Mater Sci Eng: A 2015;639:245–51.
32.Liu J,Li H,Li D,Wu Y.Application of novel physical picture based on artificial neural networks to predict microstructure evolution of Al–Zn–Mg–Cu alloy during solid solution process.Trans Nonferrous Met Soc China 2015;25(3):944–53.
33.Xiao Y,Pan Q,Li W,Liu X,He Y.Influence of retrogression and re-aging treatment on corrosion behaviour of an Al-Zn-Mg-Cu alloy.Mater Des 2011;32(4):2149–56.
34.Birbilis N,Buchheit RG.Investigation and discussion of characteristics for intermetallic phases common to aluminum alloys as a function of solution pH.J Electrochem Soc 2005;152(3):C117–26.
35.Huang LP,Chen KH,Li S,Song M.Influence of high-temperature pre-precipitation on local corrosion behaviours of Al-Zn-Mg alloy.Scr Mater 2007;56(4):305–8.
36.Adler PN,Delasi R,Geschwind G.Influence of microstructure on the mechanical properties and stress-corrosion susceptibility of 7075 aluminum alloy.Metall Trans 1972;3:3191–200.
37.Liang WJ,Rometsch PA,Cao LF,Birbilis N.General aspects related to the corrosion of 6xxx series aluminium alloys:Exploring the influence of Mg/Si ratio and Cu.Corros Sci 2013;76:119–28.
38.Puiggali M,Zielinski A,Olive JM,Renauld E,Desjardins D,Cid M.Effect of microstructure on stress corrosion cracking of an Al–Zn–Mg–Cu alloy.Corros Sci 1998;40(4–5):805–19.
39.Touzain S.Some comments on the use of the EIS phase angle to evaluate organic coating degradation.Electrochim Acta 2010;55(21):6190–4.
40.Zuo Y,Pang R,Li W,Xiong JP,Tang YM.The evaluation of coating performance by the variations of phase angles in middle and high frequencydomainsofEIS.CorrosSci2008;50(12):3322–8.
41.Collazo A,Figueroa R,No´voa XR,PÉrez C.Corrosion of electrodeposited Sn in 0.01 M NaCl solution.A EQCM and EIS study.Electrochim Acta 2016;202:288–98.
42.Maocheng YAN,Xu J,Yu LB,Wu TQ,Sun C,Ke W.EIS analysis on stress corrosion initiation of pipeline steel under disbonded coating in near-neutral pH simulated soil electrolyte.Corros Sci 2016;110:23–34.
43.Su J,Zhang Z,Shi Y,Yang Z,Zhang J,Cao C.The effect of applied tensile stress on the exfoliation corrosion of 7075–T6 alloy.Mater Corros 2006;57(9):729–33.
44.Cao FH,Zhang Z,Li JF,Cheng YL,Zhang JQ,Cao CN.Exfoliation corrosion of aluminum alloy AA7075 examined by electrochemical impedance spectroscopy.Mater Corros 2004;55(1):18–23.
45.Li JF,Jia ZQ,Li CX,Birbilis N,Cai C.Exfoliation corrosion of 7150 Al alloy with various tempers and its electrochemical impedance spectroscopy in EXCO solution.Mater Corros 2009;60(6):407–14.
18 November 2016;revised 21 March 2017;accepted 13 April 2017
Available online 7 June 2017
7075 aluminum alloy;
Corrosion;
Spark plasma sintering;
Transmission electron microscope
*Corresponding author.
E-mail address:Songmei_li@buaa.edu.cn(S.LI).
Peer review under responsibility of Editorial Committee of CJA.
Production and hosting by Elsevier
http://dx.doi.org/10.1016/j.cja.2017.06.001
1000-9361©2017 Production and hosting by Elsevier Ltd.on behalf of Chinese Society of Aeronautics and Astronautics.This is an open access article under the CC BY-NC-ND license(http://creativecommons.org/licenses/by-nc-nd/4.0/).
©2017 Production and hosting by Elsevier Ltd.on behalf of Chinese Society of Aeronautics and Astronautics.This is an open access article under the CC BY-NC-ND license(http://creativecommons.org/licenses/by-nc-nd/4.0/).
猜你喜欢
长江科学院院报(2022年8期)2022-08-30
农业工程学报(2022年10期)2022-08-22
煤炭工程(2022年7期)2022-07-21
大庆石油地质与开发(2022年2期)2022-04-09
电脑迷(2021年4期)2021-12-06
土壤学报(2020年6期)2021-01-05
深圳大学学报(理工版)(2020年6期)2020-11-11
舰船电子对抗(2019年5期)2019-12-04
科学与财富(2018年12期)2018-06-11
电脑知识与技术(2016年8期)2016-05-19
 CHINESE JOURNAL OF AERONAUTICS2017年5期
- CHINESE JOURNAL OF AERONAUTICS的其它文章
- Effect of an end plate on surface pressure distributions of two swept wings
- Determination of a suitable set of loss models for centrifugal compressor performance prediction
- Blade bowing eff ects on radial equilibrium ofinlet flow in axial compressor cascades
- A model offlow separation controlled by dielectric barrier discharge
- Research on parafoil stability using a rapid estimate model
- Transonic buff et control research with two types of shock control bump based on RAE2822 airfoil