
Synthesis of Ag-decorated vertical graphene nanosheets and their electrocatalytic efficiencies
2022-06-01 07:55JialiCHEN陈佳丽PeiyuJI季佩宇MaoyangLI李茂洋TianyuanHUANG黄天源LanjianZHUGE诸葛兰剑andXuemeiWU吴雪梅
Plasma Science and Technology 2022年5期
Jiali CHEN (陈佳丽), Peiyu JI (季佩宇), Maoyang LI (李茂洋),Tianyuan HUANG (黄天源), Lanjian ZHUGE (诸葛兰剑) and Xuemei WU (吴雪梅),*
1 School of Physical Science and Technology and Collaborative Innovation Center of Suzhou Nano Science and Technology, Soochow University, Suzhou 215006, People’s Republic of China
2 The Key Laboratory of Thin Films of Jiangsu,Soochow University,Suzhou 215006,People’s Republic of China
3 Analysis and Testing Center, Soochow University, Suzhou 215123, People’s Republic of China
Abstract Herein we report the successful preparation of silver(Ag)-decorated vertically oriented graphene sheets (Ag/VGs) via helicon wave plasma chemical vapor deposition (HWP-CVD) and radiofrequency plasma magnetron sputtering (RF-PMS).VGs were synthesized in a mixture of argon and methane(Ar/CH4)by HWP-CVD and then the Ag nanoparticles on the prepared VGs were modified using the RF-PMS system for different sputtering times and RF power levels.The morphology and structure of the Ag nanoparticles were characterized by scanning electron microscopy and the results revealed that Ag nanoparticles were evenly dispersed on the mesoporous wall of the VGs.X-ray diffraction results showed that the diameter of the Ag particles increased with the increase in Ag loading,and the average size was between 10.49 nm and 25.9 nm, consistent with the transmission electron microscopy results.Ag/VGs were investigated as effective electrocatalysts for use in an alkaline aqueous system.Due to the uniquely ordered and interconnected wall structure of VGs,the area of active sites increased with the Ag loading, giving the Ag/VGs a good performance in the oxygen evolution reaction.The double-layer capacitance(Cdl)of the Ag/VGs under different Ag loadings were studied,and the results showed that the highest Ag content gave the best Cdl (1.04 mF cm-2).Our results show that Ag/VGs are likely to be credible electrocatalytic materials.
Keywords: Ag/VGs, helicon wave plasma, radiofrequency plasma magnetron sputtering
1.Introduction
Driven by the demand for more active and stable metal/carbon catalysts, in the past 10 years, researchers have made great efforts to explore new types of carbon nanomaterials as catalyst carriers, including mesoporous carbon (MFC) [1-3], carbon nanotubes (CNTs) [4-8], carbon nanofibers [9], graphene nanosheets(GNSs) [10], carbon nano coils[11] and vertically oriented graphene sheets (VGs)/carbon nanowalls [12-16].Among these, VGs with a high surface-to-volume ratio, vertical orientation and exposed sharp edges used as catalyst carriers have recently attracted more and more attention.This is attributed to the ability to stabilize active metal particles and disperse the catalyst nanoparticles.VGs have a wide range of applications, such as in biosensors and gas sensors, field electron emission, atmospheric nanoscale corona discharges,electrocatalysts, supercapacitors, lithium-ion batteries, surfaceenhanced Raman spectroscopy (SERS), fuel cells (catalyst support) and solar cells [11, 13, 17-20].VGs as a type of catalyst provide significant benefits in structural integration for electrochemical research.Compared with other three-dimensional(3D)graphene structures such as graphene foams(GFs)[11],VGs have the advantages of good mechanical stability,a large specific surface area and a large porosity.VGs also have the following additional advantages[11]:rich sharp edges that are more directly exposed to the electrolyte, which is conducive to electrocatalytic applications and improves electrode reaction kinetics and mass transfer,and a labyrinthine structure that makes the graphene nanosheets unaggregated and stable.The application of VGs is also diverse because they can be easily modified with other active materials.
Silver (Ag) nanoparticles supported on various carbon materials have been extensively studied as catalysts for the oxygen reduction reaction (ORR) [21-23].One of the main reasons is that Ag-modified carbon material is the most likely material to replace platinum-based material.At present, there are many studies on the modification of graphene with noble metal nanoparticles but there are not many reports that utilize VGs.Nano Ag-modified graphene oxide has been widely used in catalysis, electrochemical sensing and surfaceenhanced Raman scattering(SERS)substrates.Therefore,it is useful to study Ag nanoparticle-modified VGs.
However, in practical applications, there are still challenges and limitations in the implementation of VGs.The height (or thickness) of VGs is usually less than 1 μm.Even with the assistance of substrate bias,their maximum height can only be about 5 μm[11].Moreover,it is still a challenging task to load the active materials evenly on the surface of VGs.
Our team has mastered the methods of regulating the growth structure of VGs.The deposition time was controlled to control the height of the VGs.By modulating the change in gas flow rate, the structure size and wall spacing of the VGs were changed.VGs with a height of 259.8 nm can be prepared in a minute without substrate bias and the detailed preparation method is presented in this paper [24].Also, we introduce the preparation of Ag/VGs by a helicon wave plasma chemical vapor deposition(HWP-CVD)method using a radiofrequency plasma magnetron sputtering (RF-PMS)system.VGs with a height of about 0.8 μm were prepared by the HWP-CVD method, and then Ag nanoparticles were sputtered on the prepared VGs by a magnetron sputtering system to complete the Ag nanoparticle-modified VGs.This preparation method did not produce toxic gases such as NO2or N2O4in the reaction.The composites prepared by this method were characterized for environmental friendliness and their oxygen evolution reactions (OERs) were analyzed.
2.Experimental setup
2.1.Sample preparation
Figure 1 is a diagram showing the preparation method for VGs modified with Ag.First,the VGs were directly grown on the silicon substrate by a homemade HWP-CVD system; the growth time was 3 min.The specific preparation method for VGs has been reported in the previous research results of our group [24].The prepared VGs were immediately placed into the sputtering chamber of the RF-PMS system for Ag sputtering.Once the VGs were in place,the RF-PMS system was pumped down to a background vacuum of 5.0×10⁻³Pa.When the background vacuum was reached, high-purity argon(Ar 99.999%)as the working gas was controlled by the flowmeter and entered the reaction chamber through the pipe.The experimental parameters for the RF-PMS system for sputtering Ag nanoparticles onto VG samples were as follows: 5.0 Pa for the working pressure, 80 W for the input power and as 1 min,3 min and 5 min for the sputtering times.In addition, a set of samples were prepared for 1 min sputtering at a sputtering power of 100 W.The four groups of prepared samples were labeled as Ag/VGs-80 W 1 min,Ag/VGs-80 W 3 min, Ag/VGs-80 W 5 min and Ag/VGs-100 W 1 min,respectively.The specific device diagram is shown in figure 2.The sputtering chamber was made of stainless steel with a diameter of 48 cm and had a distance of 5 cm between the substrate and the target to constitute a RF-PMS system.

Figure 1.Preparation diagram for vertical graphene sheets (VGs) modified with Ag.
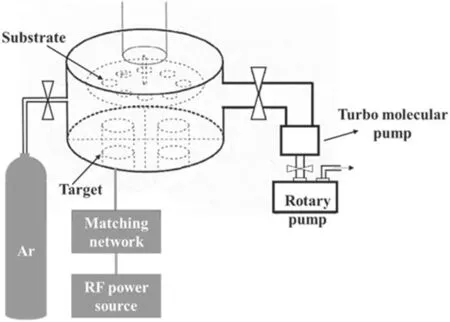
Figure 2.Schematic of the radiofrequency plasma magnetron sputtering system.
2.2.Characterization and electrochemical measurements
The surface morphologies of the five groups of samples were observed by scanning electron microscopy(SEM;Hitachi SU-8010), atomic force microscopy (AFM; Dimension Icon) and transmission electron microscopy (TEM; Tecnai G20 field emission).The crystalline structure of Ag/VGs was identified by x-ray diffraction (XRD) (Bruker D8 ADVANCE) using CuKα(λKα1= 1.5418 Å) as the radiation source.X-ray photoelectron spectroscopy (XPS; ESCALAB 250Xi) was employed for elemental analysis of the Ag/VGs.The Xplore PLUS Raman spectrometer(Horiba Company,Japan)was also used and the excitation wavelength was 532 nm.
The electrochemistry of the catalyst was tested in a typical three-electrode system using the Ag/VGs as the working electrode, a Pt foil for the counter electrode and a Ag/AgCl(saturated KCl solution) double junction for the reference electrode; the electrolyte was KOH solution (0.1 M).Before electrochemical tests, oxygen (O2) or nitrogen (N2) was bubbled into KOH (0.1 M) for at least 30 min to keep the KOH solution in an O2/N2saturated state.Linear sweep voltammetry (LSV) measurement conditions were as follows: scan rate 5 mV s-1, potential range 0.064-1.464 V [versus a reversible hydrogen electrode (RHE)] with a N2saturated electrolyte.Cyclic voltammograms (CVs) were recorded for the prepared samples at different scan rates from 20 to 120 mV s-1in the potential range of 0.914-1.014 V (versus a RHE).According to the Nernst equation, ERHE= EAg/AgCl+ 0.964,all potential data were represented by the RHE.
3.Results and discussion
In the sputtering system, the Ag sputtering deposition rate was closely related to sputtering power, sputtering time and working pressure.Also, the loading of Ag is calculated according to deposition rate, deposition time and Ag density[25].According to the previous experimental data, the sputtering deposition rates of Ag at 100 W and 80 W are 72.14 nm min-1and 44.80 nm min-1, respectively.The reason for the increase in Ag sputtering rate with an increase in RF power is attributed to the fact that the RF power increases the plasma density and produces more argon ions, leading to the increase in Ag bombardment frequency and deposition rate [26].
Figure 3(a)depicts the SEM results for the VGs and(b)-(e)show the SEM results for the Ag/VGs with different Ag loadings.The Ag loadings are 0.047 mg cm-2(Ag/VGs-80 W 1 min),0.076 mg cm-2(Ag/VGs-100 W 1 min),0.141 mg cm-2(Ag/VGs-80 W 3 min) and 0.235 mg cm-2(Ag/VGs-80 W 5 min), respectively.Compared with pure VGs without Ag particles, the other four groups of VGs were surrounded by welldispersed Ag nanoparticles.In addition, it can be seen from the four groups of figures that with the increase in Ag loading, the wall thickness of VGs also increased.The relatively large wall spacing facilitated the growth of Ag nanoparticles on the carbon skeleton framework.More structural details were obtained by AFM and TEM.The results show that the labyrinth structure of the VGs did not collapse and deform with the increase in Ag loading, indicating that the VGs have excellent structural strength.
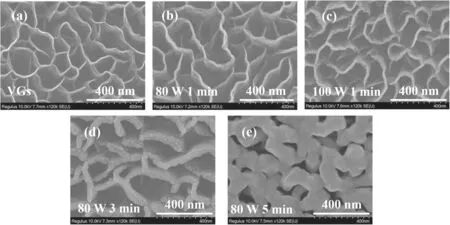
Figure 3.(a)-(e) SEM images of the VGs and Ag/VGs at different RF powers and deposition times.
Figure 4 shows AFM and TEM images of the synthesized Ag/VGs and pure VGs.Figures 4(a1),(b1)and(c)show the 3D AFM images and root mean square roughness (RMS)values of the Ag/VGs (80 W 3 min), pure VGs and Ag nanoparticles (80 W 3 min), respectively.The RMSs of pure VGs and Ag nanoparticles (80 W 3 min) were 8.7 nm and 3.2 nm, respectively, while the RMS of the Ag/VGs (80 W 3 min)was 22.1 nm.This meant that the roughness of the Ag/VGs increased compared with pure Ag nanoparticles and pure VGs.Figures 4(a2)and(b2)are TEM images of Ag/VGs and pure VGs, respectively.The change in roughness indicates that the Ag nanoparticles were not only attached to the carbon skeleton but were deposited on the upper surface using VGs as a template.The acquired TEM images (80 W 3 min) show that Ag particles were attached (the average size of Ag particles was about 20 nm, labeled by black arrows in figure 4(a2)) to graphene.

Figure 4.3D AFM image of (a1) Ag/VGs at 80 W 3 min, (b1) the VGs substrate and (c) Ag nanoparticles.The TEM of (a2) Ag-decorated VGs and (b2) bare VGs substrate.
XRD patterns for Ag/VGs electrodes are shown in figure 5(a).The diffraction peaks at 38.3°, 44.4°, 64.6° and 77.5° observed for Ag/VGs were attributed to the cubic Ag crystal planes(111),(200),(220)and(311)[27],respectively.The average size of Ag nanoparticles was calculated from the Ag (111) peak according to Scherrer’s formula

Figure 5.(a)XRD results for the films grown at different RF powers and deposition times.(b)Detailed Ag(111)peaks in the XRD patterns of Ag/VGs electrodes.(c)Raman spectra for the VGs and Ag/VGs grown for different times and different RF powers.(d)Crystallite size of Ag/VGs as a function of Ag loading.(e) ID/IG of VGs and Ag/VGs as a function of Ag loading.
where d is the average size of the Ag nanoparticles,λKα1is the x-ray wavelength (0.15406 nm),θmaxis the maximum angle of the (111) peak andB2θis the half-peak width for Ag (111) in radians.The mean particle sizes of the different Ag/VGs electrodes were 25.90 nm for Ag/VGs-80 W 5 min, 20.47 nm for Ag/VGs-80 W 3 min,10.49 nm for Ag/VGs-100 W 1 min and 13.59 nm for Ag/VGs-100W 1 min, consistent with the corresponding TEM results.However,calculated grain sizes did not always agree with the TEM results, which may be because XRD includes the average density of the entire sample while TEM includes the average grain size based on specific counting information [28, 29].With an increase in time and power, the size of Ag nanoparticles also increased.
To determine the effect of Ag nanoparticles on the vibration and structural properties of VGs, Raman spectra were recorded.Figure 5(c) shows the representative Raman spectra for the pristine VGs and Ag-decorated VGs.Figures 5(d)and(e)show the results for crystallite size and of ID/IGfor samples with different Ag loadings, respectively.The crystallite size increased with an increase in Ag loading.The D band(~1342 cm-1)and G band(~1587 cm-1)indicate the disorder and crystallinity of sp2carbon materials,respectively [30].Decoration of the VGs with Ag led to the following changes in the Raman spectra.The broadening of the G peak may be caused by the synergistic effect of strain and doping [31].The change in Raman signal is attributed to the significant charge transfer at the Ag/graphene interface and the surface induced by plasma-active Ag nanoparticles,which changes the Raman scattering phenomenon [32, 33].The intensity ratio of the D to G bands (ID/IG) for the Ag/VGs(1.16-1.47)was lower than that of undoped VGs(2.88),indicating that the degree of graphitization of Ag/VGs was higher [34].
The surface elemental composition and chemical state of the VGs and Ag/VGs were analyzed by XPS.Figure 6 presents the survey scan XPS spectra of the synthesized Ag/VGs.The sample contained C, O and Ag, with a sharp photoelectron peak appearing at a binding energy of 288 eV(C 1 s), a strong photoelectron peak at about 367 eV (Ag 3d)and a weak photoelectron peak at 532 eV(O 1 s).The Ag 3d spectrum shows the typical Ag 3d5/2and 3d3/2doublets with binding energies of 367.2 and 373.2 eV[27,35],respectively.These doublets are typical of Ag spectra [36].This demonstrated that the Ag nanoparticles were deposited on VGs during the magnetron sputtering process.
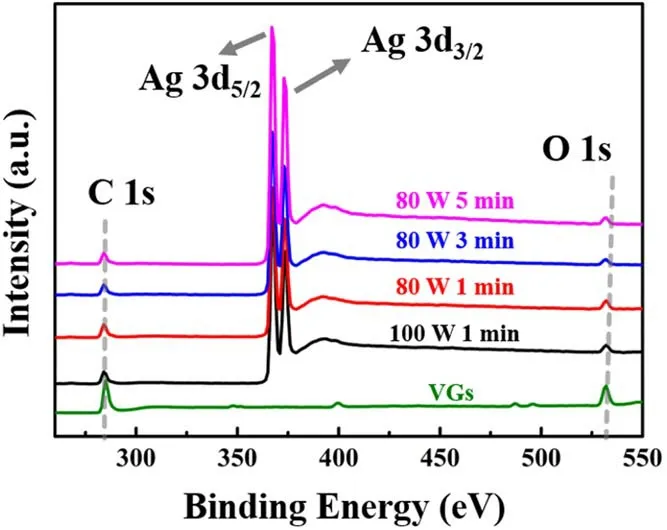
Figure 6.XPS spectra of VGs and Ag/VGs at different sputtering conditions.
The electrocatalytic performance of the VGs with different Ag loadings for the ORR/OER was measured in N2-saturated 0.1 M KOH and compared with that of pure VGs.The CVs of the Ag/VGs and VGs are shown in figure 7(a) at 50 mV s-1.The four groups of Ag/VGs have prominent oxygen reduction peaks in the N2-saturated electrolyte, but these peaks are not in the CVs for the VGs,revealing that the Ag/VGs have intrinsic OER catalytic activities.The cathodic peak of Ag/VGs-80 W 3 min(1.10 V versus RHE)was located at a more positive position than that of the prepared Ag/VGs-80 W 1 min (1.08 V versus RHE)and Ag/VGs-100 W 1 min (0.95 V versus RHE) samples.This meant that the Ag/VGs-80 W 3 min sample had the best ORR catalytic activity among our prepared catalysts[37].The reduction peak current of Ag/VGs-80 W 5 min was 7.83 mA cm-2,which was three times higher than that of Ag/VGs-80 W 3 min (2.57 mA cm-2) and six times higher than that of Ag/VGs-80 W 1 min (1.38 mA cm-2).

Figure 7.(a)CVs of prepared samples and VGs substrate recorded in N2-saturated 0.1 M KOH at 50 mV s-1.(b)-(e)CVs of the Ag/VGs at different scan rates from 20 to 120 mV s-1 in the potential range of 0.914-1.014 V versus RHE.
Figures 7(b)-(e) show CVs of the Ag/VGs at different scan rates from 20 to 120 mV s-1in the potential range of 0.914-1.014 V (versus RHE).The double-layer capacitances(Cdl)of the four groups of prepared Ag/VGs samples were also measured by CVs at different scan rates from 20 to 120 mV s-1(figure 8(a)).Figure 8(b)shows that Ag/VGs-80 W 5 min had a Cdlvalue of 1.04 mF cm-2, superior to that of Ag/VGs-80 W 3 min (0.80 mF cm-2) and Ag/VGs-80W 1 min (0.71 mF cm-2).Because the Ag/VGs-80 W 5 min sample had a higher Ag loading,this implied a larger specific surface area for electrochemical activity.
Figure 8(c) shows the corresponding OER polarization curves when the scan rate was 5 mV s-1.The relative current density came from the normalization of the geometric surface area of the electrode.The LSVs of the three samples suggested two different OER stages in the range of 1.1-1.9 V.In addition, the Tafel curves obtained by the linear fitting of the polarization curves were used to evaluate the catalytic kinetics of the samples.Figure 8(d) shows the corresponding Tafel plots in the potential region 1.58 < E < 1.70 V(versus RHE)obtained from the OER polarization curves (figure 8(c)).The Tafel slope of the Ag/VGs-100 W 1 min sample was 87.52 mV dec-1(figure 8(d)) smaller than the other samples,demonstrating that Ag/VGs-100 W 1 min had more facile kinetics for OER.Therefore,the lower Tafel slope of the Ag/VGs-100 W 1 min sample had markedly favorable OER kinetics in alkaline solutions.The OER in a solution of KOH is as follows:
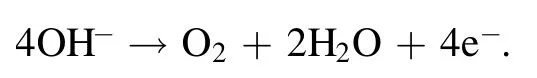

Figure 8.(a)The electrochemical double-layer capacitances of the Ag/VGs toward the OER.(b)The values of the double-layer capacitances.(c)LSV results in 0.1 M KOH of three typical samples in the OER region.(d)Tafel plots obtained from the corresponding OER LSV results.
The results showed that the Tafel slope of the Ag/VGs-100 W 1 min sample at 87.52 mV dec-1was less than that of the other Ag/carbon frameworks [38], indicating faster reaction kinetics[39].The OER electrocatalytic activity of the Ag/VGs-100 W 1 min sample was higher than that of the others,for the following reasons.(1)Due to the uniqueness of VGs,Ag nanoparticles(100 W 1 min)are highly dispersed on the wall surface of VGs.With the increase in sputtering time,for example Ag/VGs-80 W 5 min, more Ag particles adhere to the top of the wall surface of VGs to form an accumulation,and there are no more Ag nanoparticles dispersed on the wall of the VGs.The change of top SEM morphology in figure 3(e) also confirms this.This explains why the OER catalytic activity of Ag/VGs-80 W 5 min was not as high as that of Ag/VGs-100 W 1 min(2)The facile transport of ions and molecules through the VGs because of a highly ordered structure with interconnected walls facilitates access of the reactants to the active sites [40-43].These results confirmed that Ag loading has an important effect on OER/ORR performance and that Ag is the key to obtaining improved kinetics.
4.Conclusion
In conclusion, Ag-decorated vertical graphene nanosheets(Ag/VGs) catalysts were successfully prepared by a HWPCVD system with RF-PMS technology.The results of SEM and XRD showed that the average size of the loaded Ag particles ranges from 10.49 to 25.90 nm, and they were uniformly dispersed in the mesopore walls of the VGs.The OER performance of Ag/VGs benefited from uniquely ordered and interconnected high walls of the VGs, conducive to high Ag particle dispersion and facile mass/charge transport.In addition,OER results also showed that the catalytic activity of the Ag/VGs was related not only to the loaded Ag particles but also to whether the Ag particles could be highly dispersed on the wall surface of the VGs.With the increase in Ag loading, the samples prepared at 80 W for 5 min have an excellent Cdlvalue (1.04 mF cm-2).In addition, these results show that the Ag/VGs samples are expected to be an excellent bipolar electrode material.It is necessary to further study Ag/VGs, which could be a substitute for platinumdecorated carbon materials.
Acknowledgments
This work is supported by National Natural Science Foundation of China (No.11975163), the Project Funded by the Priority Academic Program Development of Jiangsu Higher Education Institutions (PAPD).
猜你喜欢
中学生博览(2021年11期)2021-07-15
中学生博览(2021年13期)2021-07-14
中学生博览(2021年3期)2021-03-08
中学生博览(2021年1期)2021-03-04
少儿科技(2021年4期)2021-01-11
造纸信息(2019年7期)2019-09-10
故事作文·高年级(2018年11期)2018-11-19
中学课程辅导·教学研究(2017年11期)2017-09-23
爆笑show(2015年3期)2015-05-08
 Plasma Science and Technology2022年5期
- Plasma Science and Technology的其它文章
- Upgrade of an integrated Langmuir probe system on the closed divertor target plates in the HL-2A tokamak
- Numerical study of atmospheric-pressure argon plasma jet propagating into ambient nitrogen
- Effects of O2 addition on the plasma uniformity and reactivity of Ar DBD excited by ns pulsed and AC power supplies
- Design and first result of combined Langmuir-magnetic probe on J-TEXT tokamak
- Selective catalytic reduction of NOx with NH3 assisted by non-thermal plasma over CeMnZrOx@TiO2 core-shell catalyst
- A GPU-based general numerical framework for plasma simulations in terms of microscopic kinetic equations with full collision terms