
Numerical study of atmospheric-pressure argon plasma jet propagating into ambient nitrogen
2022-06-01 07:55YuanyuanJIANG蒋园园YanhuiWANG王艳辉YaminHU胡亚敏JiaoZHANG张佼andDezhenWANG王德真
Plasma Science and Technology 2022年5期
Yuanyuan JIANG (蒋园园), Yanhui WANG (王艳辉), Yamin HU (胡亚敏),Jiao ZHANG (张佼) and Dezhen WANG (王德真)
Key Laboratory of Materials Modification by Laser, Ion and Electron Beams (Ministry of Education),School of Physics, Dalian University of Technology, Dalian 116024, People’s Republic of China
Abstract A 2D axial symmetry fluid model is applied to study the features of an atmospheric-pressure argon (Ar) plasma jet propagating into ambient nitrogen (N2) driven by a pulsed voltage,emphasizing the influence of gas velocity on the dynamic characteristics of the jet.The results show that the Ar jet exhibits a cylindrical-shaped channel and the jet channel gradually shrinks with the increase in propagation length.The jet propagation velocity varies with time.Inside the dielectric tube, the plasma jet accelerates propagation and reaches its maximum value near the nozzle.Exiting the tube, its velocity quickly decreases and when approaching the metal plane,the decrease in jet velocity slows down.The increase in gas speed results in the variation of jet spatial distribution.The electron density presents a solid structure at lower gas flow speeds,whereas an annular structure can be observed under the higher gas flow velocity in the ionization head.The jet length increases with the flow velocity.However,when the flow velocity exceeds a critical value, the increase in the rate of the plasma jet length slows down.In addition, the gas velocity effect on the generation and transport of the reactive particles is also studied and discussed.
Keywords:atmospheric-pressure argon plasma jet,gas flow velocity,2D simulation,propagation characteristics, reactive species
1.Introduction
Atmospheric-pressure plasma jets (APPJs) have attracted tremendous attention due to their unique application advantages in environmental and biomedical fields, and have become an important research direction in the plasma field in recent years [1, 2].In APPJs, noble gases (mainly helium(He)and argon(Ar))are the most commonly used feed gases for generating plasma jets [3-13].It is known that the ionization and excitation energy of Ar are lower than those of He.Thus,the Penning ionization induced by Ar metastable is lower, which results in different jet behavior for these two feed gases.Some researchers have paid much attention to studying the basic features of He and Ar jets.For example,Shao et al [14] experimentally studied the properties of He and Ar jets driven by microsecond pulses.They found that,under the same conditions, the He jet presents a glow discharge and the Ar jet exhibits many filaments.Although the He jet is about twice as long as the Ar jet, a higher concentration of reactive particles can be obtained in the Ar jet.However, both He and Ar jets behave differently under different operating conditions.Driven by a low-frequency power source, the He jet is longer than the Ar jet.This behavior is opposite to the results of APPJs generated by radio frequency power sources [15].Currently, the majority of studies of APPJs use He as the carrier gas because a stable glow discharge with low gas temperature can be produced in He for a wide range of operating conditions.However,since He is the more expensive noble gas, the He jet cannot be widely utilized in industrial applications [14, 16].In contrast, Ar is relatively inexpensive and an Ar jet can produce more active species.Thus, it is suitable to apply Ar instead of He in APPJs.Therefore, in-depth investigation of the kinetic properties of an Ar jet under various conditions is of great importance.
It is known that when the APPJ propagates in ambient air, it can generate abundant reactive particles, including reactive oxygen and nitrogen species.These reactive particles can directly or indirectly interact with the treated surface to achieve the purpose of treatment [17, 18].Different reactive particles play different roles in applications.For instance,OH radicals can remove oil, O and O3particles with strong oxidizing properties play an important role in wastewater treatment and deodorization, while NO is vital in wound healing and can kill fungi, bacteria and parasites.However, these particles may play a negative role in other applications[17, 19].Therefore, it is essential to reasonably adjust the working gas and control the propagation environment of the jet to produce the desired active species for the specific application requirements.A shielding gas curtain device is thus developed to shield the inflow of the ambient species[20-22].This device can control the type of reactive species through adjusting the shielding gas component.At present,plasma jets propagating in different ambient gases, such as O2, N2and Ar, have been investigated [8, 23-25].However,compared with plasma jets propagating in the air,there is still a lack of understanding of plasma jets propagating in N2.
In this work,the kinetic features of an Ar jet propagating in N2environment and reactive particle generation are investigated in detail based on the 2D fluid model.The gas velocity effect on the Ar jet is analyzed and discussed.
2.Model description
The discharge device used in our simulation is shown in figure 1.Because of the axisymmetric structure of the model,only the right half of the simulated region is shown (see figure 1(a)) [24, 26, 27].The detailed discharge device is exhibited in figure 1(b).The width and length of the ring electrode are 0.1 and 1 mm, respectively.The distance of the ring electrode from the central axis and the nozzle is 1.5 and 4 mm, respectively.The inner and outer radiuses of the dielectric tube are 1 and 5 mm, respectively.The relative permittivity of the tube is 2, corresponding to the material of PETG [28].The pulse voltage used in the simulation is presented in figure 1(c).The total duration time of the voltage is 25 ns with a peak of 10 kV.The rising edge of the voltage is 10 ns, followed by 15 ns at the peak value.Ar gas is applied as the feed gas and enters the dielectric tube through the inlet AB.N2is used as the shielding gas.After the Ar leaves the tube, it starts to mix with the surrounding N2.

Figure 1.Simulation geometry region (a), discharge device schematic (b), and applied voltage (c) used in our simulation.
2.1.Neutral gas flow model
The neutral gas flow model includes a Navier-Stokes equation(equation (1)) and mass transfer equation (equation (2)):

whereρindicates the mixture gas density(Ar:1.7837 kg·m-3,N2:1.25 kg·m-3at ambient pressure(1 atm)),urepresents the velocity vector,prefers to the pressure,μrepresents the mixture dynamics viscosity (Ar: 2.27×10⁻⁵Pa·s, N2:2.07×10⁻⁵Pa·s),Frepresents the body force,wiis the speciesimass fraction andJiindicates its diffusion flux.Under the laminar flow condition,Ji= -ρDi∇wi,in whichDrefers to the diffusion coefficient.The boundary conditions used in this section are listed in table 1.
2.2.Plasma dynamics model
Plasma dynamics is usually described via classical fluid equations, including the continuity equation (equation (3)),with the drift-diffusion approximation(equation(4)),electron energy conservation equation (equation (5)) and Poissonequation (equation (6)).The specific equations read:

Table 1.The boundary conditions for the neutral gas flow model.The velocity component ur indicates the axial velocity;uz represents the radial velocity component.

wherene,i,mindicates the species density, where the symbols e, i and m refer to the electrons, ions and metastable species,respectively,Γe,i,mis the particle flux,Se,i,mrefers to the gain/loss rate,qrepresents the charge,μe,i,mindicates the mobility coefficients,Eindicates the electric field,De,i,mrefers to the diffusion coefficient,ε0represents the vacuum permittivity,εrindicates the dielectric material’s relative permittivity,Φ indicates the electric potential,nεrefers to the energy density of the electron, the energy loss is described byΔE,Kinelrepresents the inelastic collision reaction rate,meindicates the electron mass andMrefers to the atom mass,kbrepresents the Boltzmann constant,νenindicates the collision frequency between an electron and Ar atom,Teindicates the electron temperature andTgrepresents the gas temperature.
The boundary conditions for the particle flux and the electron energy flux at the walls read:

wheremiandmmrepresent the ions and metastable particle masses, respectively,nindicates the normal unit vector,γi= 0.25refers to the secondary electron emission coefficients caused by the positively charged particles bombarding the walls[29],γm= 1indicates the metastable specie sticking coefficients andTiindicates the ion temperature, set asTi=Tg= 300 K [24].ΓeandΓiindicate the electron and ions fluxes on the walls,respectively, Γmrepresents the metastable particle fluxes, Γεrefers to the electron energy flux on the solid walls andεirefers to the secondary electron mean energy.αsandare the switching functions.They are related to the dot product ofnandE:

Table 2.The boundary conditions of the plasma dynamics model.

At the dielectric surface, the self-bias potential is computed via Gauss’s law:

whereD1andD2represent the electric displacement fields,σsindicates the surface charge density,Jirepresents the wall ion current density andJeindicates the wall electron current density.The boundary conditions employed in this model are displayed in table 2 and the relevant boundaries are exhibited in figure 1(a).
There are many chemical reactions in the discharge.It is unnecessary to include all the reactions for the calculation because many reactions are not important in the discharge process.Hence, a simplified chemical reaction set is used in our model, which includes ten species and 19 reactions.The reactions listed in table 3 are taken from [30, 31].The rate coefficients for the electron-impacting reactions (R1-R8) are computed via the Boltzmann solver BOLSIG+ [32].The electron mobility rates are also computed through the BOLSIG+.The cross-section data applied in this solver are obtained from the Phelps database [33].The ion mobility coefficients used in our simulation come from [34].In our simulation,a uniform background pre-ionization is employed.The background electron density is set to 1015m-3, which is consistent with other works [24, 35].
Due to the large timescale difference between the neutral model and plasma discharge model(ms versus ns),these two models are solved separately [24, 35, 36].Equations (1) and(2)are first solved via the steady-state solver in COMSOL 5.5 to gain steady-state velocity and mole fraction distributions of the background gas (Ar and N2).Then, the mole fraction distributions of Ar and N2are used as inputs to the plasma model to obtain the primary features of the Ar jet.The system equations (3)-(5) are solved via the time-dependent solver in the plasma model and the Poisson equation (equation (6)) is solved by a non-linear solver.Triangular mesh is applied in our simulation.Inside the dielectric tube, the smallest mesh size is 15 μm.Outside the tube,the mesh size is 35 μm in the jet propagation area (from r = 0 to 2 mm).In the other regions, a coarse mesh is employed.The number of degrees of freedom is about 7.5×10⁵.In order to retain the accuracy of the solution, the time step is set to 0.01 ns.

Table 3.The chemical reactions used in the simulation.
3.Results and discussion
In this part, the basic features of the Ar APPJ under 5 m·s-1gas speed and 10 kV peak voltage are studied.Then, the gas flow velocity influence on the characteristics of the APPJ is analyzed and discussed.
3.1.Properties and reactive particle generation of Ar APPJ for the base case
Figure 2 shows both the mole fraction distribution and gas flow distribution of Ar in the steady state.Figure 2(a) indicates that the Ar mole fraction is approximately equal to 1 inside the tube.After the Ar gas flows out of the tube,the Ar mole fraction is still very high near the central axis,and an Ar gas channel exists with a mole fraction close to 1.The Ar channel radius gradually reduces due to the convection-diffusion between Ar and ambient N2.Meanwhile, the Ar-N2mixing layer thickness increases continuously.Figure 2(b)shows that near the inlet of the dielectric tube, the axial velocity of the Ar gas increases and quickly reaches its maximum value.The axial velocity only slightly declines with the propagation distance outside the tube.Subsequent studies show that the smaller the inlet velocity of Ar gas is,the faster the axial velocity decreases after it leaves the tube.In addition, it should be noted that during the propagation of Ar, the radial velocity component is very small (see figure 2(c))and does not begin to increase until it reaches the vicinity of the metal plane.

Figure 2.Mole fraction distribution of Ar (a), axial velocity component(b), and radial velocity component of Ar (c)for 5 m·s-1 input flow velocity.
The electron density spatial-temporal evolution and the radial distribution of the electron density at the jet head are shown in figures 3 and 4, respectively.Studies have shown that it is easy for filamentous discharge to occur in Ar under atmospheric pressure,but it also presents a stable and diffuse discharge mode under some conditions [5, 12].Under our simulated conditions,the discharge is always in a stable state,and the formation of filamentous discharge is not observed.As shown in figure 3, the discharge is first excited near the high-voltage electrode and propagates to near the tube exit at 10 ns.It is found that a higher electron density is obtained near the dielectric tube inner surface,which will be explained in the following part.After the jet leaves the dielectric tube,it remains an annular structure.A lower electron density is gained in the gap.This phenomenon is analogous to the experimental observation in [14].With the increase in the propagation distance, the radius of the jet channel shrinks.Subsequently, the central low-density area disappears at 25 ns, and the jet head presents a solid disk structure.In figure 3,the jet head is defined by the position where there is a drastic electron density variation from 1019m-3to the background value of 1015m-3.The jet channel’s contraction is primarily induced by the decrease in Ar mole fraction in the channel,as shown in figure 2(a).In order to better understand the plasma evolution, the radial electron density distributions at the jet head for different times are presented in figure 4.At 12 ns, the electron density near the axis is about 1.25×10¹⁹m-3.The peak electron density at the jet head appears at about 0.7 mm from the central axis,which is about 2.25×10¹⁹m-3.This indicates that the electron density presents an evident annular distribution, which is not hollow.With the increase in time, the electron density peak value gradually moves towards the central axis, indicating the contraction of the jet radius.At 25 ns, the peak electron density is already located at the central axis.
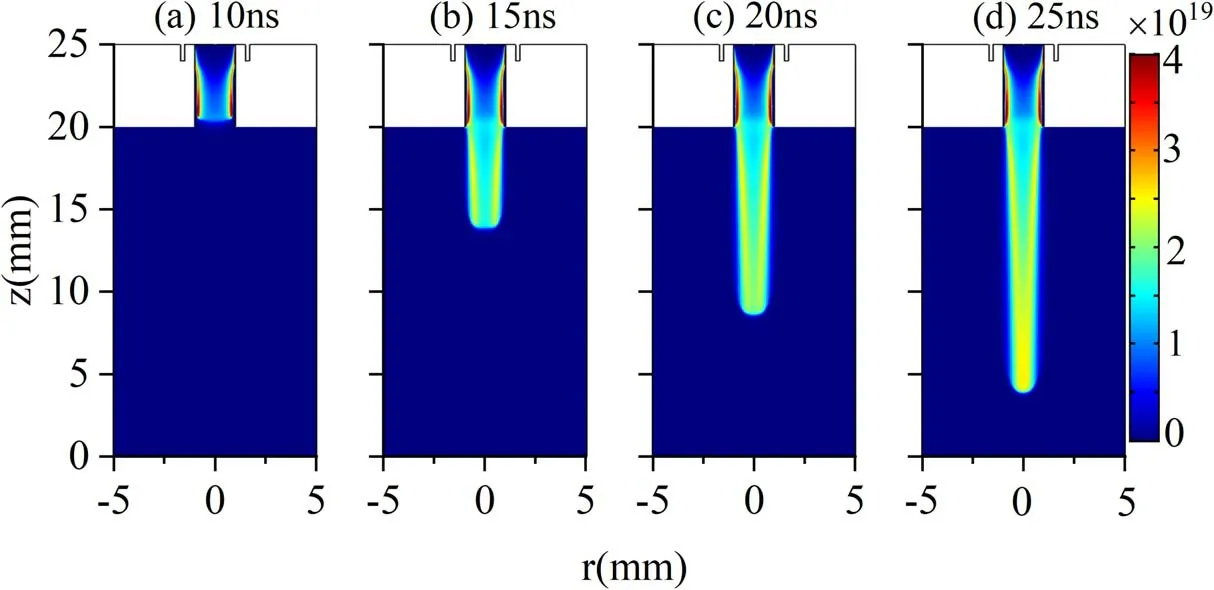
Figure 3.Electron density spatial distribution (ne: m-3) at different moments.(a) 10 ns, (b) 15 ns, (c) 20 ns and (d) 25 ns for 5 m·s-1 gas velocity and 10 kV applied voltage.

Figure 4.Radial electron density distribution at the jet head at different moments for 5 m·s-1 gas velocity and 10 kV applied voltage.
In order to further understand the propagation characteristics of an Ar jet under simulated conditions,the spatial distribution of the electron impact ionization rate and total electric field at different times are presented in figure 5.Figure 5(a) illustrates that the peak ionization rate is near the surface inside the tube.Hence, a higher electron density is obtained there, as shown in figure 3(a).As the jet propagates further, the peak rate always occurs at the jet head(figures 5(b)-(d)), which is a common characteristic of jet propagation driven by positive polarity voltage.Due to the positive charge gathered at the jet head driven by positive polarity voltage, a strong space-charge field is formed at the jet head.In order to prove this, figures 5(e)-(h) plot the total electric field at the corresponding moments.Obviously, the maximum electric field appears at the jet head during jet propagation, leading to the peak ionization rate there (see figures 5(a)-(d)).However,the electric field in the channel is very weak.Therefore, in figures 5(a)-(d), it can be seen that the ionization rate in the channel is very low,which indicates that under the current simulation conditions, the Ar APPJ travels in the pattern of a plasma bullet.With the jet development, the maximum electric field (the yellow number)decreases from 10 to 20 ns.It then slightly increases due to the approaching metal plane.Thus,the ionization rate exhibits the same trend.In addition, we note that the peak ionization rate gradually approaches the central axis with the increase in time, resulting in the peak electron density moving towards the axis, as shown in figures 3 and 4.The jet velocity is illustrated in figure 6.It can be seen that the jet velocity increases rapidly with time inside the tube and reaches its maximum value near the tube exit (about 11 ns).This is due to the external voltage continuously increasing during the pulse rising stage, leading to an increase in the electric field.Subsequently, the total electric field shows a reduced trend due to the increase in the distance between the jet head and the energy electrode.Hence, the jet velocity generally decreases with the propagation distance.When approaching the metal plane, the jet velocity changes slowly.Due to the high collisionality of the ambient N2at ambient pressure, the jet velocity does not follow a smooth trend as the jet propagates in the ambient gas [24, 37, 38].The jet velocity variation outside the tube is similar to the experiment result in[14].
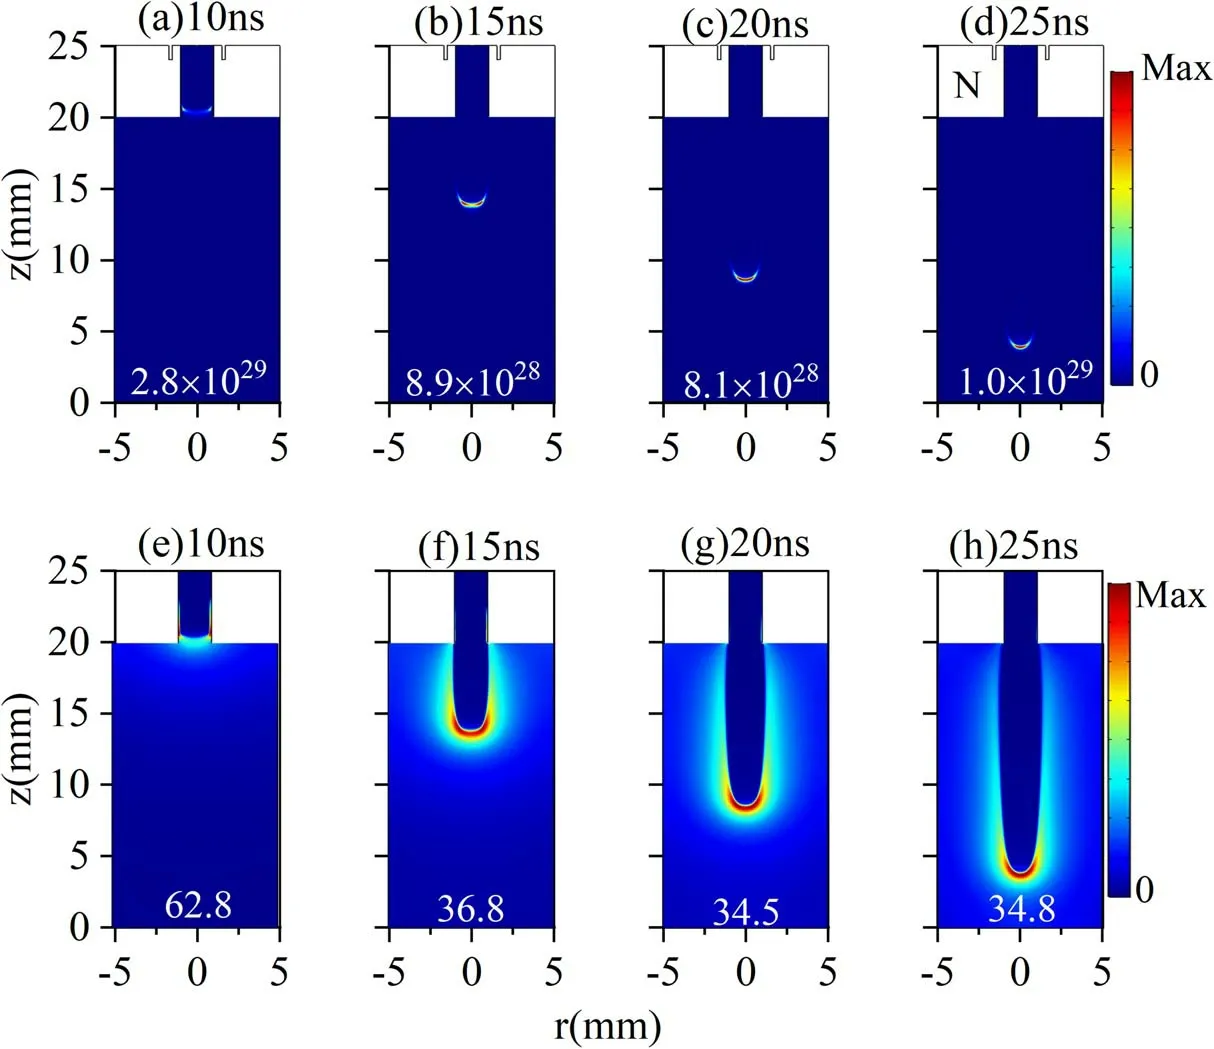
Figure 5.Spatial-temporal evolution of the electron impact ionization rate (Se: m-3·s-1): (a) 10 ns, (b) 15 ns, (c) 20 ns, (d) 25 ns and total electric field (E: kV·cm-1): (e) 10 ns, (f) 15 ns, (g) 20 ns, (h) 25 ns for 5 m·s-1 gas velocity and 10 kV applied voltage.Yellow number indicates the peak rate and electric field in the jet head.
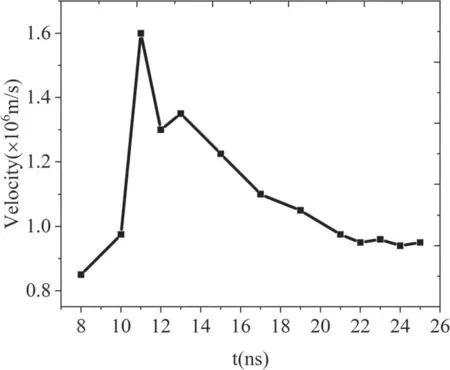
Figure 6.Ar plasma jet propagation velocity versus time for 5 m·s-1 gas velocity and 10 kV applied voltage.
Figure 7 shows the spatial distribution of several reactive particle densities at different moments during the propagation of the jet.As illustrated in figures 7(a) and (b), the peak densities of Ar+and Ar*are inside the tube.This is because they are dominantly generated via the electron impact ionization and excitation of the Ar atom.The higher Ar mole fraction inside the tube (see figure 2(a)) leads to higher Ar+and Ar*density.Similar to the electron density distribution,a radial relatively uniform channel is formed along the propagation direction.However,due to the higher ionization energy of the Ar atom and larger charge exchange rate between Ar+and N2,the Ar+channel radius is thinner than the Ar*channel radius.Figures 7(c)-(f) show that the N-related particles are mainly produced in the Ar-N2mixing layer outside the dielectric tube, presenting an apparent hollow structure.The diameter of the hollow distribution decreases with the propagation of the jet.
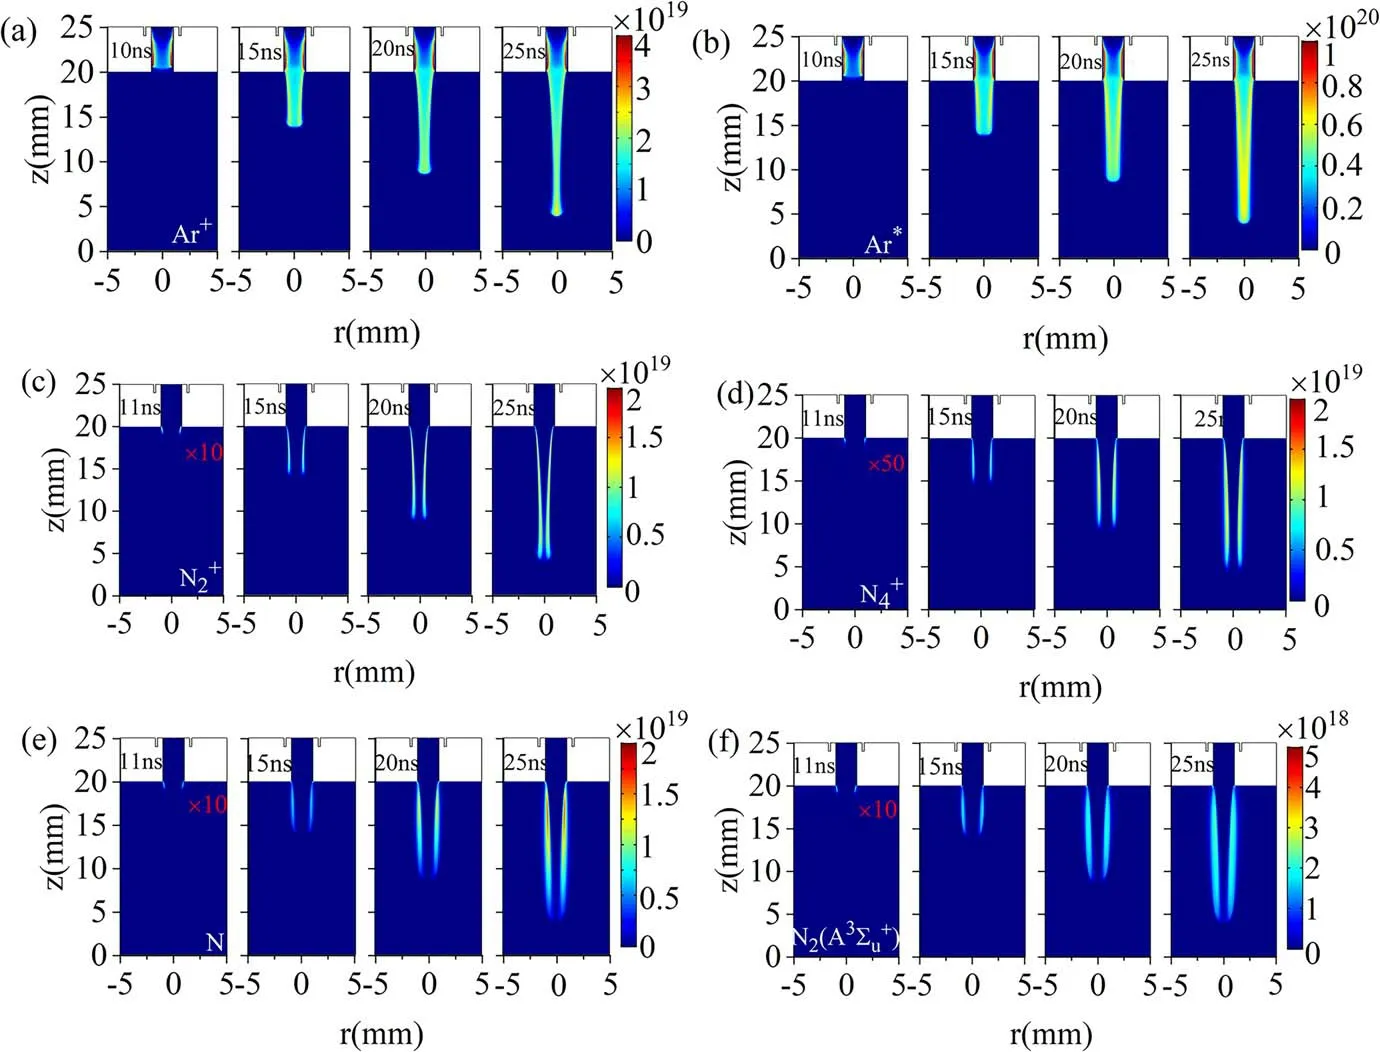
Figure 7.Spatial-temporal evolution of particle number density (unit: m-3).(a) Ar+, (b) Ar*, (c) , (d) , (e) N and (f) N2(A3) for 5 m·s-1 gas velocity and 10 kV applied voltage.Red font indicates the multiple of reactive species density.
In figure 3, it can be seen that the electron density distribution in the Ar jet presents a nearly uniform distribution.However, the density distribution of N-related particles in figures 7(c)-(f) shows an apparent hollow structure.This is mainly due to the energy level of Ar metastable-state atoms(11.5 eV) being lower than the ionization energy of N2molecules (15.6 eV).The Ar metastable-state atoms cannot ionize the N2molecules in the Ar-N2mixing layer by Penning ionization to generate more electrons, so the electron density distribution is almost uniform.The density of N-related particles appears in a hollow distribution, mainly determined by the Ar mole fraction distribution in the steady state.In the steady state, the mole fraction of Ar near the central axis is very high, close to 1 (see figure 2), and the N2content is almost zero, so it is difficult to produce N-related particles in the central area.The diameter of the hollow distribution of N-related particles decreases slightly during the transportation process, which should be attributed to the increase in the mixing layer thickness, as shown in figure 2(a).
To further understand the production of various reactive particles,figure 8(a)and(b)describe the time evolution of the reactive particles’ average densities and their net generation rates over the plasma area(ABHIFG).Figure 8(b)shows that the net production rates of Ar+and Ar*increase rapidly in the early stage of discharge and reach the maximum value near the nozzle position (about 11 ns).Therefore, the averaged densities of Ar+and Ar*rise sharply in this stage,as shown in figure 8(a).After exiting the nozzle,the net generation rate of Ar+drops sharply,but it is always larger than zero.Thus,we see that its average density presents a slight increase.For Ar*,the net generation rate reduces more slowly than that of Ar+and remains a relatively high value during the jet propagation process.Hence, the density of Ar*is higher than the Ar+density and presents a pronounced increase.The generation rate of N-related particles shows continuous growth after about 10 ns due to the rise in N2content in the mixing layer,so their average densities increase continuously.Note that the production rate of the N atom is the largest among the N-related particles, so its density is significantly higher than those ofand

Figure 8.Time evolution of the averaged densities(a)and net generation rate(b)of reactive particles during the discharge period for 5 m·s-1 gas velocity and 10 kV applied voltage.
3.2.Velocity influence on the properties of Ar APPJ
The velocity of the working gas is a crucial parameter that influences the properties of the jet.In this section, the jet characteristics for the Ar gas velocity of 1.5,2.5,5,6,10 and 12 m·s-1are analyzed and discussed.Except for the change in gas flow velocity,the other conditions are the same as for the base case.
Figure 9 shows the Ar mole fraction spatial distribution at several flow velocities.As illustrated in figure 9, the Ar mole fraction distribution in the tube is almost the same(close to 1), under these gas flow speeds.After the Ar gas flow leaves the tube, the mole fraction distribution changes significantly with the gas speed.The pure Ar channel shrinks faster along the central axis at low gas flow velocities(1.5 and 2.5 m·s-1).The convection-diffusion of Ar and N2is obvious,forming a thicker mixing layer, and low-density Ar can be observed in the entire area outside the channel.With the increase in gas velocity (from 5 to 12 m·s-1), the Ar mole fraction decreases more and more slowly, in both the axial and radial directions.The N2content entering the Ar channel decreases, and the Ar-N2mixing layer becomes thinner, as shown in figure 9.To display the change of mole fraction with flow velocity more clearly, figure 10 compares the Ar mole fraction distribution on the axis at different flow speeds.When the Ar speed is greater than 6 m·s-1, the Ar mole fraction on the axis is almost 1 from the gas inlet to the metal plate, indicating that the mole fraction of Ar near the axis is hardly affected by the gas velocity.When the gas velocity drops by 5 m·s-1, the Ar mole fraction begins to decrease slowly about 12.5 mm away from the nozzle and drops by about 2.5% when it reaches the metal plate.When the velocity is low, for example, 1.5 m·s-1, the mole fraction of Ar begins to drop rapidly shortly after exiting the nozzle and falls by about 27.5% at the position of the metal plate.The difference in the distribution of the working gas at different flow speeds will directly affect the jet behavior.

Figure 9.Spatial distribution of the Ar mole fraction at different gas velocities.
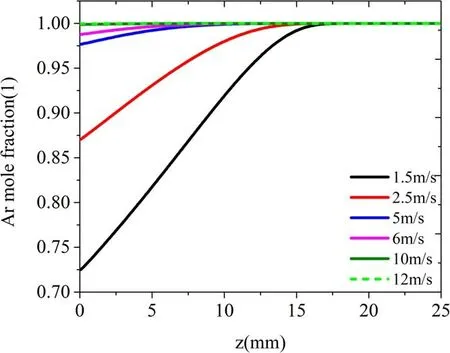
Figure 10.Ar mole fraction distribution on the axis at different flow velocities.
Figure 11 shows the electron density distribution under various gas flow velocities at 25 ns.In figure 11, it can be seen that the electron density distribution in the dielectric tube is almost the same at several flow speeds.This is because the mole fraction distribution of Ar inside the tube is nearly the same with various velocities.Driven by the same voltage, it will inevitably lead to the same electron density distribution.After exiting the nozzle,the distribution difference of Ar mole fraction under different flow speeds leads to the variations of electron density distribution.At low flow velocities(1.5-5 m·s-1), the peak electron density is located at the central axis, and the jet appears as a solid disk structure near the jet head.As the gas velocity is raised,the electron density in the jet head expands radially, and the maximum density shows a slight radial movement trend.However, the electron density at the central axis is still high.Hence, the jets under larger flow velocity(6-12 m·s-1)exhibit an annular structure.
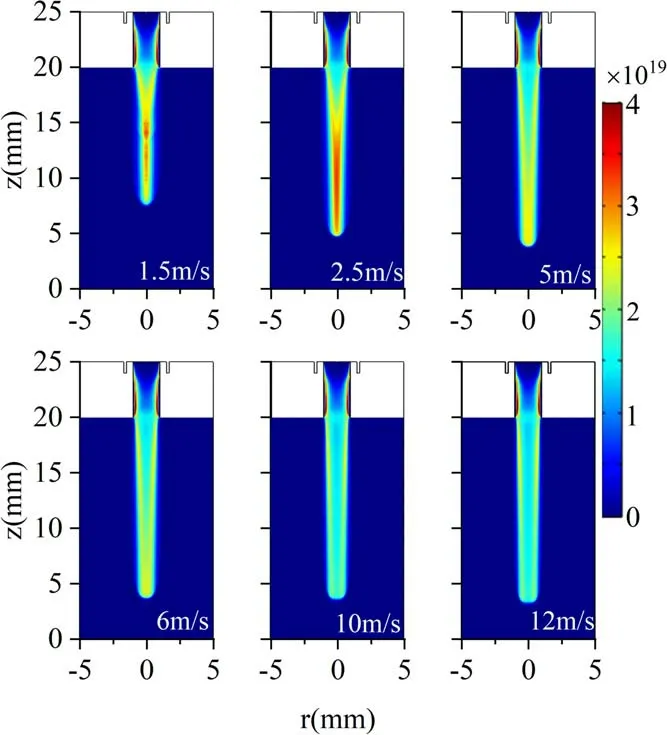
Figure 11.Electron density spatial distribution at 25 ns under various gas velocities.
The gas flow velocity not only affects the jet structure,but impacts its propagation.Figure 12 plots the variations of the jet length at 25 ns and the minimum Ar mole fraction in the jet head under different gas velocities at 25 ns.Figure 12 illustrates that when the flow speed is lower than 6 m·s-1,the jet length at 25 ns increases significantly with gas velocity.For 1.5 m·s-1gas velocity,the jet length at 25 ns is 17.5 mm.And the jet length becomes 21.2 mm for 5 m s-1gas velocity.Subsequently, the increase rate of the jet becomes slow with the further increase in gas velocity.This is consistent with the experimental observation under the laminar condition [39].For the Ar mole fraction, we observed that the increase in flow velocity leads to a significant increase in the minimum Ar mole fraction in the jet head from 1.5 to 5 m·s-1.However, the growth rate of the minimum Ar mole fraction reduces with further augmentation of the gas velocity.This confirms that the jet length at 25 ns is decided by the Ar mole fraction in the jet channel.

Figure 12.Variation of the plasma jet propagation length at 25 ns and the minimum Ar mole fraction in the jet head versus gas velocity.
Figure 13 describes the spatial distribution of reactive particle densities at 25 ns.For the sake of clarity, we only compare four types of reactive species for the velocities of 1.5 and 12 m·s-1.Obviously, the gas velocity has a noticeable influence on the spatial distribution of reactive particles outside the tube.Both Ar+and Ar*channels at lower gas velocity are thinner than those at higher gas flow speed.This is because the penetration of N2into the Ar jet is higher at low flow velocity, see figure 9.After the jet leaves the tube, Ar+and Ar*are rapidly converted to Ar atom by the charge exchange reaction (R12:Ar++N2→+Ar ) and dissociation reaction (R14:Ar* +N2→Ar +2N).In addition,the lower Ar content in the mixing layer also leads to a lower concentration of Ar+and Ar*.They both result in thinner channels of Ar+and Ar*in the gap.N-related ions are dominantly produced in the Ar-N2mixing layer.At low gas velocity, the densities ofand N present hollow structures near the tube exit due to the lower penetration content of N2.With the increase in the Ar flow propagation distance, the diffusion of the N2becomes obvious.For example, N2concentration on the axis increases to about 0.1 at about 10 mm away from the nozzle (see figure 10).Hence, both the peak densities ofand N shift to the axis and finally present solid disk structures.However, for higher gas velocity, the penetration of N2into the Ar jet becomes negligible in the whole gas channel (see figure 9).Thus, the densities ofand N present hollow structures in the entire jet channel.

Figure 13.Spatial distribution of reactive particles under two gas velocities.(a) 1.5 m·s-1 and (b) 12 m·s-1 for a 10 kV applied voltage.
Figures 14(a) and (b) show the reactive particles’ averaged density variations and their net production rates versus gas flow velocity over the plasma area (ABHIFG),respectively.As illustrated in figure 14(a), the Ar+density presents a noticeable increase as the speed is lower than 6 m·s-1.Subsequently,the density growth becomes slow with the further rise in gas speed.For Ar*,a mild augmentation of its density can be observed as the gas speed changes from 1.5 to 2.5 m·s-1.Further growth in the gas speed does not make the Ar*density increase.The N-related ions generally present increased trends by increasing the gas velocity from 1.5 to 2.5 m·s-1.Then,their densities decrease continuously, which can be further understood by their net production rates in figure 14(b).Note that the net production rate of Ar+in figure 14(b) displays a pronounced increase within 6 m·s-1gas velocity,induced by the apparent increase in the Ar mole fraction in the gas flow channel(see figure 10).Thus,the Ar+density shows an evident rise in this gas flow range.For gas flow velocity larger or equal to 6 m·s-1, the growth of Ar content becomes small.This means that the concentration of available reactants remains almost constant.Therefore, the increase in Ar+net production rate becomes small,leading to a nearly constant Ar+density.For Ar*,its net production rate slightly augments within 5 m·s-1gas velocity, and then a constant production rate can be observed.Hence, the Ar*density shows an increase as the gas velocity is lower than 5 m·s-1.In contrast, the N2content in the mixing layer continuously declines with the gas velocity.However, the net production rates of N-related particles show pronounced increases within gas velocity of 5 m·s-1.Subsequently, their production rates continuously reduce.This is because the production ofnot only relies on N2,but Ar.Although the N2concentration continuously decreases, the Ar content increases.Therefore, under the co-effect of Ar and N2, their production rates have a maximum value of 2.5 m·s-1gas velocity, leading to peak density formation in this case.In summary, this indicates that an optimized gas velocity may exist in the range of 1.5-5 m·s-1, which is vital for practical applications.

Figure 14.Averaged densities (a) and net production rates (b) of reactive particles versus gas velocities.
4.Conclusion
A 2D fluid model is employed to study the gas velocity influence on the basic properties of the Ar APPJ propagating in the ambient N2.The simulation results show that the plasma jet presents a cylindrical channel when the jets propagate in ambient N2under a certain gas speed.The electron density in the channel presents an annular distribution.As the propagation distance increases, the radius of the jet channel gradually shrinks,and the jet head becomes a solid disk structure.The jet velocity varies with time.The jet velocity increases in the first 11 ns due to the rapid increase in external voltage.Subsequently, the decrease in the electric field leads to the reduction in the jet velocity in the gap.Because the distributions of Ar and N2are different in the gas flow channel, the Ar-related reactive particles are mainly produced in the dielectric tube and transported along the Ar flow channel.Their density distributions are similar to those of electrons,forming relatively uniform radial channels along the propagation direction.However, the N-related particles are mainly produced in the mixing layer and transported along with the mixing layer.Their densities are very low near the central axis, showing obvious hollow structures.
The jet structure changes from a solid disk to an annular structure as the gas velocity is raised.Furthermore, the Ar mole fraction and jet length increase with the gas velocity under the laminar flow state.However, under simulated conditions, after the gas velocity exceeds a certain value(5 m·s-1), the increase rate of the jet length becomes slow with the gas velocity.The change in gas flow velocity also significantly influences the spatial distribution of the active particle density.The lower the gas speed, the more N2enters the Ar flow channel,leading to the contraction of Ar+density distribution.However, for the N-related ions, their spatial distribution changes from a circle to a hollow structure.In addition, an optimized gas flow range (between 1.5 and 5 m·s-1) exists, which is vital for plasma application.
Acknowledgments
This work was supported by National Natural Science Foundation of China (Nos.11775043, 11675095 and 11505020) and the Fundamental Research Funds for the Central Universities (No.DUT18LK31).
 Plasma Science and Technology2022年5期
- Plasma Science and Technology的其它文章
- Synthesis of Ag-decorated vertical graphene nanosheets and their electrocatalytic efficiencies
- Upgrade of an integrated Langmuir probe system on the closed divertor target plates in the HL-2A tokamak
- Effects of O2 addition on the plasma uniformity and reactivity of Ar DBD excited by ns pulsed and AC power supplies
- Design and first result of combined Langmuir-magnetic probe on J-TEXT tokamak
- Selective catalytic reduction of NOx with NH3 assisted by non-thermal plasma over CeMnZrOx@TiO2 core-shell catalyst
- A GPU-based general numerical framework for plasma simulations in terms of microscopic kinetic equations with full collision terms