
Design and first result of combined Langmuir-magnetic probe on J-TEXT tokamak
2022-06-01 07:55QinghuYANG杨庆虎ZhipengCHEN陈志鹏ZhigangHAO郝志刚YangmingZHAO赵扬明XinXU徐鑫ShuhaoLI李述豪JieYANG阳杰WeiYAN严伟ZhongheJIANG江中和ZhongyongCHEN陈忠勇NengchaoWANG王能超ZhoujunYANG杨州军YuanPAN潘垣YonghuaDING丁永华andtheTEXTTeam
Plasma Science and Technology 2022年5期
关键词:永华
Qinghu YANG (杨庆虎), Zhipeng CHEN (陈志鹏), Zhigang HAO (郝志刚),Yangming ZHAO (赵扬明), Xin XU (徐鑫), Shuhao LI (李述豪), Jie YANG (阳杰),Wei YAN (严伟), Zhonghe JIANG (江中和), Zhongyong CHEN (陈忠勇),Nengchao WANG (王能超), Zhoujun YANG (杨州军), Yuan PAN (潘垣),Yonghua DING (丁永华) and the J-TEXT Team
International Joint Research Laboratory of Magnetic Confinement Fusion and Plasma Physics, State Key Laboratory of Advanced Electromagnetic Engineering and Technology,School of Electrical and Electronic Engineering, Huazhong University of Science and Technology, Wuhan 430074, People’s Republic of China
Abstract In order to measure boundary electrostatic and magnetic fluctuations simultaneously,a combined Langmuir-magnetic probe (CLMP) has been designed and built on joint-Texas experimental tokamak.The probe consists of 8 graphite probe pins and a 3D magnetic probe, driven by a mechanical pneumatic device.By means of simulation,the shielding effect of the graphite sleeve on the magnetic fluctuation signal is explored,and the influence of the eddy current was reduced by cutting the graphite sleeve.In the experiment,it has been verified that the mutual inductance of electromagnetic signals can be ignored, and a 70-90 kHz electromagnetic mode is observed around the last closed magnetic surface.The establishment of CLMP provides data for the exploration of the coupling of electrostatic and magnetic fluctuations.
Keywords: J-TEXT, Langmuir probe, magnetic probe, eddy current effect,electromagnetic mode
1.Introduction
Plasma diagnostic technology has played a key role in the development of controllable thermonuclear fusion.Among them, Langmuir probes and magnetic probes have obtained abundant data in boundary parameter diagnosis [1-4] and magnetic disturbance detection [5-7] respectively.In experiments, Langmuir probes and magnetic probes are often used separately,and it is hard to obtain information on electrostatic and magnetic fluctuations at the same time and location.However, more and more studies have shown that there is a complex coupling relationship between electrostatic and magnetic fluctuations [8, 9].Therefore, the influence of electromagnetic fluctuations on the boundary plasma transport is worthy of further study.
A combined Langmuir-magnetic probe (CLMP) established on the ASDEX-U [10] could observe the micromagnetic fluctuations in the local plasma and found more insight into the penetration of edge-localized modes (ELM)filament structures into the scrape-off layer (SOL).On COMPASS [11], a similar probe allows the measurement of electrostatic and magnetic properties of the filaments.The CLMPs are also established on EAST [12, 13] and W7-X[14], which accumulate abundant diagnostic data about the electrostatic and magnetic features of type-I ELM and the electromagnetic fluctuation transport.However, the graphite sleeves which are often used as protection may induce eddy current under the alternating magnetic field,thus shielding the magnetic field, especially affecting the measurement of highfrequency magnetic signals.For this reason, the probe on ASDEX-U tokamak reduces the influence of eddy current through four vertical slits in the graphite sleeve.Moreover,the mutual inductance between the Langmuir probe and magnetic probe will also affect signal accuracy.
In this work, a set of CLMP is designed and built on J-TEXT tokamak [15], which can measure electrostatic and magnetic fluctuation of boundary plasma simultaneously.By cutting the graphite sleeve axially, the influence of the eddy current effect on signals of the magnetic probe has been reduced.For this program,we use finite element software for simulation analysis and perform experiments to verify.Finally, preliminary experimental results are obtained in the discharge of the J-TEXT.The spectrum analysis technique is used to verify that the mutual interference of electromagnetic signals can be neglected.In addition, a high-frequency electromagnetic mode of 70-90 kHz has been observed.
This paper is organized as follows: section 2 introduces the design of CLMP; section 3 analyzes the eddy current effect of the graphite sleeve;section 4 obtains the preliminary experimental results,and section 5 is devoted to the summary.
2.Design of CLMP
The probe designed in this paper is mainly composed of Langmuir probe pins, magnetic probe coil, probe skeleton,graphite sleeve, and stainless steel bracket, as shown in figure 1(a); and the probe is connected to the mechanical pneumatic system [16], as shown in figure 1(b).The probe skeleton is made of anhydrous boron nitride with insulation,high-temperature resistance, and low outgassing rate.The probe skeleton can be divided into three parts:top,middle and bottom ceramics.In the top ceramic, there are two steps as shown in figure 1(c).Step 2 is 3 mm higher than step 1 so that the probe pins on different steps can obtain electrostatic signals at different radial positions.In addition, the top ceramic also serves as a cover to protect the internal structure of the probe.The middle ceramic is for a 3D magnetic probe, as shown in figure 1(d).The bottom ceramic is connected to the stainless steel bracket for fixing.

Figure 1.(a)Overall assembly drawing of CLMP,(b)photo of mechanical pneumatic system and CLMP,(c)Langmuir probe pins layout,(d)3D magnetic probe.
The Langmuir probe array is composed of eight graphite probe pins, and each probe pin has a diameter of 2 mm.Figure 1(c)is the distribution of the probe pins on the CLMP.The probe pins 1-4 are located on step 1, with a length of 3 mm.Pins 1 and 3 are distributed along the toroidal direction as a pair of Mach probes and pins 2 and 4 to measure the floating potentialVf1.Probe pins 5-8 are located on step 2,the length is 4 mm,and the connecting lines of pins 5 and 7 are at a certain angle with the toroidal direction, which can avoid the shadow effect between probe pins.The pins 5 and 7 are biased to form a double probe to obtain the ion saturation currentIs; the pins 6 and 8 spacing d = 7 mm are used to measure the floating potentialVf2,which can calculate the electron temperature, electron density .In addition,the probe can also measure the poloidal electric fieldEpand the radial electric fieldEr.
The 3D magnetic probe is made of enameled copper wire with an outer diameter of 0.23 mm, which is winded on the middle ceramic skeleton, as shown in figure 1(c).It can measure the magnetic signals in radial, poloidal and toroidal directions respectively.The lead wire of each probe coil is twisted and wrapped by polyimide material, led out through the slot and connected to the electrical feedthrough, and finally connected to the data acquisition cards by the coaxial cable.The signal-to-noise ratio and high-frequency response of the magnetic probe are particularly important in the diagnosis of magnetic signals, which depends on the basic size and electrical parameters.We use Helmholtz coils to calibrate the electrical parameters of the 3D magnetic probe [17].In addition, the distance between the electrostatic probe and the magnetic probe (DLP-MP) should be as small as possible to improve the uniformity of the spatial position.The basic size and electrical parameters of the 3D magnetic probes are shown in table 1.

Table 1.The basic size and electrical parameters of the 3D magnetic probe.
When the signal frequency is the same as the resonance frequency of the magnetic probe circuit, the resonance will occur in the circuit and cause serious distortion of the output signal.The resonant frequency of the probe circuit can be calculated by the following formula:

Among them,f0is the resonance frequency,LMis the equivalent inductance andCMis the equivalent capacitance.Through calculation, it can be obtained that the resonance frequencies of the magnetic probe circuit in each direction are all above 1.5 MHz so that we can measure sufficiently highfrequency signals.At present,the sampling rate of acquisition card (NI PXIe-6368) of the J-TEXT probe system is 2 MHz.According to Nyquist’s law [18], the upper limit of the frequency at which the acquisition system can accurately obtain fluctuation signals is 1 MHz.
The graphite sleeve can effectively protect the internal structure of the probe without introducing too many impurities.However, graphite is a good conductor, so eddy currents could be generated under time-varying magnetic fields and shield the magnetic field.In order to reduce the influence of eddy currents,we cut two slits 1 mm wide and 20 mm deep in the axial direction of the sleeve, as shown in figure 2(b).The plasma in J-TEXT mainly moves along the magnetic field line, which is almost to the toroidal direction.Thus, the graphite sleeve will be more severely bombarded by the particles in the toroidal direction so that the slit should be facing the poloidal direction.Two slits are inclined at 45°,as shown in figure 1(c), to prevent a small number of particles moving in the poloidal direction from bombarding the internal magnetic probe.

Figure 2.The photo of the graphite sleeve: (a) without cutting,(b) cutting depth = 20 mm.
3.Analysis of eddy current effect
Generally, the eddy current effect can be reduced by slitting the graphite sleeve.However, the CLMP is driven by a mechanical pneumatic system, which will generate a great accelerating force in the sleeve.In order to ensure sufficient structural strength, the slits cannot be too deep.The AC/DC module in the finite element software COMSOL is used to simulate the eddy current effect in the graphite sleeve and analyze the suppression effect of slits with different depths on eddy currents in different directions.
In the simulation, we simplified the magnetic field: set a uniform alternating magnetic field once in a direction.This is because the 3D magnetic probe measures the magnetic fluctuation signals in three orthogonal directions,so the magnetic field can be decomposed and discussed separately in three directions.Moreover, the magnetic probe can only measure the magnetic field fluctuation signal whose wavelength is longer than the size of the probe.Therefore, uniform alternating magnetic fields can be used to estimate the response of the magnetic probe to this long-wavelength magnetic fluctuation.In addition,the 3D magnetic probe is assumed to be a cube, as shown in figure 3(a).Its outer surfacesSr,Sθ,Sφrepresent the cross-sections of the magnetic probe coil in the radial, poloidal and toroidal directions, corresponding to the radial coil, poloidal coil and toroidal coil in figure 1(d).The graphite sleeve has a cylindrical structure,and the axis points to the radial direction.
In practice, the radial magnetic fluctuationis directly related to turbulence transport [19].Therefore, the influence of the eddy current on the signal of the radial magnetic probe should be first analyzed.Figures 3(b) and (c) show the eddy current density distribution in the graphite sleeve whenf= 600 kHz,and the magnetic flux density distribution ofSr.The color represents the amplitude of eddy current density,the grayscale represents magnetic flux density, and the red lines represent the path of eddy current.It can be seen from figure 3(b)that when the sleeve is not cut,the skin effect causes the eddy current to mainly concentrate on the outer surface of the sleeve.After cutting the sleeve in the axial direction,as shown in figure 3(c), the eddy current loop is blocked and its path concentrates towards the lower end of slits so that two high current density regions appear.Finally, the eddy current distribution was significantly changed.The induced current density near the slit has been reduced from2.1 ×107to 0.9 × 10⁷A m-2and the magnetic flux density through increases from(1.96 ± 0.04)× 10-2to (3.45 ± 0.04) ×10-2T.Thus, the eddy current is obviously suppressed.
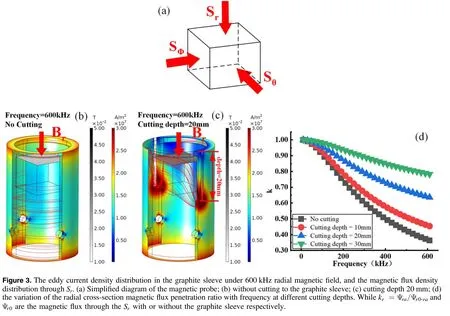
The cross-sectional flux can be obtained by integrating the magnetic flux density of the probe cross-section.Figure 3(d) shows the variation of magnetic flux penetration ratio throughSrwith frequency at different cutting depths.It can be seen that as the frequency increases, the influence of the eddy current effect on the magnetic flux amplitude increases; as the cutting depth increases, the suppression effect of the eddy current increases significantly.Combining the suppression effect of eddy currents and structural strength,cutting depth = 20 mm is relatively more reasonable.
For poloidal and toroidal magnetic fields, cutting has completely different suppression effects on eddy currents.Figure 4(a) shows that the slit has a very obvious blocking effect on the eddy current loop induced by; under, the eddy current loop cannot cut off, so that the eddy current suppression effect becomes inconspicuous as shown in figure 4(b).It is also observed that the magnetic flux density throughθS is higher thanφS .Figure 4(c) shows the magnetic flux penetration ratio kθand kφ(same as the definition ofkr)under the two magnetic fields through the cross-section ofθS andφS as the frequency changes.It can be seen that the slit has a better suppression effect on eddy current generated bythan that generated by

Figure 4.The eddy current density distribution in the graphite sleeve under 600 kHz poloidal and toroidal magnetic fields,and the magnetic flux density distributions through θS and φS (a)and(b);(c)the variation of the poloidal and toroidal cross-section magnetic flux penetration ratio ( kθ and kφ ) with frequency at different cutting depths.
In our work, the conclusion in the above simulation is experimentally tested by placing the magnetic probe in the Helmholtz coil [17].In the experiment, the signal generator provides a sinusoidal alternating current of 10-600 kHz to the Helmholtz coil.The effect of the eddy current on the amplitude and phase of the magnetic probe signals was compared under the conditions with or without cutting on the graphite sleeve.Figure 5(a) shows the change of the magnetic flux penetration ratio of the magnetic probe coil in each direction.It can be seen that the cutting of 20 mm in depth has a better suppression effect on eddy current and the magnetic flux penetration ratios andkrhave been improved a lot.However,there is no improvement of the toroidal magnetic field,which agrees with the simulation results.
Figure 5(b) depicts the effect of eddy currents on the phase.The figure first shows that the influence of the eddy current on the phase increases as the frequency increases.Then, with the cutting of sleeve, the phase delay of radial magnetic field under a 600 kHz magnetic field can be reduced from 80° to 25°; the phase delay of the poloidal probe signal is also reduced from 41° to 22°, but it has no effect on the phase delay of the toroidal magnetic field.In summary, the cutting of the sleeve has a significant suppression effect on the eddy current generated by the radial and poloidal magnetic fields, and the amplitude decay and phase delay of the probe signals have been significantly improved.

Figure 5.The amplitude and phase response of the magnetic probe in each direction under the conditions of no cutting or cutting depth = 20 mm of graphite sleeve under the 10-600 kHz frequency magnetic field.(a) The change of magnetic flux penetration ratio with frequency; (b) the phase difference Δφ changes with the frequency; while Δφ = φa - φ0. φa and φ0 are the phases of the induced voltage relative to the Helmholtz coil current with or without the graphite sleeve respectively.
4.Experimental results and preliminary analysis
The CLMP can simultaneously complete the measurement of the electrostatic fluctuation signals and the 3D magnetic fluctuation signals.The multi-channel signals are all transmitted to the acquisition system together in the form of voltage signals.In this process,a mutual inductance could exist between the Langmuir probe and the magnetic probe, which affects the authenticity of signals, especially the signals of the magnetic probe.Through the correlation analysis ofandin the experiment,the mutual inductance of electromagnetic signals can be well observed.
The experiment was carried out in the limiter configuration and the minor radius of the limiter is 255 mm.The discharge parameters are as follows: the plasma currentIp=150 kA,the toroidal magnetic fieldBt=1.8 T,the boundary safety factorqa≈3.9,the central line-averaged densityne=1.9 × 10¹⁹m-3, the minor radiusr=0.255 m,the major radiusR= 1.05 m, and the flattop time ~600 ms.The CLMP is installed on the front end of the pneumatic reciprocating probe driven on the top window of Port 13 on the J-TEXT tokamak as shown in figure 6.
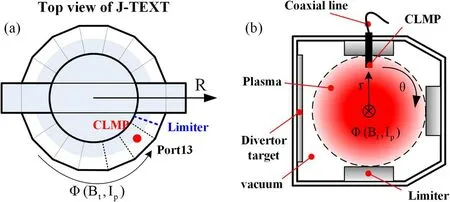
Figure 6.(a) Top view of J-TEXT tokamak and installation position of CLMP; (b) profile of Port 13 vacuum chamber.
The signal of the CLMP and its displacement signal are shown in figure 7.The probe is inserted at a depth of 5 mm from 280 to 340 ms, and then stays at a radial position of 235 mm for about 30 ms.Figures 7(a)-(c) are the Langmuir probe signals; figures 7(d) and (e) are the voltages of the two leads of the radial magnetic probe related to the ground,respectively.The common-mode part reflects the information of the space potential of the magnetic probe.After doing the difference,the differential signal of the radial magnetic field ˙Brcan be obtained, as shown in figure 7(f).The black and blue lines in figure 7(g) are the displacement signals of the Langmuir probe and the magnetic probe,respectively.The signal ˙Bramplitude changes greatly due to mechanical vibration at the moment of precession of the probe at about 280 ms, but the vibration frequency is about 500 Hz and decays rapidly,so the impact on high-frequency fluctuation signals can be ignored.
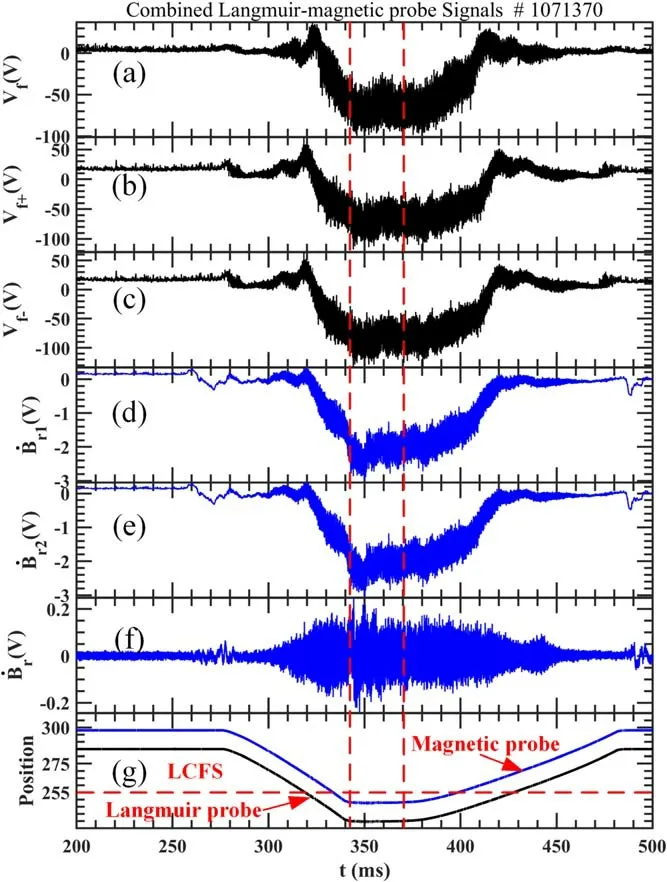
Figure 7.Part of the signals of CLMP on shot = 1071370.(a) Floating potential; (b) and (c) the potential of positively and negatively biased probe tips;(d)and(e)the voltage of the two leads of the radial magnetic probe to the ground respectively; (f) radial magnetic probe signal (g) displacement signal of Langmuir probe (black) and magnetic probe (blue).
The radial profiles of the equilibrium parameters in the boundary region of plasma measured by Langmuir probe pins 5-8 are shown in figure 8,including the floating potential,ion saturation current, electron density, and electron temperature,Δris the relative position of Langmuir probe and limiter.FromΔr= 2 cm to Δr=−1 cm,as the probe deepens in the radial direction, after entering the LCFS,theVfchanges from positive to negative, and theIs,neand all rise rapidly.In addition, the plasma boundary parameters’ gradient increases significantly around the LCFS.
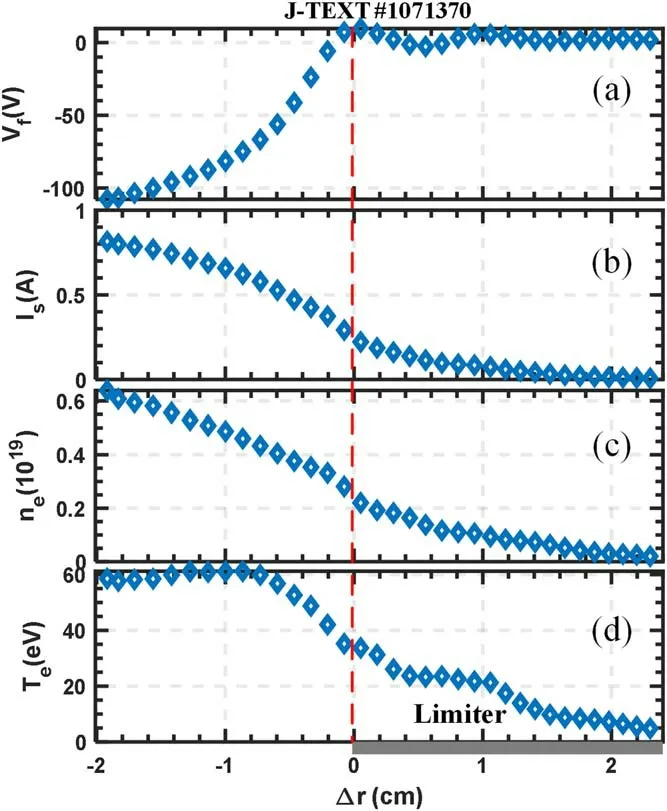
Figure 8.Radial profiles of the equilibrium parameters in the boundary region of plasma.(a) Floating potential, (b) ion saturation current, (c) electron density, (d) electron temperature.
The probe signals are processed by fast Fourier transform, and the auto-power spectral density, cross-power spectrum density, correlation coefficient spectrum and phase difference spectrum are obtained from the following equations:

whereXT(f)is the Fourier transform of the random fluctuation signal(t), is the auto-power spectrum density;Px y(f),γxy(f),are the cross-power spectrum density, correlation coefficient and phase difference between two fluctuations signals(t) and(t) ,〈□ 〉 represents the average of multiple samples.
The spectra analysis of the key signals in the precession process is performed as shown in figure 9.Figures 9(a)-(c)are the auto-power spectrum of the electrostatic fluctuation signals,and the horizontal coordinate is the radial position of the Langmuir probe pins relative to the last closed magnetic surface(LCFS).It can be seen that there is a large gradient near LCFS in the auto-power spectrum density of the electrostatic fluctuation.In figure 9(a), a low-frequency mode of thearound 20 kHz can be observed atΔr= - 2 cm to -1 cm, and from the auto-power spectrum of the poloidal electric fieldin figure 9(c),this 20 kHz mode cannot be seen,which conforms to the nature of the geodesic acoustic mode (GAM) [20].

Figure 9.Auto-power spectrum density of Langmuir probe signals: auto-power spectrum density of floating potentialion saturation current and poloidal electric field (a)-(c); the auto-power spectrum density of the differential signal of the magnetic probe in each direction (d)-(f).
Figures 9(d)-(f) are the auto-power spectrum of the magnetic fluctuations in each direction,and the abscissa is the radial position of each magnetic probe relative to the LCFS at the same time.First of all, the radial and poloidal magnetic fluctuation strengths are greater than that in the toroidal direction.The high-frequency magnetic fluctuation is stronger than the low-frequency fluctuation obviously, and there is a high-frequency mode at 70-90 kHz, which is different from electrostatic fluctuation.The high-frequency fluctuations decay faster with the radial position outward, and the peak of the high-frequency mode appears near the LCFS.On COMPASS,they found a 35 kHz mode in the magnetic probe signal and confirmed that it was the GAM magnetic component [21], which was the same as the GAM frequency measured by Langmuir probe.This is different from our work,the GAM can be detected by Langmuir probes,but not by the magnetic probes.
In the low-frequency range of the spectrum, the MHD(Magnetohydrodynamic)activity around 10 kHz can be seen,and it is most obvious in the poloidal direction.In order to explore the characteristics of this electromagnetic mode, we compare the signal of the Mirnov probe near the CLMP (the radial position is 334 mm and the cutoff frequency is 283 kHz[22]).Figure 10(a) shows the auto-power spectrum of the Mirnov probe.The MHD mode is observed, but there is no high-frequency electromagnetic mode.Cross-correlation analysis is performed between Mirnov probe and the radial magnetic probe signal, and the correlation coefficient spectrum and the cross-power spectrum are obtained as shown in figures 10(b) and (c).It can be seen that there is a strong correlation merely at 10 kHz.Therefore, compared with the Mirnov probe on the vacuum vessel wall,the CLMP can also observe a local high-frequency electromagnetic mode.
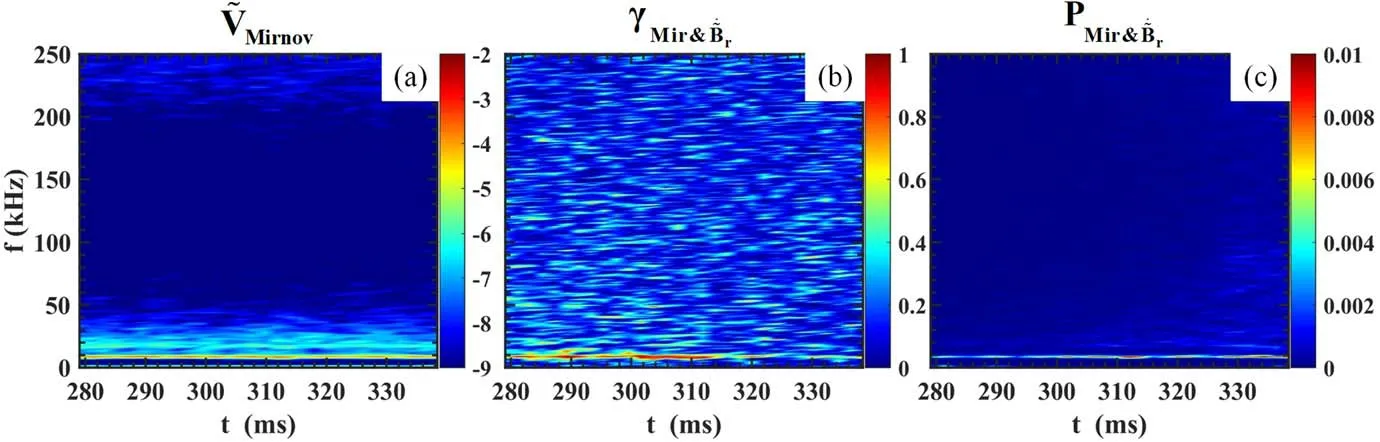
Figure 10.The auto-power spectrum(a),correlation coefficient spectrum(b)and cross-power spectrum(c)of the Mirnov probe and the radial magnetic probe.
In order to estimate the mutual inductance between the Langmuir probe and the magnetic probe, we performed a cross-correlation analysis on the ion saturation current and each magnetic probe signal.As shown in figure 11, it is observed thatandonly have the strongest cross-power spectrum density near 70-90 kHz atΔr= - 2 cm to -1 cm(the radial position of the Langmuir probe pins relative to the LCFS), which can also be observed in the correlation coefficient spectrum.Their correlation in specific frequency and location, not in the full frequency range and space, so the mutual interference of electric and magnetic signals can be ignored.From the other side, the strongest cross-power spectrum density near 70-90 kHz at indicates that there is a local mode of 70-90 kHz detected by the Langmuir probe and the magnetic probe at the same time near the LCFS,which is no interference between signals.It is hard to distinguish whether this mode is an electromagnetic mode or a mixing of electrostatic mode and magnetic mode now.
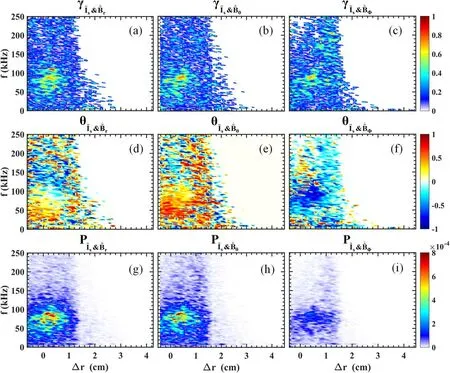
Figure 11.Coherence coefficient spectrum (a)-(c); phase difference spectrum (d)-(f), and cross-power spectrum (g)-(i) of ion saturation current and magnetic probe signals in various directions (from top to bottom).
5.Conclusions
This paper introduces the design and the construction of CLMP on J-TEXT tokamak.Aiming at the shielding problem of high-frequency signals,the COMSOL simulation is used to calculate the response of the magnetic probe to the timevarying magnetic field due to the eddy current in the graphite sleeve.By cutting the sleeve,the influence of the eddy current on the signals of the magnetic probe is reduced,and the signal sensitivity is improved.This conclusion has also been verified in the experiment.In the J-TEXT discharge experiment, the CLMP was used to measure the local electrostatic and magnetic fluctuation signals at the same time.Through the spectrum analysis, the cross-correlation analysis of the magnetic fluctuation signals,the external Mirnov probe signal and the ion saturation current signal were carried out,and the experimental results prove that the mutual interference of electric and magnetic signals can be ignored.In addition,during the precession of the probe, a high-frequency local electromagnetic mode of 70-90 kHz existing near the LCFS was observed.
Acknowledgments
This work was supported by the National Key R&D Program of China (No.2018YFE0309100) and National Natural Science Foundation of China (No.51821005).
猜你喜欢
初中生学习指导·中考版(2021年4期)2021-09-10
考试与评价·七年级版(2020年6期)2020-11-02
考试与评价·七年级版(2020年3期)2020-11-02
考试与评价·七年级版(2020年2期)2020-10-29
考试与评价·七年级版(2020年5期)2020-10-29
考试与评价·七年级版(2020年1期)2020-10-23
考试与评价·七年级版(2020年4期)2020-10-23
初中生学习指导·中考版(2020年7期)2020-09-10
初中生学习指导·中考版(2020年10期)2020-09-10
连环画报(2015年8期)2015-12-04
 Plasma Science and Technology2022年5期
- Plasma Science and Technology的其它文章
- Synthesis of Ag-decorated vertical graphene nanosheets and their electrocatalytic efficiencies
- Upgrade of an integrated Langmuir probe system on the closed divertor target plates in the HL-2A tokamak
- Numerical study of atmospheric-pressure argon plasma jet propagating into ambient nitrogen
- Effects of O2 addition on the plasma uniformity and reactivity of Ar DBD excited by ns pulsed and AC power supplies
- Selective catalytic reduction of NOx with NH3 assisted by non-thermal plasma over CeMnZrOx@TiO2 core-shell catalyst
- A GPU-based general numerical framework for plasma simulations in terms of microscopic kinetic equations with full collision terms