
Analysis of non-ionized substance losses in experiments on plasma mass separation
2022-09-14 08:18USMANOVANTONOVGAVRIKOVLIZIAKINMELNIKOVOILERSMIRNOVTIMIRKHANOVVOLKOVandVORONA
Plasma Science and Technology 2022年8期
R A USMANOV,N N ANTONOV,A V GAVRIKOV,G D LIZIAKIN,A D MELNIKOV,A P OILER,V P SMIRNOV,R A TIMIRKHANOV,L S VOLKOV and N A VORONA
Laboratory of Electrophysical and Plasma Devices,Joint Institute for High Temperature,Moscow 125412,Russia
Abstract Plasma mass separation requires a lot of diagnostic techniques that not only demonstrate the separation effect but also show the efficiency of the process.During the test experiments,plasma flux to be separated may contain neutral particles that avoid the separation process due to their insensitivity to electromagnetic field.We present the diagnostics of the lost substance in experiments on plasma mass separation.The obtained data of the diagnostics helps determine the law of particle evaporation from the plasma source.We show that neutral flux is unable to distort the result of separation diagnostics.The presented approach can be used in experiments aimed at enhancing the separation effect and achieving target productivity for industry applications.
Keywords: plasma mass separation,plasma diagnostics,lead,silver,film deposition
1.Introduction
A plasma mass-separation method is a contemporary and promising approach applicable to a variety of reprocessing tasks in the scope of today’s ecological agenda[1–4].One of the most important reprocessing tasks is a recycling of spent nuclear fuel (SNF) [5,6].Calculations show that efficient separation process is possible [7,8].Attempts to prove the feasibility of separation are actively carried out,and successful experiments are already demonstrated [9–11].However,experiments have to overcome a number of physical problems to achieve target productivity for industry applications.During test experiments,parts of the injected particles can deposit on different experimental installation parts,bypassing a collector of the separated substance.This fraction of the substance can be considered losses.The losses on the stage of test experiments are caused by different reasons;these include non-100%ionization in plasma source,transient modes of the source,and local non-uniformity of electric and magnetic fields where particles disperse,affecting reflection and spraying.A diagnostic method is necessary to analyze the lost substances and to improve the process of separation.This work focuses on the diagnostic approach to measuring a quantity of lost substance in separation experiments and detecting the location of its deposition.
There are several methods to image and analyze the deposition area on a surface.These techniques are widely applied in fusion devices.They are mainly optical methods[12]which assume complex physical models to interpret obtained data.In [13],a reflection of films deposited on stainless steel in the Large Helical Device [14]was studied.The reflection coefficient,which was measured by compact color analyzer,clearly indicated the thickness of the deposition layer between 10 and 100 nm.This is a simple technique but is applicable only for a low quantity of deposited substance and unreliable for films thicker than 100 nm.In[15],a surface probe was used.This method is based on multiple total internal reflection Fourier transform infrared spectroscopy.The technique is efficient for monitoring a reactor wall but has a problem of scaling on big surfaces about of 1 m2.In[16],a laser-induced breakdown spectroscopy (LIBS) technique was applied to measure a thickness of Li film deposited on a wall of the EAST device [17].A laser shot to the wall was covered by Li during the experiment.The intensity of the LIBS signal of ablation products was compared with a reference one.The thickness of 1.3 μm Li film was measured and intensity of deposition 4.65 mg s−1was obtained.This laser technique is effective for analyzing deposition of single substances but faces difficulties with heterogeneous film when a reference sample is needed.
In our pilot experiments,we used a diagnostic based on weighing method.The paper presents result of a study of lost substance deposition in experiments on plasma mass separation in a configuration with a potential well and crossed electric and magnetic fields [9].The analysis of an image of deposition is carried out,and the law of evaporation from plasma source is obtained.The influence of neutral particle deposition on a substrate that receives separated substances is evaluated.
2.Experiment arrangement
Figure 1(a) illustrates a plasma mass-separation method in a configuration with a potential well and crossed electric and magnetic fields [9].The experiment is carried out in a cylindrical vacuum chamber with conducting walls (stainless steel).The length of the chamber is 200 cm and its diameter is 860 cm.The external axial magnetic field,with intensity of 1.4 kG,is applied to the system.The coaxial electrodes are situated on the ends of the chamber.The first three electrodes are biased by a voltage of −500 V,the fourth electrode is under a floating potential,and the fifth electrode is grounded as well as chamber walls.This electrode system generates a reflex Penning discharge in longitudinal magnetic field in argon atmosphere.Argon pressure is 0.3 mTorr.The Penning discharge maintains a background plasma and radial electric field.The minimum of the electric potential is on the chamber axis and its value is −300 V when the electric field has a linear gradient along the radius[9].Maximum of background plasma density is about 1011cm−3.

Figure 1.Scheme of the plasma mass-separation method.(a) Arrangement of the experimental chamber,and (b) a coordinate system.
An arc plasma source is used in current experiments to generate plasma of a substance to be separated.
The choice in favor of arc discharge as a source is partly discussed in [18].An arc plasma source is located at a distance of 18 cm from the chamber axis.A mixture of silver(Ag) and lead (Pb) is used as the substance for separation in pilot experiments [19].The source consists of thermionic cathode made of LaB6and molybdenum circular watercooled anode with a hole for plasma outflow.The distance between arc electrodes is about 10 cm.The plasma-forming medium for the arc is generated inside a molybdenum evaporator that contains a mixture of separated substances and is located under the discharge gap.The temperature of the evaporator is changeable and allows us to control the vapor pressure of Pb and Ag in the source.Pb has lower saturated vapor pressure than Ag.It was previously shown that at relatively low temperature of evaporator,∼1.5 kK,mostly Pb vapor gets into the discharge gap and plasma consists of Pb particles [19].When the Pb in the evaporator runs,out we increase the temperature to ∼1.8 kK and evaporation of Ag starts,Ag replaces Pb in plasma flux.The discharge gap is covered by quartz casing that limits volume inside the arc source and prevents the vapor expanding to the chamber.A portion of vapor deposits inside the discharge gap but can reevaporate under arc operation.
The source generates a plasma flux that expands through the anode of the source along magnetic field force lines.The arc voltage is 18–20 V at the arc current of 35 A.The plasma of the source is presented mostly by neutrals and singly ionized atoms of the mixture components.The charge of ions is monitored by analysis of plasma radiation spectrum.The ion saturation current in the after anode region is on the level of 150–300 mA.
Expanding from the source,Pb and Ag ions appear to the area of action of radial electric and axial magnetic fields.Trajectories of heavy and light ions spatially separate and particles are captured by a water-cooled diagnostic substrate.The background plasma compensates space charge of ion fluxes and supports the separation process.The substrate has a form of a side of a cylinder with radius ≈18 cm.288 square stainless steel cells of 1.8 × 1.8 cm2are installed on the substrate surface.The cells might be weighed before and after the experiment to determine a distribution of collected mass of separated fluxes.The cells are arranged in 18 columns along the axial coordinate and 16 rows along the azimuthal coordinate.
Figure 1(b) shows a mutual arrangement of the plasma source and diagnostic substrate.A cylindrical coordinate system is determined as follows.The origin is situated on the chamber axis in a plane of the plasma source anode.The longitudinal axis of symmetry of the diagnostic substrate matches the plane,φ=0,that is rotated on 30°from vertical.The substrate is located at a distance r=15 cm from the chamber axis and along azimuth it lays within the range−45° < φ <+45°.Along the axis,the substrate has coordinates 0 < z < 32.5 cm.The source anode has coordinates r=18 cm,φ=240°,z=0 cm.The area of the vacuum chamber where the plasma flux expands is limited by coordinates 0 < z < 75 cm.
To determine the image of substance deposition (that avoided substrate)we used a system of side collectors situated on the side surface of the experimental chamber.It is presented by a set of 10 rods.The rods are arranged near the side surface of the chamber at the distance r ≈ 40 cm with 30°step by φ (figure 1(b)).On every rod,5 aluminum square mass receivers with dimensions 1.5 × 1.5 cm2are placed.Mass receivers have coordinates z=5,15,25,35,45 cm.Rods are absent under the substrate.The mass receivers were weighed before and after the experiment with precision of 0.05 mg for measurement of deposited masses.Sticking coefficient of the substance is assumed to be equal for every mass receiver.In figure 2,a photo of the experimental chamber with arranged side collectors is presented.
3.Experimental results
A typical experiment on plasma mass separation of Pb and Ag fluxes continues for 60 min.In the first half of the experiment,the ion flux of the source is presented mostly by Pb particles and in the second half by Ag particles.During the experiment,the substance that is not involved in separation process (lost substance) accumulates on the chamber walls and side collectors.Figure 3(a) shows the results of lost substance deposition on side collectors in the mass-separation experiment.The mass deposited on the area between receivers was interpolated by the nearest-neighbor method.
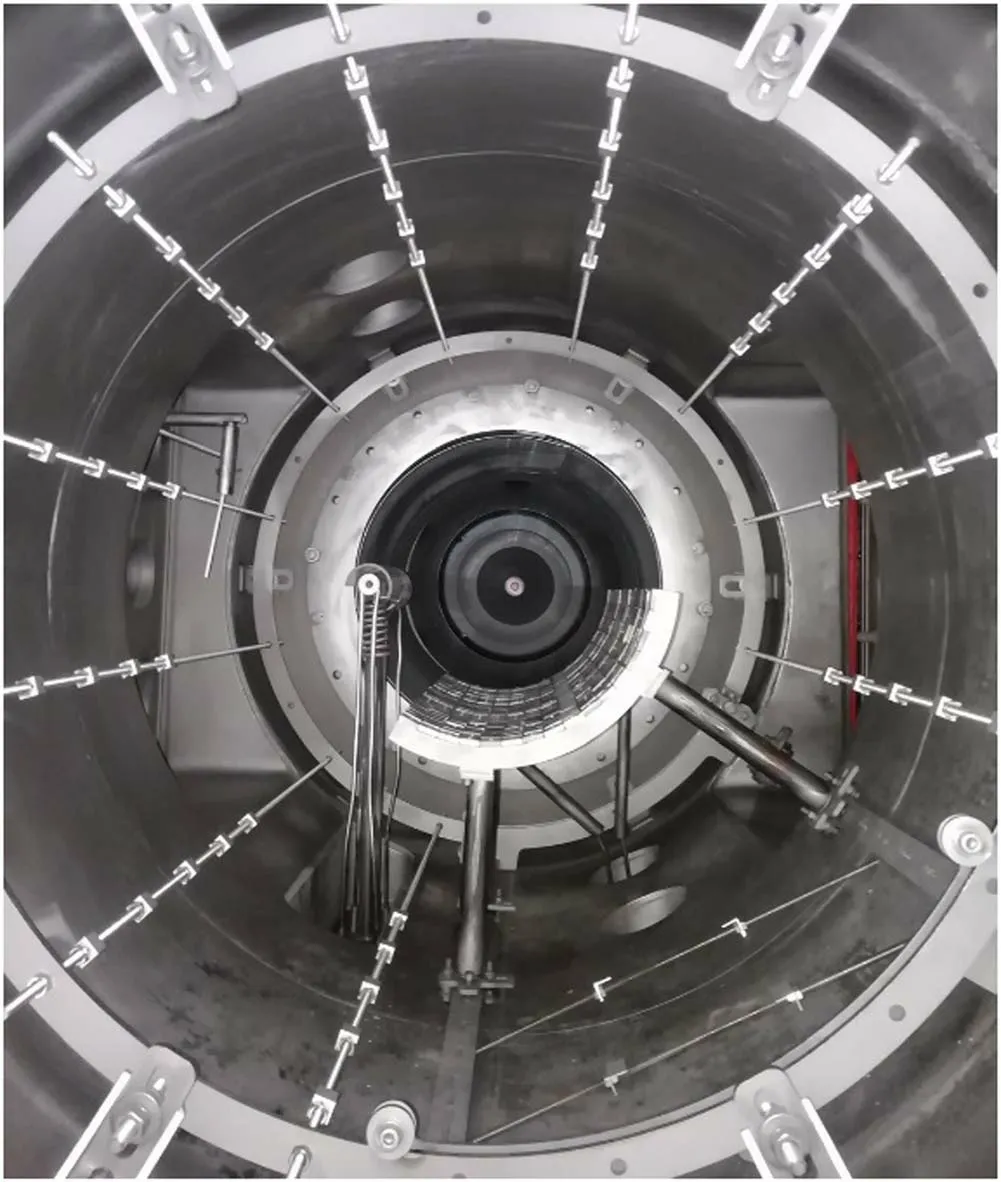
Figure 2.Side collectors arranged inside the experimental chamber.
The image (figure 3(a)) of deposition of the lost substance during the separation process has a localized maximum(spot) near the coordinate z ≈ 25 cm,φ ≈ 250°.The azimuthal coordinate of the spot corresponds with the shortest distance between the source and the chamber wall.The spot is shifted from the source along z.The location of the spot is defined by the particle law of evaporation.
The image of deposition in the separation experiment was compared with the result of deposition in two calibration experiments.In the first experiment,only the plasma source was operated in absence of radial electric field,and the reflex discharge was switched off (figure 3(b)).In the second one,only the reflex discharge was operated in absence of Pb an Ag plasma fluxes,and the plasma source was switched off(figure 3(c)).The first experiment lasted 30 min and only Pb flux was generated.Consequently,to match the amount of substance during 60 min of experiment,the initial data of deposited mass were multiplied by 2.
Figure 3(b) shows that deposition intensity also has a maximum at φ ≈ 250°.Nevertheless,deposited mass was redistributed along z,and the maximum moved to z ≈ 5 cm in contrast with figure 3(a).When the reflex discharge was switched off,ions from the plasma source moved dominantly in a straight direction along magnetic force lines to the end electrodes and were unable to drift across without crossed E × B fields.In the presence of electric field,ions change their trajectories and majority of them transport to the substrate.However,part of the ion flux scatters due to oscillations of electric potential in plasma,collisions,and transient processes.So,in the separation experiment(figure 3(a))both ions and neutrals can reach the side collectors,while in absence of radial electric field (figure 3(b))only neutral particles can reach the side chamber wall.

Figure 3.Deposition image on the side collectors in the (a) separation experiment,(b) experiment with individual operation of the plasma source,and (c) experiment with individual operation of reflex discharge.
In the second calibration experiment,deposition spots are absent(figure 3(c))but values of deposited masses differ from zero.A source of additional mass is a process of end electrode spraying by argon ions[20]due to the fact that end electrodes are the cathode of the reflex discharge.The material of the cathodes is stainless steel consisting of 60% of iron.The spraying must occur as well in the separation experiment.The deposition of sprayed material of the end electrodes will be called ‘background’ deposition.The average intensity of the background deposition is about 0.3 mg per 60 min of experiment.

Table 1.Component composition of surface layer of mass receivers.
Surfaces of some mass receivers that were installed in the separation experiment were analyzed by EDS.The mass receivers being analyzed are marked by red frames in figure 3(a).The obtained component composition of surface layers is presented in table 1,which shows the data on relative content of elements in the surface layer of the mass receiver.The deposition intensity on these receivers was different and deposited layers have different thicknesses.Thus,the EDS electrons can reach the surface of the receiver;this is why aluminum is presented in table 1.
The table 1 data show that every analyzed area marked in figure 3(a)—in the spot (receiver 1),on the spot borders(receivers 2 and 3),and also far from the location of plasma source (receiver 4)—contains iron,a construction material.Moreover,we can indicate that Pb released by the plasma source deposits everywhere(3%of amount on the receiver 4).The deposition spot consists mainly of Pb and away from the spot the Pb relative amount is comparable with the iron amount.
4.Analysis of deposition results on the side collectors
The data of mass distribution on side collectors presented in figure 3 allow us to estimate the law of particle distribution by their direction of leaving the plasma source.As it is known,the law of evaporation [21]from a small orifice is
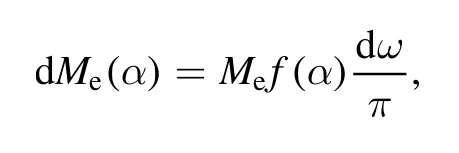
where Meis an overall amount of evaporated mass,α is the direction of evaporation in relation to the surface normal from where the evaporation occurs,dω is an element solid angle in the direction of evaporation,and f(α) is a function that determines the law of evaporation.In the case of a point evaporator,f(α)=cos(α).From the law of evaporation,we can obtain a deposition law on an arbitrary substrate located at a distance from the source.The element of the substrate has area of dS=ρ2dω/cosθ,where θ is angle of incidence on the substrate and ρ is a distance between the evaporator and the element of the substrate.Thus,mass of deposited substance on the element of area is

Angles of incidence θ,distances ρ,and directions α relative to the anode of the source were calculated for every mass receiver.Actual size of mass receiver was assumed as dS,and deposited mass on it was assumed as dM.All parameters of mass receiver—location,area and deposited mass—were included in a value of reduced deposited mass.The experimental data of reduced deposited mass versus the direction of evaporation α were plotted in figure 4.Figure 4(a) corresponds to the separation experiment and figure 4(b) corresponds to the experiment with individual operation of plasma source in absence of radial electric field.
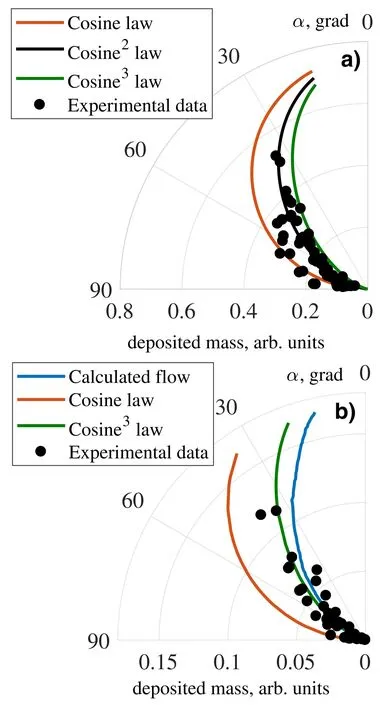
Figure 4.Reduced deposited mass dependency on direction of evaporation for the separation experiment (a) and single plasma source operation experiment (b).
For comparison of experimental law of evaporation with standard laws,we added cosine laws of evaporation in figure 4.We can see that the law of evaporation in the separation experiment (figure 4(a)) coincides better with cos2(α).Absence of strong deviation from analytical curve indicates that mainly neutral particles deposit on side collectors in the separation experiment.Electromagnetic field does not influence on their trajectories and particles deposit on diametrically opposite mass receivers almost equally.
In figure 4(b),the experimental curve coincides better with the law of cos3(α).In other words,particle flux squeezed to the axis z.Also,in figure 4(b),the result of hydrodynamic simulation of neutral Pb vapor outflow from the source made with the use of nonPDPSIM[22]is presented.The simulation was made for vapor pressure of 18 Torr inside the source,corresponding to the crucible temperature of 1.5 kK.The results of the simulation predict narrower particle outflow than we have in the experiment,but we see a qualitative coincidence.
The laws of evaporation f(α) for the separation experiment and for the experiment with single plasma source operation are different.This may occur due to the following effects.The first reason is that in the separation experiment the reflex discharge adds a background deposition of sprayed material of the end electrodes.The background deposition simultaneously increases the masses of all mass receivers.If we look to figure 4(b),additional deposited mass will shift the experimental points along the radial coordinate of the plot and the flux will expand.The second reason is that in the separation experiment,the plasma source operates at two evaporator temperatures whereas in the experiment with single plasma source it operated only at one temperature of Pb evaporation.Increase of the evaporator temperature during the experiment could expand the law of evaporation f(α).For example,it may occur due to the increase of the plasma source electrode temperature where separated substances reevaporate.
The evaluated law of evaporation allows us to analyze deposition of neutral flux from the plasma source on the substrate that collects separated substance.Partial deposition from the plasma source is possible due to their close mutual arrangement (figure 1).The deposition of neutral flux could overlap the deposition spots of separated fluxes and distort experimental data.Figure 5(a) shows the deposition image of separated substances on the diagnostic substrate.Figure 5(b) shows the deposition image in the experiment with individual operation of the plasma source.To speed up a preparation process in the experiments,we collected data of deposition from every third column of the substrate cells.It was assumed that both neighbors of the weighted cell have the same deposited mass.Figures 5(c)and (d) present calculated deposition of neutrals leaving the plasma source with laws of cos2(α) and cos3(α)correspondingly.
Figure 5 shows that actual deposition intensity of neutrals(figure 5(b)) is about an order of magnitude lower than the flux of separated substance(figure 5(a)).At the same time,the deposition spot of the separated substance on the substrate(figure 5(a)) does not overlap with the deposition spot of neutrals,leaving the plasma source under analytical laws of evaporation(figures 5(c)and(d)).If the neutrals deposition is intense,it also will not distort the image of deposition on substrate in the separation experiment.In addition,the obtained data show that the image of deposition on substrate in the separation experiment is a direct result of deposition of separated ions.
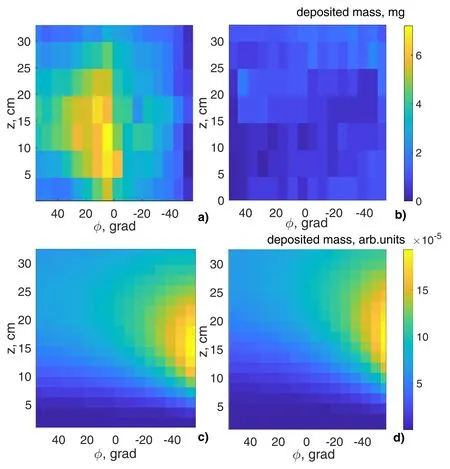
Figure 5.Deposition images on the diagnostic substrate r=15 cm.(a)Separation experiment.(b)Experiment with individual operation of plasma source.(c) Deposition by the law of evaporation cos2(α).(d) Deposition by the law of evaporation cos3(α).
The obtained data of mass deposition on side collectors helped us to estimate an amount of substance,leaving the source but avoiding the separation process.Here,we assumed that sticking coefficient was equal to 1.The deposition data were extrapolated from the coordinates of 0 < z < 45 cm to the whole area of the experimental chamber 0 < z < 75 cm.It was assumed that the derivative dm/dz is constant after z=45 cm.The background deposition was subtracted.Then,we interpolated data to the area of the wall where the mass receivers were absent.Finally,the obtained deposition image was integrated.Thus,the estimated value of the lost substance(avoiding the separation process) is ∼7 g,and by weighing,we determined that ∼10 g of mixture of Ag and Pb left the plasma source during 60 min of the experiment.On the diagnostic substrate,∼1 g of substance was deposited;the rest of the substance was deposited on other parts of experimental chamber,particularly on the end face of the chamber.The results of these estimates are helpful for the analysis of the whole mass balance of the substance in the separation experiment.
5.Conclusion
In conclusion,we described a diagnostic arrangement for the detection of lost substance in plasma mass-separation experiments.In other words,we detected the substance that avoided the separation process.The diagnostic includes a set of collectors that were weighed before and after the experiment to obtain deposited mass.
We determined the location of deposition of a large portion of the substance that left the arc source (ion and neutral fluxes).The obtained deposition coincides with calculation results.We showed that part of the deposited substance on the side wall of the experimental chamber is a result of end electrode spraying by reflex discharge.With the help of collected data,we determined the law of evaporation of neutral particles that leaves the plasma source in the experiment.The law of evaporation is proportional to cos2(α),where α is the direction of particle outflow.We showed that particles evaporated in accordance with the obtained law are unable to overlap the deposition image of separated fluxes on the substrate.
This work draws attention to the problem of incomplete ionization of working substances in test experiments on plasma mass separation.Incomplete ionization and unoptimized conditions of ion transport during test experiments generate losses of substance that deposit where not expected.The described system of collectors is helpful to analyzing and evaluating the efficiency of the process of plasma mass separation during the testing of the separation scheme.
Acknowledgments
The study was funded by the Russian Science Foundation(No.21-19-00716),https://rscf.ru/en/project/21-19-00716/.
ORCID iDs
 Plasma Science and Technology2022年8期
- Plasma Science and Technology的其它文章
- Image-based plasma morphology determination and LIBS spectra correction in combustion environments
- Rapid identification of volatile organic compounds and their isomers in the atmosphere
- Fast identification of mural pigments at Mogao Grottoes using a LIBS-based spectral matching algorithm
- Aqueous ruthenium detection by microwaveassisted laser-induced breakdown spectroscopy
- Effect of lens-to-sample distance on spatial uniformity and emission spectrum of flat-top laser-induced plasma
- Quantitative analysis of the main components in ceramic raw materials based on the desktop LIBS analyzer