
Classification of steel based on laserinduced breakdown spectroscopy combined with restricted Boltzmann machine and support vector machine
2022-09-14 08:18QingdongZENG曾庆栋GuanghuiCHEN陈光辉WenxinLI李文鑫ZitaoLI李孜涛JuhongTONG童巨红MengtianYUAN袁梦甜BoyunWANG王波云HonghuaMA马洪华YangLIU刘洋LianboGUO郭连波andHuaqingYU余华清
Plasma Science and Technology 2022年8期
Qingdong ZENG(曾庆栋),Guanghui CHEN(陈光辉),Wenxin LI(李文鑫),Zitao LI (李孜涛),Juhong TONG (童巨红),Mengtian YUAN (袁梦甜),Boyun WANG (王波云),Honghua MA (马洪华),Yang LIU (刘洋),Lianbo GUO (郭连波) and Huaqing YU (余华清),∗
1 School of Physics and Electronic-information Engineering,Hubei Engineering University,Xiaogan 432000,People’s Republic of China
2 Wuhan National Laboratory for Optoelectronics (WNLO),Huazhong University of Science and Technology,Wuhan 430074,People’s Republic of China
3 Faculty of Physics and Electronic Science,Hubei University,Wuhan 430062,People’s Republic of China
Abstract In recent years,a laser-induced breakdown spectrometer (LIBS) combined with machine learning has been widely developed for steel classification.However,the much redundant information of LIBS spectra increases the computation complexity for classification.In this work,restricted Boltzmann machines(RBM)and principal component analysis(PCA)were used for dimension reduction of datasets,respectively.Then,a support vector machine (SVM) was adopted to process feature information.Two models(RBM-SVM and PCA-SVM)are compared in terms of performance.After optimization,the accuracy of the RBM-SVM model can achieve 100%,and the maximum dimension reduction time is 33.18 s,which is nearly half of that of the PCA model(53.19 s).These results preliminarily indicate that LIBS combined with RBM-SVM has great potential in the real-time classification of steel.
Keywords: laser-induced breakdown spectroscopy,restricted Boltzmann machines,classification,special steel
1.Introduction
The steel industry has brought economic benefits,but it also results in environmental pollution [1].Compared with virgin iron ore,using recycled steel as the raw material can reduce the energy consumption of steel production uo to 10%;CO2emissions will also be reduced significantly [2].Therefore,the rapid classification of recycling steel is vital for social development and economic construction [3].However,the conventional analysis methods to identify the quality of steels including X-ray [4],spark optical emission spectroscopy(Spark OES) [5],and inductively coupled plasma-mass spectrometry (ICP-MS) [6]have the disadvantages of complex sample preparation,comparatively long analysis time and the production of toxic waste.Thus,they are not suitable for real-time and online screening analyses in the recycling progress.
Laser-induced breakdown spectroscopy (LIBS) is a multi-element detection technology in that the elemental composition and contents of samples are detected by analyzing the plasma emission produced by laser pulse[7–9].Considering the advantages of LIBS,such as no or minimal sample preparation,rapid analysis,online analysis,no waste production,and multi-element analysis,LIBS is widely used in biomedical [10],food [11],geological [12],and industrial fields[13,14].In recent years,the combination of LIBS with machine learning algorithms has become a feasible solution for achieving highly precise steel identification [15–17].However,the high-dimensional spectra obtained in LIBS measurements include not only useful information but also redundant information,such as spectral interference and background noise.Especially,the spectrum of steel is complex,because many spectra lines of alloying elements lead to mutual interference [18],which affects the efficiency of analysis for classification.To improve the modeling efficiency,multivariate data analysis methods were used to extract feature information.
According to our literature research,principal component analysis(PCA)is widely applied to the processing of spectral data in the LIBS community [19].For example,compared with full-spectra PCA,Sungho et al [20]utilized PCA to select the important spectral lines of constituent elements as input variables for metals classification,which significantly reduced the computation time without loss of the classification accuracy.Vors et al[21]achieved the high robustness of the identification of alloys by applying both soft independent modeling of class analogy (SIMCA) and PCA.Narla et al[22]used PCA combined with SVM to identify alloys,and great classification accuracy was achieved.However,PCA has a limitation in dimensionality reduction for large datasets,because PCA needs to load the full dataset to memory at once[23,24],which leads to high computing power and long computation time.Moreover,for similar steel samples with slight differences in concentration,PCA only focuses on the variances among original input,thereby easily mitigating some smaller differences among the data [19].
Restricted Boltzmann machines (RBM) [25]are a generated stochastic neural network that can capture feature information with high correlation from a dataset through batches,which can reduce the high computing power in the calculation process.Vrábel et al [24]performed RBM and PCA to reduce the dimension of a large dataset,and the results indicated that compared with PCA,RBM took less computation time,and only the reconstruction error was slightly worse.However,to the best of our knowledge,studies about LIBS combined with RBM are seldom reported.
In this paper,we proposed a LIBS classification method of special steels based on the combination of RBM and SVM(RBM-SVM).Moreover,the classification performances of RBM-SVM and PCA-SVM were compared.
2.Experimental set-up and methods
2.1.Experimental set-up and sample
A schematic of the experimental set-up is illustrated in figures 1(a) and (b).A compact Q-switch Nd:YAG pulsed laser (Bigsky Co.,Ltd;US) operating at 532 nm (repetition rate: 10 Hz,max pulse energy: 29 mJ) was used to produce plasma by ablating samples.After coupling with the optical fiber (Φ: 1 mm),the laser beam was reflected by a dichroic mirror and then focused through a UV-grade quartz lens(focal length: 100 mm,Φ: 25.4 mm) onto the steel sample surface.The optical emission of LIBS plasma was collected by a UV-grade quartz lens and via an optical fiber fed into a compact time-integrated AvaSpec-2048 spectrometer (spectral range: 295–1020 nm,spectral resolution: 0.08–0.11 nm).Then,the spectral data were transferred to a computer.The spectrally resolved lines were detected via a gated 2048-pixel CCD device (Sony 554).During the spectra acquisition,the delay for laser pulse and the integration time were 1.3 μs and 1.1 ms,respectively.
Thirteen special steel samples (Inner Mongolia North Heavy Industries Group Corp.,Ltd) were used in this work.The concentration of matrix element (Fe) in the steel sample was over 90%.The concentration information of trace elements in steel samples is listed in table 1.The computer system is Intel®CoreTMi5-6200U CPU(2.30 GHz)and 8 GB of computer memory.The numerical analysis was implemented by MATLAB (MathWorks,R2017a).
2.2.Data analysis algorithm
RBM is an energy-based generative model that is used to compute the probability distribution through input data.The higher probabilities(low energy)of the specific training vectors can be raised by optimizing the parameters of the model [26].RBM consists of a visible layer of m units and a hidden layer of n units,where the units in different layers are connected with symmetric weights.To obtain the least energy model,RBM uses the energy function in equation (1) to assign the probability distribution through input data by encoder–decoder architecture.It could be applied to dimension reduction,classification,feature learning,and object recognition [27].
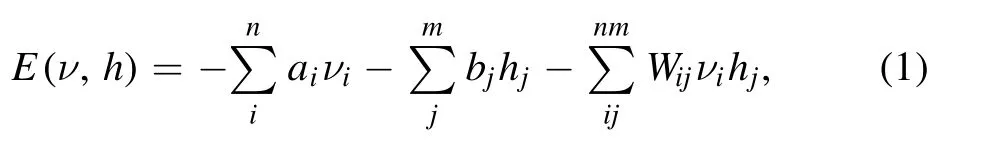
where Wijis the connection weights between visible units vi,and hidden units hj,ai,and bjare the biases of visible and hidden units,respectively.The feature information(hidden variables)can be rapidly computed from input (visible variables) by batches,and the correlation between feature information and input can be assessed in the decoder progress.Generally,the dimension of hidden variables was lower than that of visible variables,which can avoid the redundancy of the input data.
PCA is an unsupervised statistical method that is used for dimension reduction.It can extract low-dimensional new variables called principal components (PCs) by the orthogonal transformation of the high-dimensional input variables.According to the significance of each PCs,as ranked by their variance values,the obvious spectral variability information from the input can be retained in the first certain number of PCs.By selecting PCs rather than the original variables for mathematical modeling,the demands on the computing power and modeling time can be reduced [19,28].
SVM is a typical supervised classification method that is widely applied for steel classification in the LIBS field[22,29].It can map the input data into a high-dimensional space by the radial basis function (RBF) kernel,and a separating hyperplane is used to identify the class of input data in a high-dimensional space[30].The performance of the SVM model can be improved by optimizing the penalty parameter C and kernel parameter g.In this work,we used SVM to classify steel samples by using new variables(extracted by RBM or PCA algorithm) as input,and the performances of RBM-SVM and PCA-SVM were compared.
3.Results and discussion
3.1.Data pre-processing
To avoid the influence of inhomogeneity in the sample,each spectrum was an average of 10 LIBS measurements.Ninety spectra were collected for each sample from different positions on the sample surface.In total,1170 spectra were acquired from 13 steel samples for LIBS analysis.Then,10 spectra of each sample were randomly selected as test set(130 spectra),whereas the remaining spectra were divided into two groups of datasets: training set (832 spectra) and validation set(208 spectra).5-fold cross validation was used to evaluate the classification performance in this work.
The LIBS spectra of 13 steel samples are shown in figure 2.Serious spectral interference and slight difference in spectral data of steel samples were observed,making their direct classification difficult.Considering the less and weaker spectral intensities of the original spectral data in the wavelength range of over 800 nm,the data were cropped to speed up the computing time,resulting in a spectrum with 8400 variables (spectral range: 291–797 nm).To reduce the spectral variations in LIBS data,the scale of peak intensities of each spectrum was normalized to the range of 0–1 by the equation (2).

where the X and Y represent the original and normalized intensity values of the LIBS spectrum in each wavelength variable;Xmaxand Xminare the maximum and minimum of X,respectively.
3.2.Reconstruction after dimension reduction
A major drawback of PCA is that it assumes that the weights are orthogonal,which is in general not true.PCA,which may not be efficient enough to describe the nonlinear properties within the spectra,is a linear method and does not extract the complex features in the data.The feature extraction of PCA is time-consuming and storage-consuming if there is a large dataset while RBM does not have these problems.RBM is a generalization of nonlinear PCA,but it needs less storage space than PCA as only the training sets are required to store.In this work,the high-dimensional data matrix of the training set(832 rows and 8400 columns)was transformed into a lowdimensional feature information matrix and later reconstructed back.By reconstructing the original data matrix,we can obtain the reconstructed data matrix.The reconstruction error,which is used as a reference to compare the feature extraction ability between PCA and the RBM models,is the intensity value difference between the original spectrum and reconstructed spectrum in each wavelength variable.
The RBM model with a hidden layer consisting of 25 units was designed to reconstruct the training set.The spectra were fed to the model in batches (one-thirteenth of the training set: 64 spectra).The values of momentum and learning rate are set to 0.05 and 0.5,respectively.Figure 3 shows the performance of the RBM model in the training progress.It can be found that the reconstruction error was obviously decreased in the first 10 epochs and reduced to the minimum value in the 100 epochs,whereas the computing time was only 22.02 s.Considering the small reconstruction error and the relatively low computing time,the epochs were set to 100 for the RBM model.Then,similar results were obtained for the training set,one of which is shown in figure 4.Figure 4 shows that the reconstructed spectrum has considerable overlap with the original spectrum in terms of specific features,such as line positions and normalized intensity.Only a few spectral intensities were slightly higher,which indicated that RBM has a good feature extraction ability for spectral data.
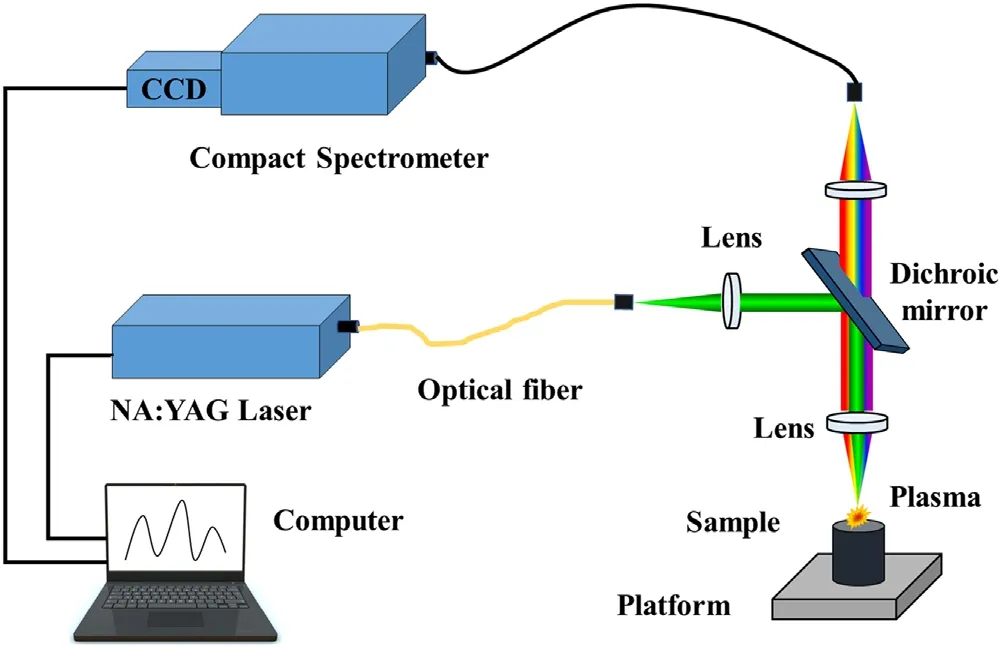
Figure 1.Schematic of LIBS system.

Figure 2.Spectrum signal obtained by LIBS set-up.

Figure 3.The training progress of the RBM model.

Figure 4.Comparison of the normalized intensity between the original spectrum and reconstructed spectrum.

Figure 5.Comparison of the reconstruction errors between PCA and RBM models by reconstructing from feature information with different dimensions: (a) 5,(b) 10,(c) 15,and (d) 20 dimensions.
To further validate the feature extraction ability of RBM for LIBS spectral data,PCA was used to compress the training set for feature extraction.Then,it was later reconstructed back.Considering the similar results for all data,the average errors of all reconstructed spectra(from sample No.1 in the training set) were used for evaluation.As shown in figures 5(a)–(d),the average reconstruction errors of PCA and RBM models were compared.The original data with 8400 variables were reduced to four reconstructed data in the lower dimension (5–20).
In each experiment,the maximum absolute value of reconstruction error was obtained by the PCA model,and the value was basically higher than the RBM model in the spectral range from 400 to 450 nm.In contrast,except in this spectral range,the error reconstructed from relatively higher dimension (figures 5(c) and (d)) information by the PCA model could be ignored.These results indicated that RBM is more suitable for processing data with high spectra intensity.
3.3.Classification with RBM-SVM and PCA-SVM
We used SVM to classify steel samples by using different numbers of dimensions of extracted feature information as the input.The results were used to evaluate the performance of the RBM-SVM and PCA-SVM models.Considering the influence of penalty parameter C and kernel parameter g for classification performance,a grid search combined with a 3-fold cross-validation method was used to optimize these parameters of the SVM model.Table 2 shows the comparison results between the optimized RBM-SVM and PCA-SVM models with different numbers of dimensions (5–40) of the extracted feature information in three datasets.

Table 1.Certified concentrations of trace elements in steel samples (wt.%).

Table 2.Comparison results between RBM-SVM and PCA-SVM models.
It can be seen that an accuracy of 100% could be achieved by the PCA-SVM model with increasing PCs as input,and the accuracy of the RBM-SVM model (ranging from 99%to 100%in most cases)was slightly lower than that of the PCA-SVM model in different datasets.However,PCA needed to load the full dataset to memory at once,which led to high computing power requirements and long computation time depending on the data size.A possible reason is that the correlations between hidden units are not explicitly fitted from the data,which means that the feature information extracted by the RBM model is not enough representative and useful.It causes the accuracy of the RBM-SVM model to be less than that of the PCA-SVM model.The more useful feature information for classification might be extracted in
deep layers of the deep belief network (DBN) which is composed of multiple RBM layers and has good feature extraction ability.Section 3.2 shows that PCA only focused on the variances among original input data and had higher reconstruction error for strong spectral lines.Moreover,the dimension reduction time of the RBM model(18.80–33.18 s)was gradually increased with increasing numbers of the dimension of extracted information,but this was significantly lower than that of the PCA model (53.19 s).The reason for this result is that the computational process of RBM was trained in batches to reduce computing power requirements;thus,it was faster than PCA when the dimension of extracted information was low.All results indicated that the rapid and high-accuracy classification of special steels can be achieved by using the RBM-SVM model.
4.Conclusions
In this work,thirteen special steels from different brands were detected by LIBS technology.RBM was used to reduce the dimension of high-dimensional steel spectral data obtained by LIBS measurement.Its performance was compared with PCA under the same conditions.The absolute value of reconstruction error of the RBM model was basically lower than that of the PCA model in the spectral range with high spectral intensity.Compared with the PCA-SVM model,the accuracy of the RBM-SVM model can achieve over 99%,and the dimension reduction time of the best results was reduced to 22.02 s from 53.19 s.Furthermore,by optimizing the structure of the RBM model,a low reconstruction error of spectra was obtained in all variables,thereby indicating that high and stable classification accuracy can be achieved.These results preliminarily indicated that LIBS combined with RBM-SVM had great potential in the real-time classification of steel.
Acknowledgments
This work was supported by National Natural Science Foundation of China (No.61705064),the Natural Science Foundation of Hubei Province (No.2021CFB607),the Natural Science Foundation of Xiaogan City(No.XGKJ202-1010003),and the Project of the Hubei Provincial Department of Education (No.T201617).
ORCID iDs
猜你喜欢
Chinese Physics B(2022年10期)2022-10-26
今日民族(2022年9期)2022-10-09
中国典型病例大全(2022年11期)2022-05-13
海峡姐妹(2020年6期)2020-07-25
科学与财富(2019年31期)2019-10-21
世界家苑(2018年11期)2018-11-20
当代旅游(2018年6期)2018-04-21
美与时代·城市版(2018年2期)2018-04-13
新高考·英语基础(高一)(2016年7期)2017-07-06
微型小说选刊(2015年17期)2015-11-18
 Plasma Science and Technology2022年8期
- Plasma Science and Technology的其它文章
- Image-based plasma morphology determination and LIBS spectra correction in combustion environments
- Rapid identification of volatile organic compounds and their isomers in the atmosphere
- Fast identification of mural pigments at Mogao Grottoes using a LIBS-based spectral matching algorithm
- Aqueous ruthenium detection by microwaveassisted laser-induced breakdown spectroscopy
- Effect of lens-to-sample distance on spatial uniformity and emission spectrum of flat-top laser-induced plasma
- Quantitative analysis of the main components in ceramic raw materials based on the desktop LIBS analyzer